
Abstract
The electrochemical behaviors of a silicon thin-film electrode in organic lithium salt solution were explored with focus on irreversible reactions of the first lithium charge and discharge cycling by using electrochemical quartz crystal microbalance (EQCM) combined with various electrochemical techniques. A considerable increase in mass of the silicon electrode was observed during lithium charging even before lithium absorption into the electrode, which is ascribed to the buildup of electrolyte reduction products on the silicon surface. Galvanostatic charge–discharge experiments combined with ac impedance spectroscopy demonstrate a significant overpotential growth and an aggravating capacity for the lithium charge and discharge cycling, and suggest they are due to the sedimentation of electrolyte reduction product. Additives containing alkoxy silane functional groups were evaluated as a passivation agent for lithium rechargeable batteries utilizing a silicon anode. The presence of additives in electrolyte suppressed the mass accumulation to the silicon electrode caused by irreversible electrolyte reductions and improved the electrode for cycle life. Electrochemical analyses associated with EQCM as a function of the number of alkoxy functional groups of the additives illustrate that the silicon electrode is passivated by chemical reaction of the alkoxy silane functional group of the additives with hydroxyl groups at the electrode/electrolyte interface, and this passivation improves the cycle life.
Export citation and abstract BibTeX RIS
Silicon as a negative electrode for lithium-ion batteries has been attracting significant interest because of its high specific capacity.1–6 Silicon reacts with lithium to form  alloy, showing theoretical capacity of 4200 mAh/g. Capacity retention is the most important issue for utilizing the silicon-based negative electrode.1, 2, 4 It has been generally accepted that the limited cycle life of the silicon electrode is ascribed to severe volume changes of the electrode.5, 6 Many researchers have focused on the structural modification of the silicon electrode to prolong the cycle life of the electrode.3, 4, 6 In crystalline silicon, intermetallic phases are formed during lithium charging, leading to inhomogeneous volume expansions which can cause cracking and pulverization of the silicon–lithium alloy.3, 5 Reversible lithium cycling with little capacity loss is possible for amorphous silicon thin film in which the homogeneous volume expansion occurs.5 To suppress the volume expansion during lithium charging, the silicon particle of the fine grain size uniformly distributed within a less active matrix, like graphite, has been proposed.7
Organic lithium salt solution reduces electrochemically on the silicon electrode to form a solid electrolyte interphase layer on the electrode because the lithiation potential of the silicon electrode is far lower than  . However, few studies on the interface between silicon electrode and organic electrolyte have been conducted. Unlike graphite electrode, it is reasonable to anticipate that the electrolyte reduction occurs on the silicon electrode even after the first charge–discharge cycle, because the fresh silicon surface is newly exposed to the electrolyte during the lithium cycling.8, 9 Besides, it has been reported that the surface of silicon consists of silicon oxide (–Si–O–Si–) and silanol (–Si–OH) which can reductively react with lithium ion, giving rise to irreversible capacity loss.9 Moreover, the electrochemically active area is increased as the size of silicon particle becomes smaller, which causes a lot of irreversible capacity. In these respects, the electrochemical reactivity of the interface between silicon and organic lithium salt solution is expected to play an important role in lithium secondary batteries utilizing the silicon anode. Electrochemical quartz crystal microbalance (EQCM) has proved to be an effective tool for investigating the interfacial reactions between electrode and nonaqueous electrolyte.10, 11 Kwon et al.11 applied EQCM to carbon thin films deposited by chemical vapor deposition. They successfully elucidated the electrochemical behavior of the interface between the carbon thin film and organic electrolyte.
In the present work, interfacial reactions between silicon electrode and organic electrolyte containing lithium salt were investigated by using EQCM in combination with various electrochemical methods such as cyclic voltammetry (CV), galvanostatic charge–discharge, and ac impedance spectroscopy. Additionally, we tried to modify the silicon surface by adding additives containing methoxy silane functional groups in the electrolyte. The passivation of the silicon anode in the presence of additives was discussed in terms of the modified silicon surface by chemical reactions between the methoxy group of the additives and silanol on the silicon surface.12
Experimental
Monomethoxy trimethyl silane,  , dimethoxy dimethyl silane,
  , and trimethoxy methyl silane,
  , were purchased from Aldrich and used without further purification. For the electrolyte 1.3 M
  in ethylene carbonate (EC)/diethyl carbonate (DEC) (3:7, by vol %) from Cheil Industries was used. The amount of water in the electrolyte was measured to be about 10 ppm by using Karl–Fischer titration. Lithium foil from FMC was used as the reference and the counter electrodes. Silicon was deposited on the nickel electrode attached in the middle of AT-cut quartz crystals
  by radio frequency (rf) sputtering. The thickness and electrochemical active area of deposited silicon was
  and
and  , respectively.
The structure of the deposited silicon thin film was analyzed by using X-ray diffractometry (XRD). Auger electron spectroscopy (AES) and Fourier transform infrared spectroscopy (FTIR) were applied to characterize the surface chemistry of silicon film deposited on copper foil.
The EQCM including a Faraday cage was purchased from Elchema (EQCN 703 model). The electrochemical measurement was conducted by using potentiostat/galvanostat (EG&G, model 273) interfaced with a frequency response analyzer (Solartron, SI1260) controlled by the Corrware and Zplot software from Scribner Associates, Inc.
In the CV, the electrode was polarized from open-circuit potential (OCP) of about  and then back to the OCP with a scanning rate of 1 mV/s. The galvanostatic lithium cycling of the silicon electrode was performed at a current density of
  , which corresponds to the charge–discharge rate of 1 C. The cutoff potential was
  for lithium charging and
  for lithium discharging. The resistance of interfacial layers formed during lithium cycling of the silicon electrode was assessed by using ac impedance spectroscopy at OCP with potential amplitude of 5 mV after 10 cyclings of lithium charge and discharge. The electrochemical measurements as well as assembly of the cell were conducted in a dry room in which the dew point was
  .
.
The EQCM cell has a flooded electrolyte design. Under this circumstance, it is likely that any electrolyte decomposition processes will be magnified, resulting in a greater irreversible capacity loss, as well as a greater electrode impedance due to the unrestricted growth of surface films as compared with a conventional coin-type cell.13
Results and Discussion
Characterization of silicon thin film
XRD was conducted on the silicon thin film deposited on the copper foil to determine the structure of the film. The result is shown in Fig. 1. The peaks at 43, 50, and  are from the copper foil substrate. The broad hump centered at about
  is indicative of amorphous silicon. The surface chemistry of silicon deposited on the copper foil was explored by using AES. Figure 2 demonstrates the AES depth profile of the silicon thin film deposited on the copper foil. The surface of the silicon thin film consists mainly of silicon and oxygen, indicating the existence of native silicon oxide. The thickness of native oxide was estimated to be about
  from the sputtering time in the depth-profiling AES experiment. The detailed chemistry of the silicon surface is further confirmed by FTIR. Figure 3 shows an FTIR spectrum of the silicon thin film obtained by using the single-reflectance method. The spectrum contains two pronounced peaks at around 1000 and
  . Si–O bonding and Si–OH bonding in the surface oxide of silicon are responsible for the peaks at 1000 and
  , respectively.
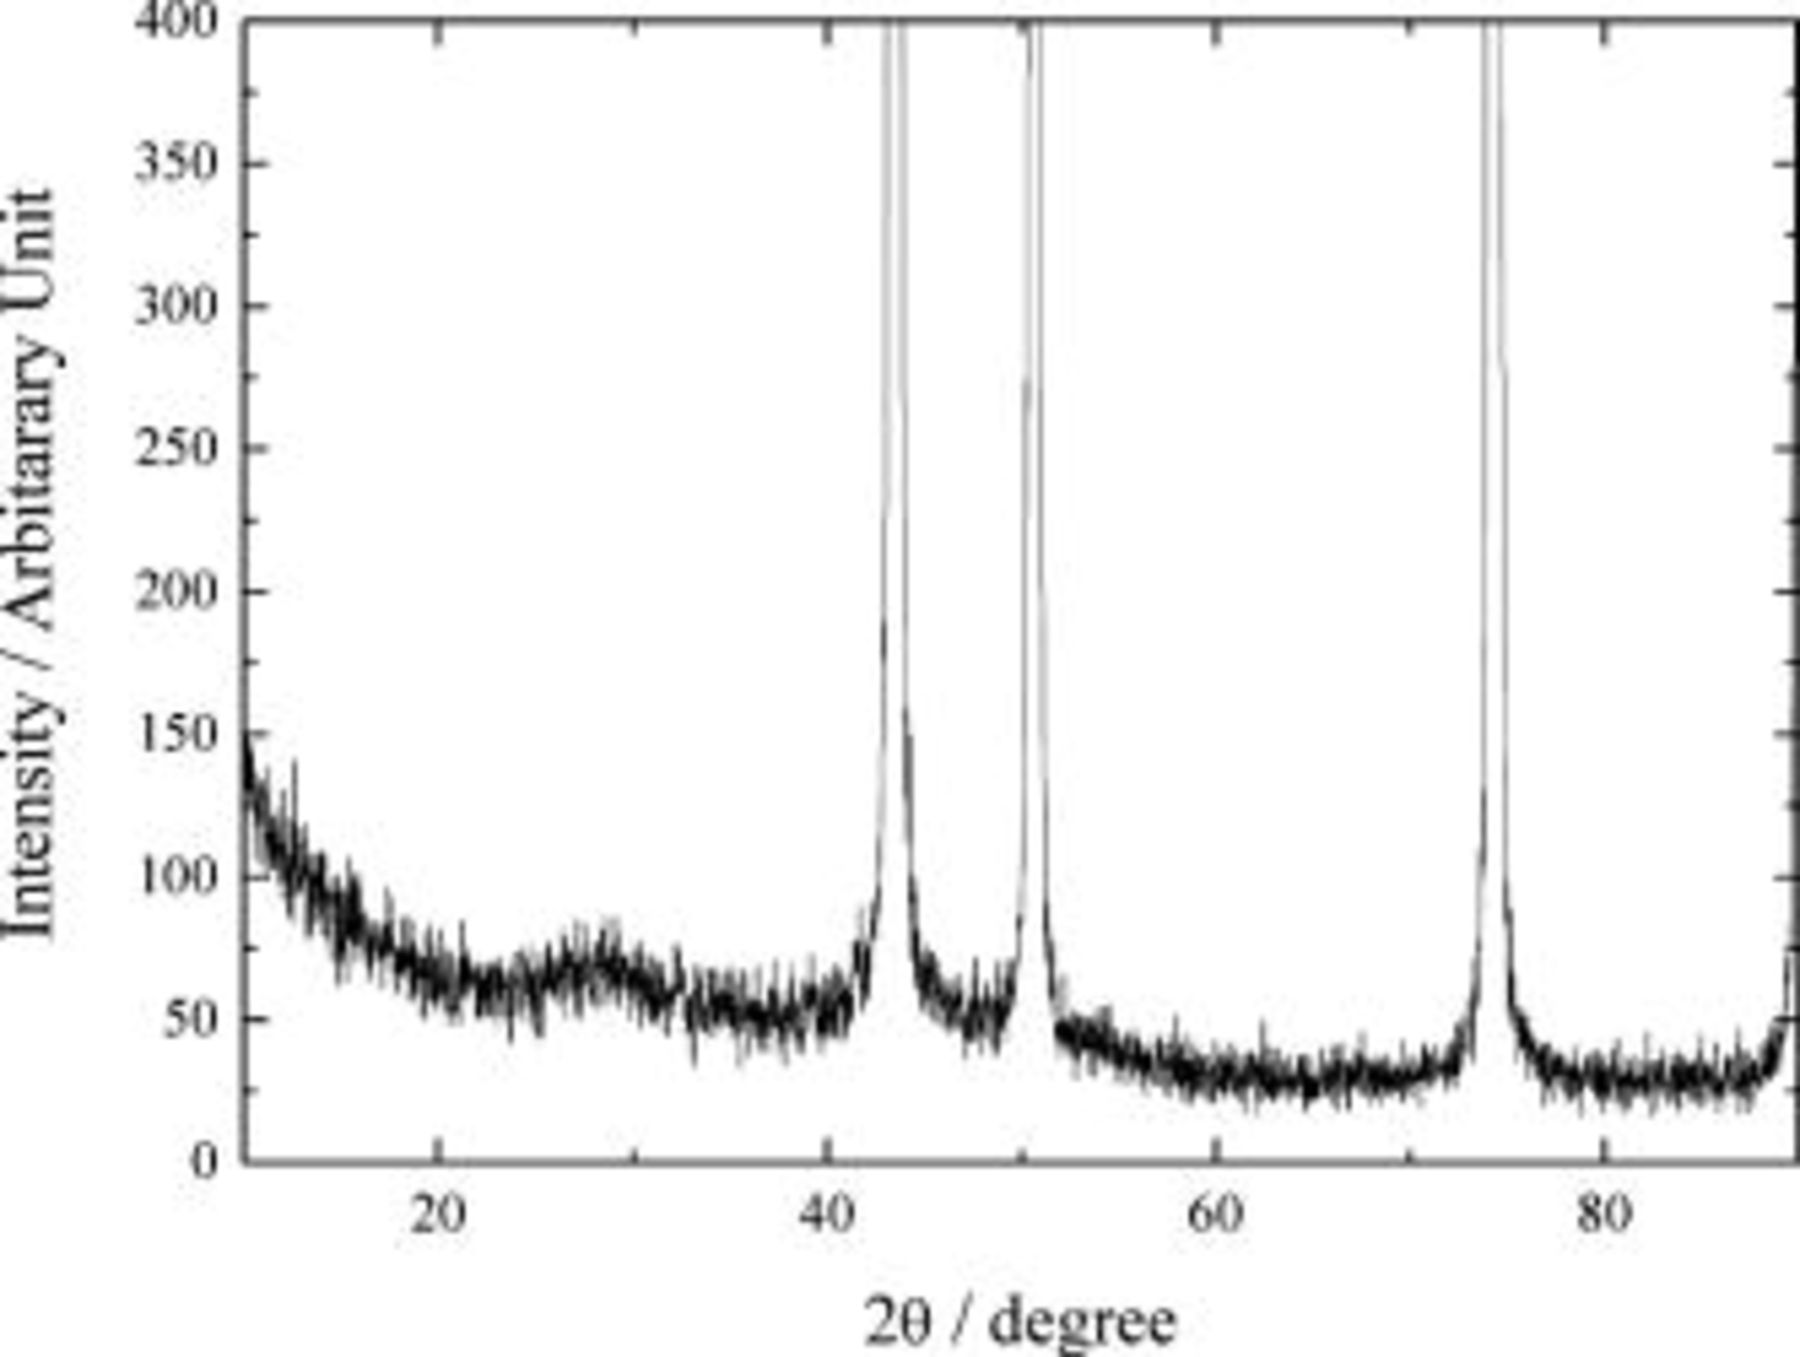
Figure 1. XRD pattern of silicon thin film on copper foil.
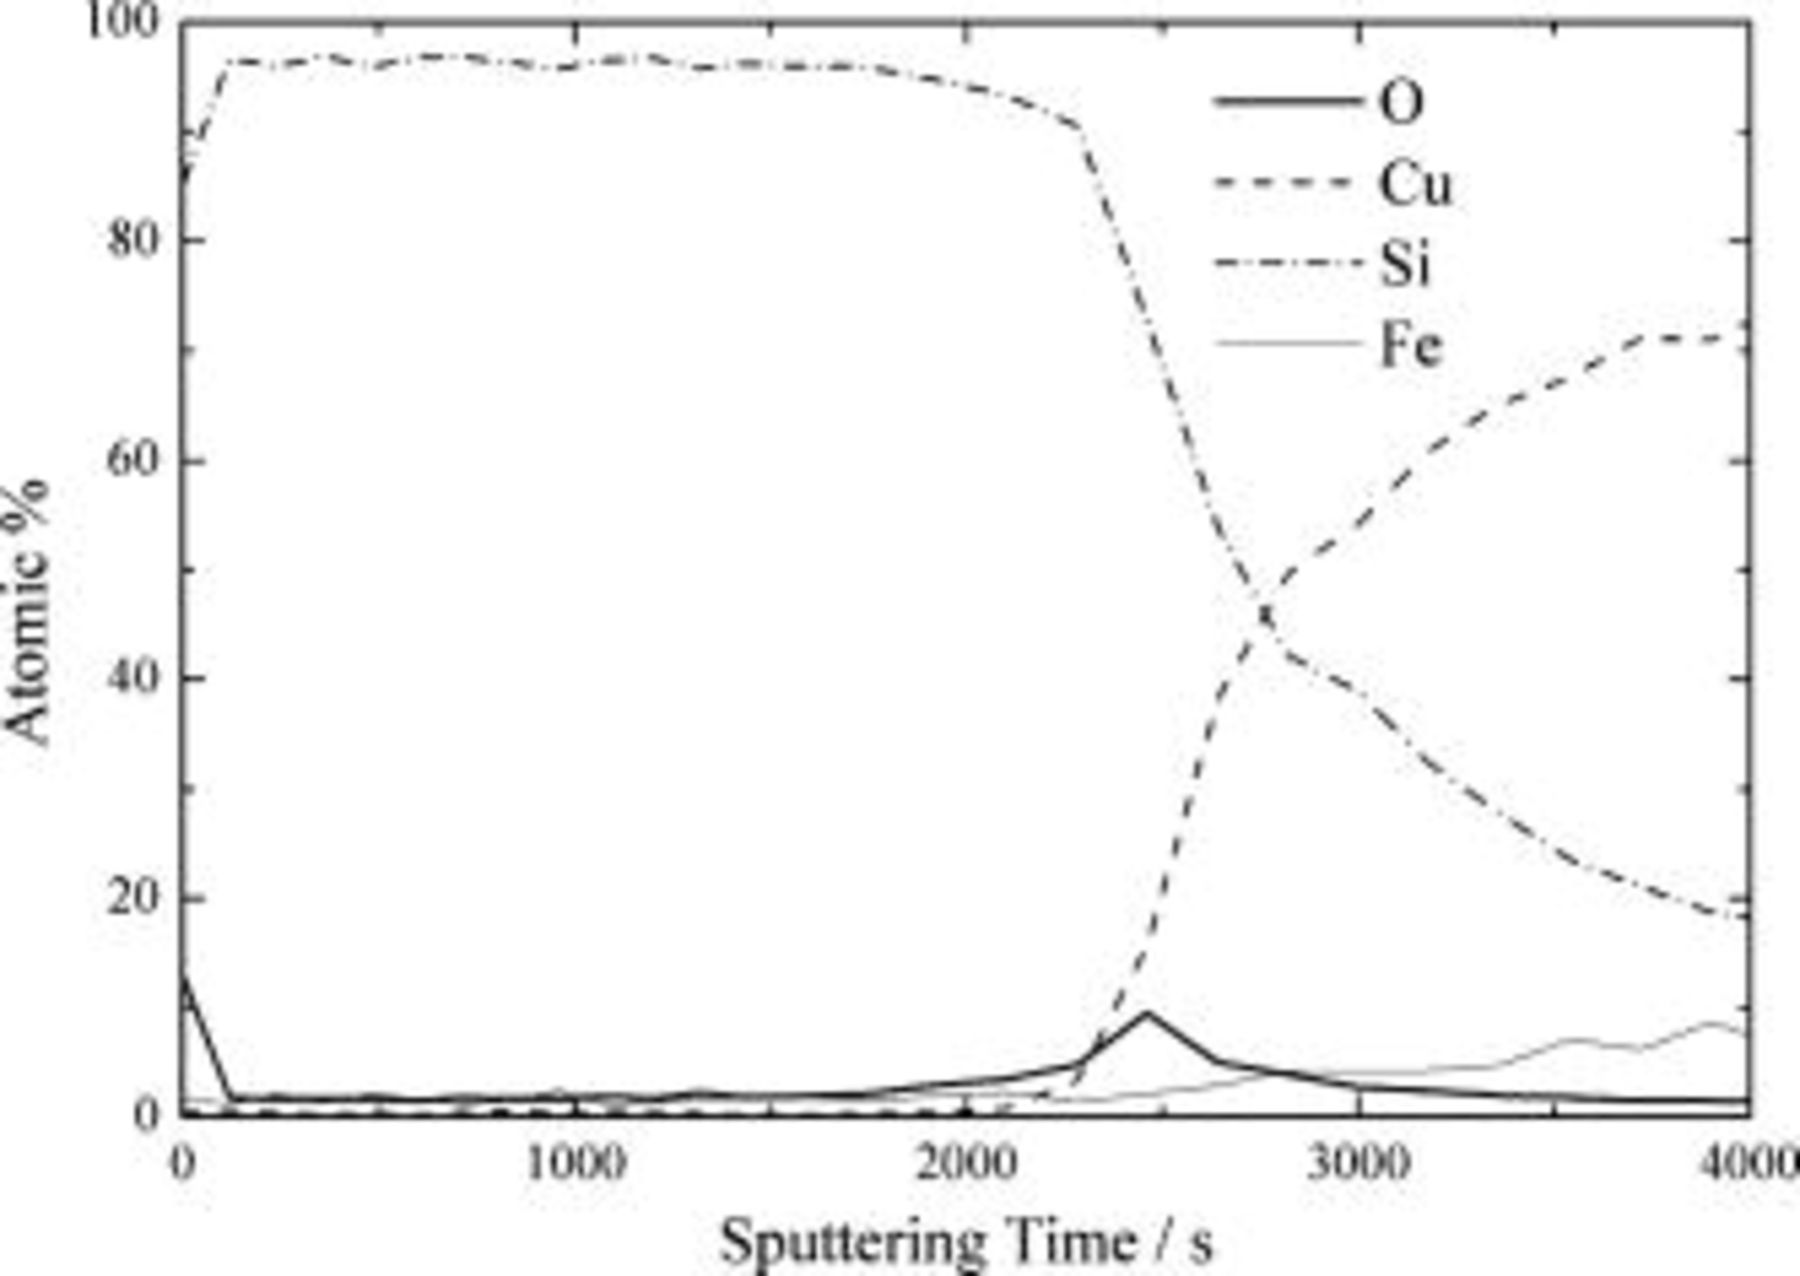
Figure 2. AES depth profile of silicon thin-film electrode deposited on copper foil by the rf-sputtering method.

Figure 3. FTIR spectrum obtained from silicon electrode on copper foil by the rf-sputtering method.

Figure 4. Cyclic voltammogram with simultaneous measurement of mass accumulation of silicon thin film deposited on nickel/quartz electrode in 1.3 M  -EC/DEC (3:7, by vol. ratio).
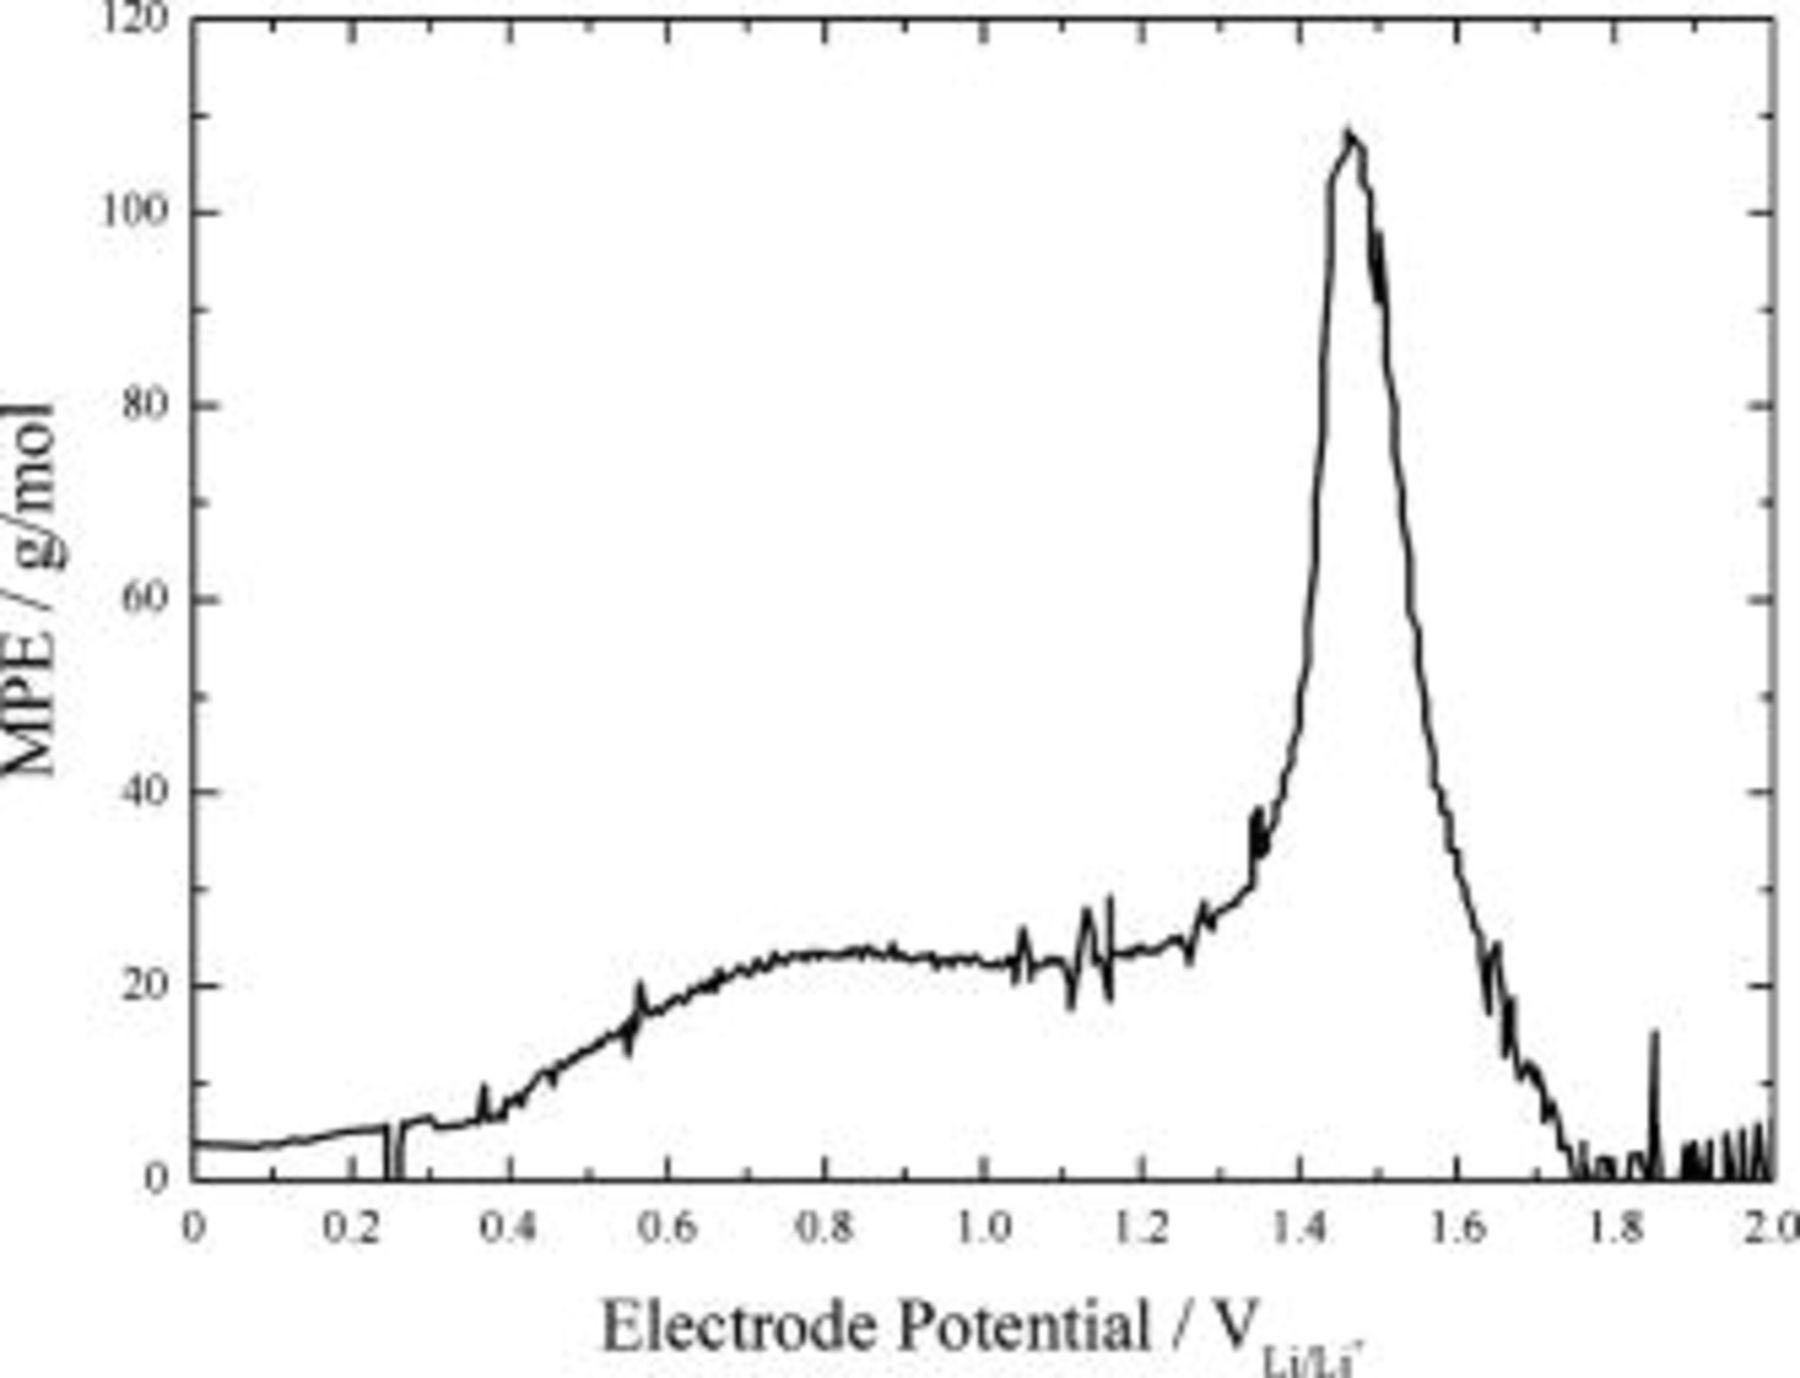
Figure 5. Plot of the MPE value vs applied electrode potential calculated from the mass accumulation during the first cathodic scan in CV.
Characterization of interfacial reactions between Si electrode and  salt solution

A change in thickness of EQCM electrode by buildup of the foreign materials results in a change in resonance frequency of the electrode. If we assume that the density and the transverse velocity associated with these materials are identical to those of quartz, the thickness change can be expressed as  , where
  is the mass change of the EQCM electrode,
  is the density of quartz, and
  is the area of quartz. Therefore, the change in resonance frequency of the EQCM electrode can be transformed to the changes in electrode mass by the well-known Sauerbrey's equation, described as follows14, 15

where  and
and  are the changes in the frequency and the mass of the electrode, respectively, and
  is a constant related to the properties of the quartz crystal. Besides, it is possible to identify the surface species formed on the electrode by the calculation of mass per mole of electrons (MPE), described as follows

where  is the charge involved in the charge-transfer processes and
  is the Faraday constant. If all the charge measured is involved in mass accumulation of the electrode without any chemical reactions or dissolution, the calculated MPE value is the average molecular weight of the formed surface species divided by the number of electrons transferred per surface molecule. Thus, we can specify the electrochemical reactions taking place at a specific electrode potential by using EQCM measurement in combination with CV. Figures 4 and 5 present the cyclic voltammogram with simultaneous measurement of mass accumulation to silicon deposited on nickel/quartz electrode in 1.3 M
  -EC/DEC (3:7, by vol ratio) and the plot of the MPE value calculated from the mass accumulation as a function of applied potential during the first cathodic scan in CV, respectively. The onset of reduction processes appeared at about
  . The reduction current went through a peak value at about
  and then slightly decreased until the electrode potential reached
  . Substantial reduction currents appeared below
  , including a sharp current peak at about
  . During the reverse scan of the electrode potential, a broad current peak appeared around
  . The mass accumulation to silicon-deposited EQCM electrode commenced at
  and lasted up to
  on the reverse scan of the electrode potential. The value of the mass accumulation did not go back to zero even above
  and showed a large irreversible mass accumulation after the completion of cycling. The potential dependence of the MPE value showed three distinctive regions: average MPE values of
  between 1.2 and
  ,
,  from 1.2 to
  , and
, and  from 0.4 to
  .
.
The reduction processes occurring above  during cathodic scan in CV were considered to be the electrolyte reductions. Particularly, when the lithium salt is
  , the salt anion derivatives such as
  or
or  have been reported15 to be reduced at much higher potentials as compared with solvent reduction to the LiF,
  , and
, and  species according to Eq. 3, 4, 5


The theoretical MPE values of Reactions 3, 4, 5 are 58.9, 69.9, and 101.9 g/mol, respectively. Because the above reactions occur simultaneously, the corresponding MPE value for the collective salt anion reductions would be the average of each MPE value, 71.9 g/mol. Even though the MPE value showed as much as about 100 g/mol at around  , the averaged value of about 70 g/mol between 1.7 and
  is similar to the theoretical one for the salt anion reductions. So, the reduction processes occurring at high electrode potentials ranging from 1.7 to
  are supposed to be the various types of reduction processes involving salt anion.
Solvent molecules such as EC and propylene carbonate are known to reduce on the carbonaceous electrode below  .16 However, the MPE value of about 25 g/mol for the silicon electrode in the potential range from 1.0 to
  was much lower than what would be expected for the solvent reductions of an alkyl carbonate electrolyte system, 88 g/mol. The low MPE values for the solvent reductions would mean the inefficient buildup of solvent reduction products on the electrode. One of the possible reasons for the inefficiency is the conversion of the surface species to other materials with low molecular weight. A substantial amount of alkyl carbonate lithium, which is the main product of the solvent reduction, can react with the impurities on a ppm level concentration, such as water and HF existing even in a high-purity
  -containing electrolyte, and dissolve into the bulk solution according to the following reactions15, 17


Although the buildup efficiency of solvent reduction products is much lower than the theoretical value, the gradual decrease in reduction current after the sharp current peak at  implies the passivation of the silicon electrode by sedimentation of reduction products of the salt anion and the solvent molecule. Abrupt increase in reduction current below
  is attributable to the incorporation of lithium ion into silicon electrode. The MPE values showed about 7 g/mol between 0.3 and
  and about 5 g/mol below
  .
.
Let us discuss the relationship of changes in thickness with the corresponding mass variations of the silicon-deposited EQCM electrode during the lithium charging procedure. The change in thickness accompanied by lithium deposition on the silicon electrode is different from that by lithium absorption into the electrode. In the derivation of the Sauerbrey's equation, the frequency change of the electrode is converted into the mass change through the change in thickness of an EQCM electrode with an appropriate assumption. In a different way of lithium deposition on the electrode, the increment of electrode thickness during lithium absorption into silicon is lower than that during the lithium deposition on the electrode. Therefore, it is reasonable to suppose that the MPE value for the lithium absorption into the silicon electrode is smaller than that for the lithium deposition on the electrode. In this respect, the limited increase in electrode thickness during lithium ion absorption into the silicon electrode could explain the lower MPE value of 5 g/mol rather than 7 g/mol for lithium deposition.
The MPE value of about 7 g/mol between 0.3 and  is indicative of another reaction involving lithium. This reaction seems to be in connection with the sharp reduction current peak at around
  in the cyclic voltammogram during the forward scan of the electrode potential. The absence of the corresponding oxidation current peak during the reverse scan indicates that this reaction is thermodynamically irreversible. The main chemical species on the silicon electrode was ascertained to be the
  and SiOH by using AES and FTIR. Hence, it is postulated that the native oxide on the silicon thin film is reduced to form a lithium oxide, according to Eq. 8

The characteristics of  formation have been reported to be an appearance of the "potential overshoot" in a galvanostatic charging curve.18 Netz et al. insisted that the potential overshoot is the characteristic of reactions in which the nucleation of a new phase is required. Thus, the activation energy for nucleation of
  is responsible for the "potential overshoot" in the charging curve. In order to confirm the formation of
  , the charge and discharge curves were obtained with the silicon-deposited EQCM electrode. Figure 6 shows the galvanostatic charge and discharge curves of the silicon electrode in 1.3 M
  -EC/DEC (3:7) with a current density of
  , corresponding to 1 C rate, for 10 cycles.
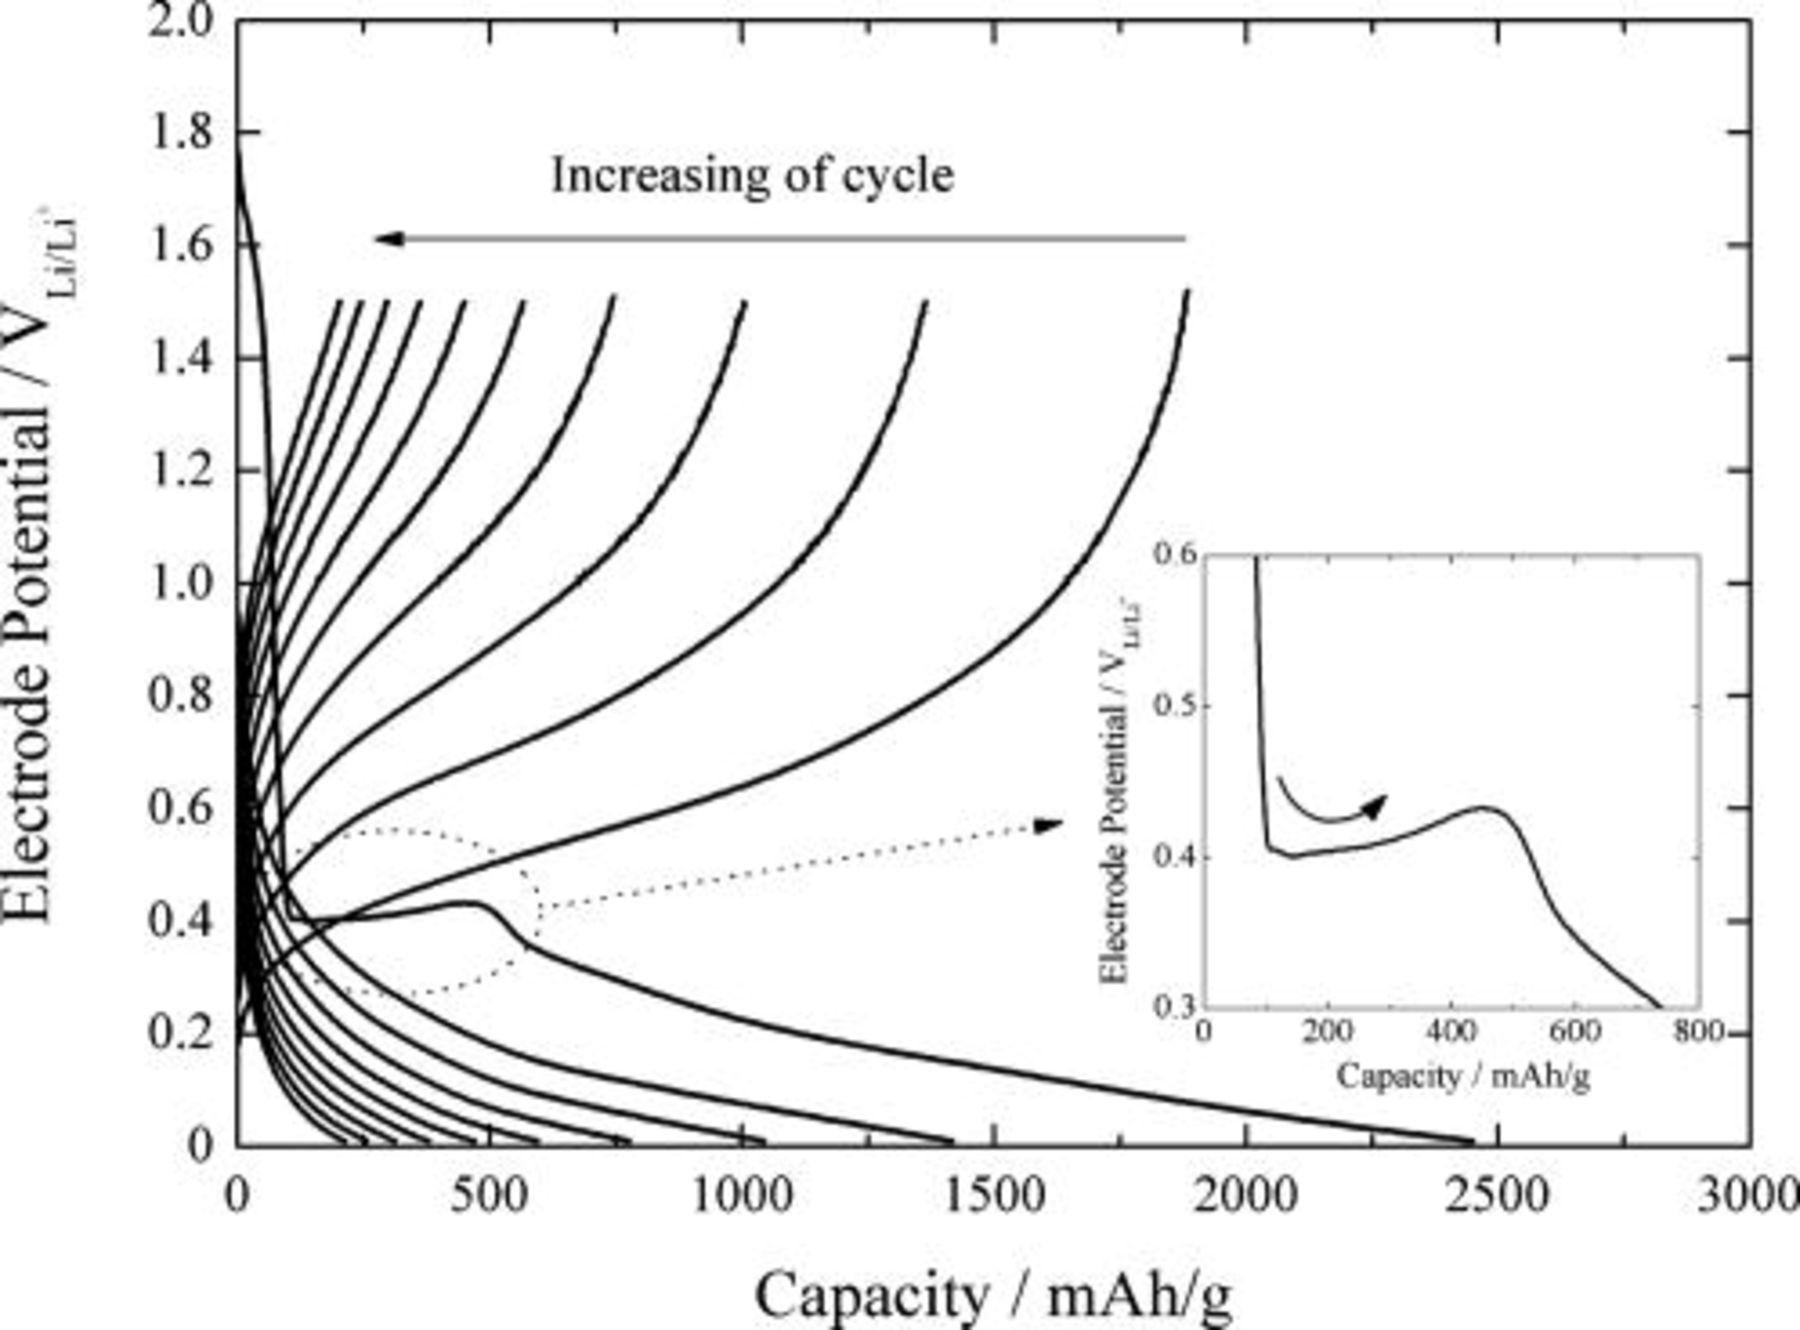
Figure 6. Galvanostatic lithium cycling curves obtained from the silicon-deposited EQCM electrode in 1.3 M  -EC/DEC (3:7, by vol ratio) with a current density of
  . The cutoff potential was
  for lithium charge and
  for lithium discharge.
A short potential plateau during the first cycling appeared at around  which is attributable to the electrolyte reduction. The potential overshoot was clearly observed at around
  , manifesting the nucleation of
  according to Eq. 8. After the potential overshoot, absorption of lithium ion into silicon proceeded. The disappearance of the potential overshoot at the second cycle implies that the transformation of
  to
to  and Si is completed during the first cycle.
Lithium charge capacity and the subsequent discharge capacity of lithium during the first cycle were 2447 and 1881 mAh/g, respectively, giving rise to an irreversible capacity of 566 mAh/g and a coulombic efficiency of 76.8%. The capacity losses arising from the electrolyte reduction and the formation of  were observed to be about 550 mAh/g, which is close to the value of the irreversible discharge capacity. Therefore, the electrolyte reduction and the formation of
  were considered to be main causes for the irreversible capacity of the silicon electrode at the first cycling of lithium.
However, the charging of lithium finished before the formation of the intermetallic phase of  , which is reported to show the potential plateau in the lithium charge curve at about 70 mV.1 In addition, the overpotential for lithium charge and discharge dramatically increased with the number of cycles, resulting in a drastic deterioration of cyclability. Accordingly, it is suspected that there exist some processes which make lithium absorption into or desorption from the silicon electrode unfavorable. One of the possible speculations on the cause of the low discharge capacity and poor cyclability is the kinetic hindrance to lithium charge and discharge arising from the buildup of highly resistive species on the silicon electrode. LiF formed on the silicon electrode by vigorous reduction of salt anion possibly acts as a barrier for transport of lithium ion through the interfacial region between the electrode and the electrolyte. These speculations are supported by a previous work13 in which the formation of interfacial layers on the anode was markedly facilitated under the condition of a flooded cell design.
Effects of electrolyte additives containing alkoxy silane functional groups
It has been well known in the field of sol-gel science12 that alkoxy-silane functional groups readily react with hydroxyl groups on silicon surfaces to form a Si–O–Si bond as presented in Eq. 9

In the present work, silane compounds having a different number of methoxy groups were chosen to modify the surface chemistry of the silicon electrode.
Figures 7a, 7b and 7c present the cyclic voltammograms along with mass accumulation of the silicon thin film deposited on nickel/quartz electrode in 1.3 M  in EC/DEC (3:7, by vol ratio) containing 5 wt % monomethoxy trimethyl silane, dimethoxy dimethyl silane, and trimethoxy methyl silane, respectively. The shape of the cyclic voltammograms obtained in the presence of the additives is analogous to that obtained in the absence of additives. The current densities flowing are
  for electrolyte reductions and
  for lithium absorption, common to all kinds of additives. The introduction of the additives is effective judging from the observation that the current density for electrolyte reduction is reduced by a factor of 3 and that for lithium absorption is doubled, associating with the sharper current peak during desorption of lithium. The effects of the additives on the buildup of electrolyte reduction products on the silicon electrode are shown more evidently in the mass accumulation data as compared with the CV data. As the number of alkoxy group increased, the mass accumulation between 0.4 and
  was significantly lowered.
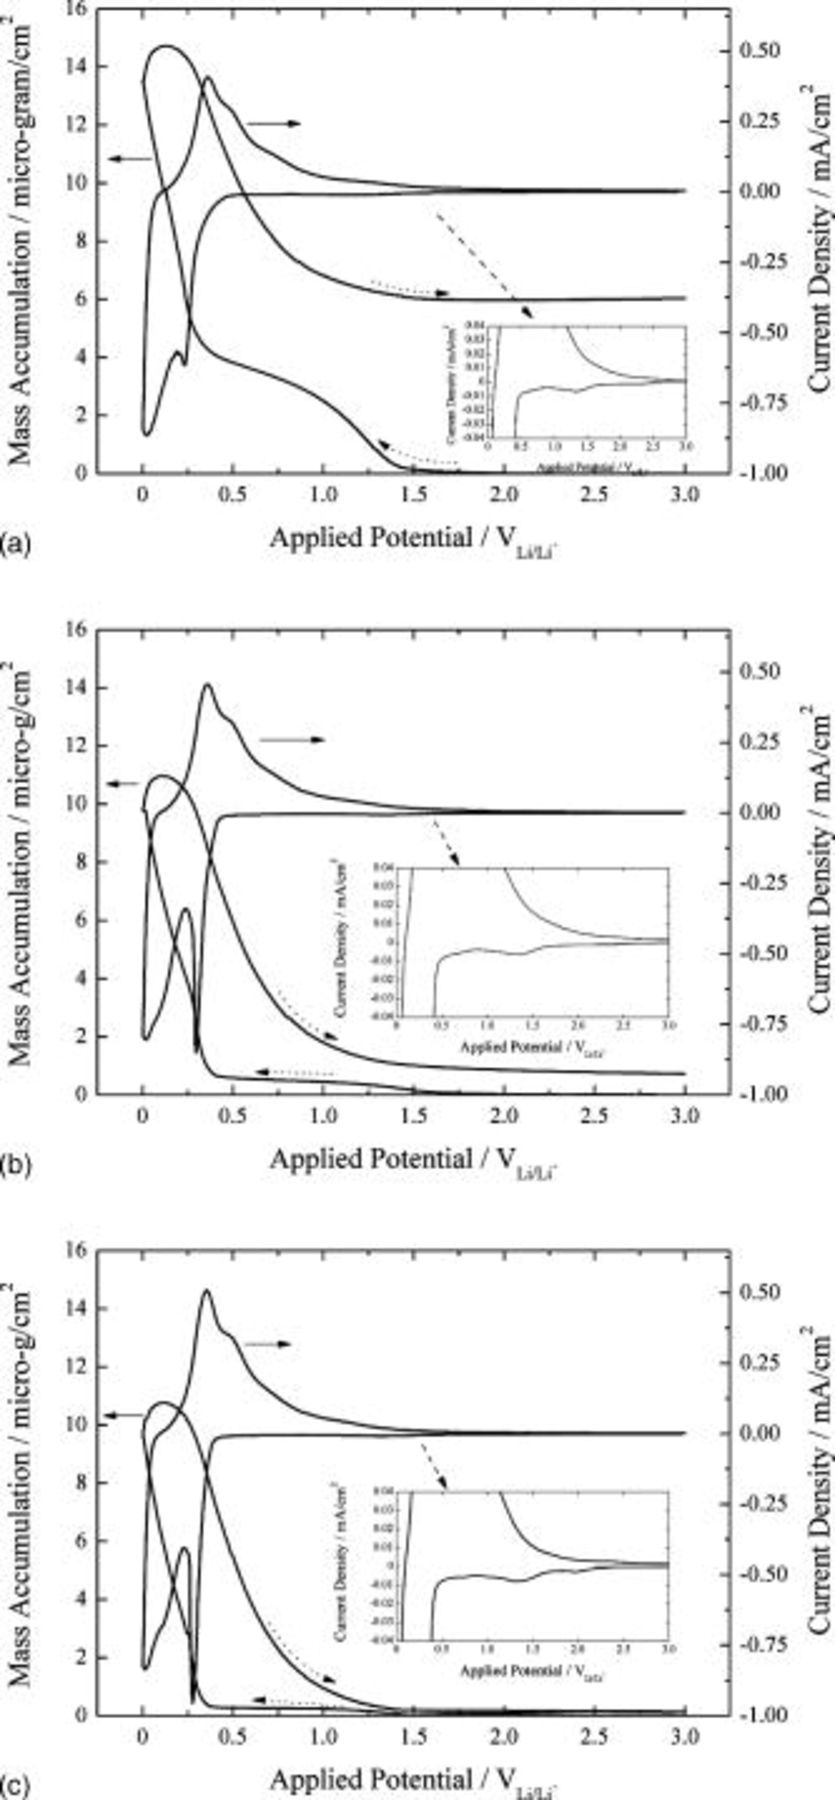
Figure 7. Cyclic voltammograms with simultaneous measurement of mass accumulation of silicon deposited on nickel/quartz electrode in 1.3 M  -EC/DEC (3:7, by vol ratio) containing (a) 5 wt % monomethoxy trimethyl silane, (b) 5 wt % dimethoxy dimethyl silane, and (c) 5 wt % trimethoxy methyl silane.
The reduced electrolyte reduction current, associating with negligible mass accumulation in the presence of the additives, clearly indicates that the additives adsorbed on the silicon electrode prevent the electrolyte species from being reduced on the electrode. Besides, judging from the diminished mass accumulation and the decreased electrolyte reduction current with increasing number of alkoxy functional groups of the additives, it is strongly suggested that the electrode passivation is made by reaction of the alkoxy functional group with surface species of the silicon electrode.
Figures 8a, 8b and 8c present the galvanostatic charge and discharge curves of the silicon-deposited EQCM electrode for 10 cycles in 1.3 M  -EC/DEC (3:7, by vol %) containing the additives of 5% monomethoxy trimethyl silane, 5% dimethoxy dimethyl silane, and 5% trimethoxy methyl silane, respectively. The voltage profile of the charge and discharge curves at the first cycle in the presence of the additives is similar to that in the absence of the additives, showing a negative potential overshoot for
  formation followed by electrode potential decay for lithium absorption. However, the presence of the additives in the electrolyte brings about excellent cyclability as well as a much higher discharge capacity of more than 2500 mAh/g as compared with that in the absence of the additives.
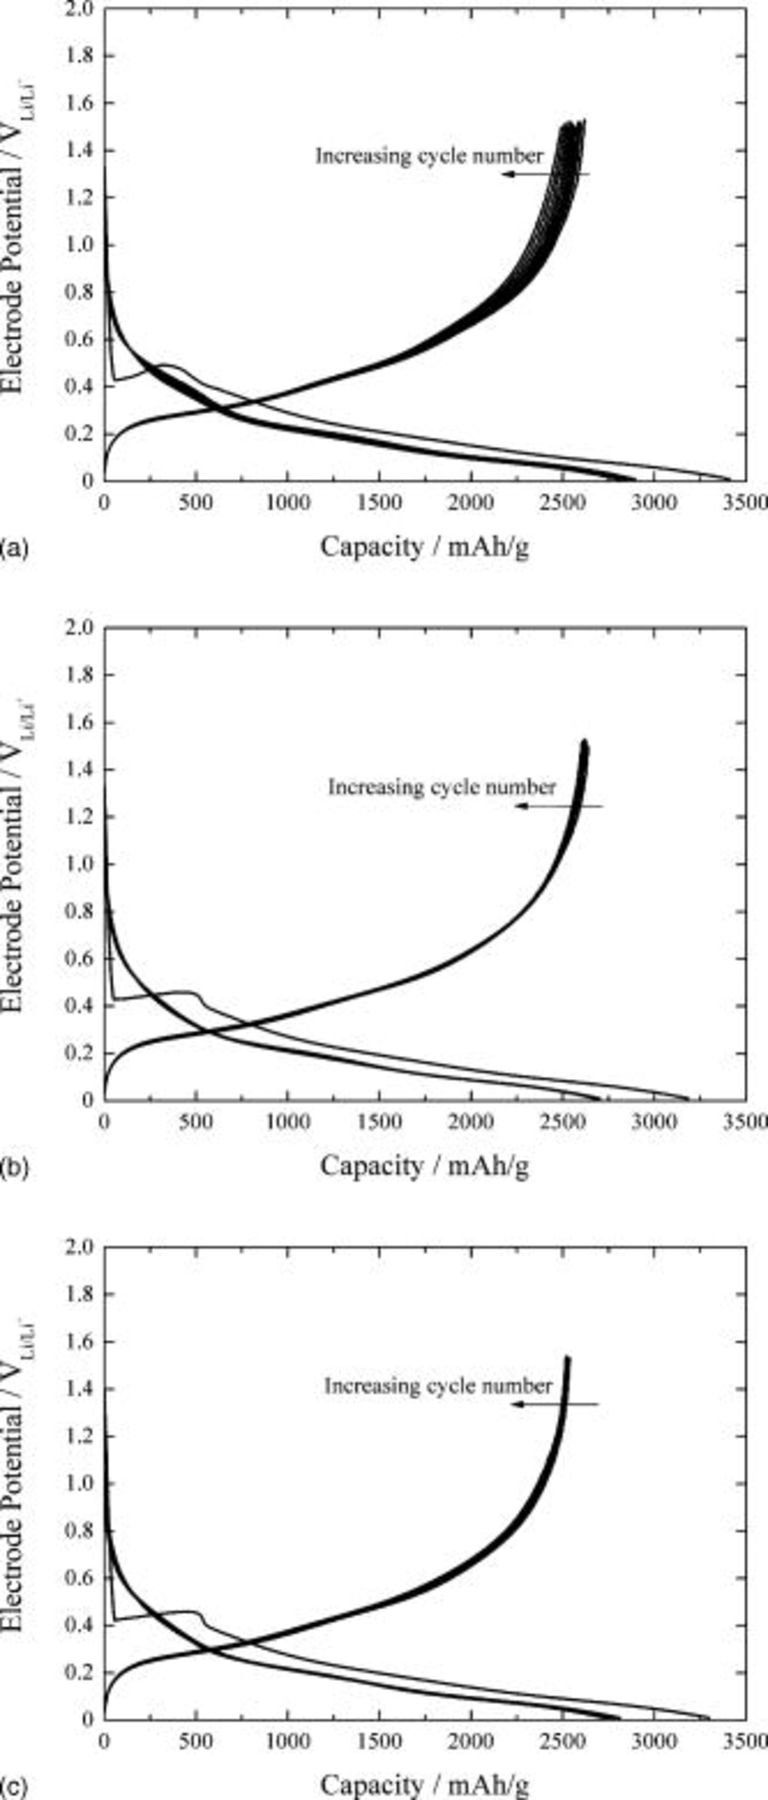
Figure 8. Galvanostatic charge and discharge curves obtained from silicon-deposited EQCM electrode for 10 cycles in 1.3 M  -EC/DEC (3:7, by vol ratio) containing (a) 5 wt % monomethoxy trimethyl silane, (b) 5 wt % dimethoxy dimethyl silane, and (c) 5 wt % trimethoxy methyl silane.
Now, let us recall the very large overpotential in charge and discharge curves in the absence of the additives. In contrast, the addition of compounds containing alkoxy silane functional groups considerably reduced the overpotential during lithium charge and discharge. Moreover, the voltage profile of the silicon electrode in the presence of the additives remained nearly unchanged after prolonged cycling of lithium. In summary, introduction of the additives is found to enhance the kinetics of the electrochemical processes, leading to the reduced overpotential in charge and discharge curves without incurring substantial adverse side effects.
In order to clarify the effect of the additives on the transport kinetics of lithium ion through the interface layer between the silicon electrode and  salt solution, ac impedance spectroscopy was conducted to assess the interfacial resistance between the silicon electrode and the electrolyte. Figure 9 demonstrates the Nyquist plots of the silicon electrode obtained at OCP after 10 cycles in 1.3 M
  –EC/DEC (3:7, by vol %) in the presence and absence of the additives.

Figure 9. Nyquist plots obtained from silicon-deposited EQCM electrode after 10 cycles of lithium charge and discharge in 1.3 M  -EC/DEC (3:7, by vol ratio) containing
  5 wt % monomethoxy trimethyl silane,
  5 wt % dimethoxy dimethyl silane,
  5 wt % trimethoxy methyl silane, and
  without additives.
The impedance spectra consist of a capacitive arc and a straight line, which is in good agreement with other ac impedance spectra obtained from the active electrode in lithium salt solution.19, 20 The former appearing in the high-frequency range is responsible for the transport of lithium ion through the surface film formed on the silicon electrode, and the latter in the low-frequency range is due to the charge-transfer reaction.
A very large capacitive arc appeared in the absence of the additives, indicating that highly resistive layers were formed on the electrode. This result has a bearing on the very large overpotential during the charge and discharge experiment in the absence of the additives. Thus, the substantial buildup of reduction products of salt anion on the electrode gives rise to difficulties in transporting lithium ion through the surface film formed on the silicon electrode, resulting in limited discharge capacity and cyclability.
Meanwhile, the arc size is dramatically reduced in the presence of the additives and tends to decrease with the number of alkoxy silane functional groups in the additive. Considering the chemical reaction of alkoxy groups in silane compounds with the silanol on the silicon electrode, an abundance of alkoxy functional groups in the additive, which facilitates the adsorption of the additive on the silicon surface, is expected to suppress the electrolyte decomposition and the consequent buildup of the electrolyte reduction products on the electrode.
Conclusion
The characterization of interfacial reactions occurring on the silicon thin-film electrode was investigated by using EQCM measurement in combination with various electrochemical techniques. Additionally, the compounds containing alkoxy silane functional groups were evaluated as a passivation agent for lithium rechargeable batteries utilizing silicon anode. From the experimental results, conclusions were drawn as follows:
1. From the results of CV and galvanostatic charge/discharge experimentation with simultaneous measurement of mass accumulation of the silicon electrode in 1.3 M  -EC/DEC (3:7, by vol %), it was found that the irreversible capacity of the silicon electrode during the first cycle is due to the reduction of electrolyte and the formation of
  .
.
2. From the results of ac impedance spectroscopy in combination with various electrochemical techniques, it was suggested that the substantial buildup of reduction products of salt anion on the electrode gives rise to difficulties in transporting lithium ion through the surface film formed on the silicon electrode, resulting in reduced discharge capacity and aggravated cyclability.
3. From the results that both mass accumulation and electrolyte reduction current were suppressed in the presence of the additives containing alkoxy functional groups, the effectiveness of compounds containing the alkoxy silane functional group as a passivation agent for silicon anode was confirmed.
Samsung Advanced Institute of Technology assisted in meeting the publication costs of this article.