Abstract
Because structural change in lithium cobalt oxide  cathode is primarily responsible for the performance degradation of lithium-ion cells in simulated satellite operation, it is important to investigate the operating-condition effect on cell-volume change. In this work, we used in situ strain-gauge measurement to probe the total volume change during charging and discharging of five 50 Ah-class lithium-ion cells with graphite anodes and
  cathodes. Some interesting phenomena concerning the correlation of the taper voltage with the strain change at the end of the charge were found in the strain trend curve. To explain these phenomena, we examined the strain change of a commercial 0.65 Ah-class lithium-ion polymer cell with the same electrodes as a function of taper voltage by using in situ load-cell measurement and were able to deduce that the cell-volume change during charging correlated to the structure transition of the
  cathode from the initial hexagonal phase (H1) to a new hexagonal phase (H2) at a taper voltage near
  . We conclude that the taper voltage should be maintained below
  to maximize the cycle life of lithium-ion cells with graphite anodes and
  cathodes during practical satellite operation.
Export citation and abstract BibTeX RIS
In a spacecraft, the battery system is one of the most massive onboard components.1, 2 Improvement in the energy density of the onboard battery system can help realize a lightweight power storage device, and hence contribute to lower launch costs and enable missions that have critical weight and/or volume margins. The specific advantages of lithium-ion technology offer the possibility of huge reductions in battery mass. It has been reported that over 20 spacecraft with onboard lithium-ion batteries have been launched in recent years.3–9 These spacecraft, including satellites, Mars rovers, and space vehicles, demonstrate the normal operation of onboard lithium-ion batteries in a space environment.
A lithium-ion battery in a spacecraft generally consists of many lithium-ion cells connected in series and parallel to meet the power requirements of the bus and the mission. These cells cycle under various operating conditions and environments, such as ultrahigh vacuum states, radiation, long cycle-life requirements, and short charge and discharge intervals limited strictly by the spacecraft orbit.10 Typically, a spacecraft in low Earth orbit (LEO, within  of the Earth) periodically experiences about
  of sunshine and
  of eclipse. This requires that the onboard rechargeable cells store power derived from solar cells over short intervals of
  , and that they generate enough power to meet the electrical demands of the bus and the mission at a very short interval of
  . Additionally, the onboard rechargeable cells must operate without interruption for more than
  to meet the general LEO mission life requirement of
  . To facilitate the application of lithium-ion cells in a spacecraft, these cells must be cycled under moderate conditions, such as with a low taper voltage of less than
  and a constant ambient temperature near room temperature.11, 12 These special operating conditions make the onboard lithium-ion cells behave differently than those made for commercial purposes.
In our previous work, we found that serious structural changes in lithium cobalt oxide  cathodes, rather than the surface characteristics of the graphite anodes, were primarily responsible for the performance degradation of aged lithium-ion cells during long-term cycle-life testing.13, 14 This differs from the generally accepted knowledge that the surface film on the graphite anode plays an important role in the charge-discharge behavior of a lithium-ion cell for ground applications. We detected a new component with a large lattice constant on the c axis in the X-ray diffraction (XRD) spectra of an aged
  cathode. We attribute this phenomenon to the fact that some of the lithium ions became "reserved" in the graphite anode with cycling and could no longer reversibly take part in the charge-discharge process. Consequently, a lithium-ion deficiency occurred in the
  structure, resulting in a lattice-constant increase in the c-axis direction. Although the graphite anode experienced a larger volume change than that of
  cathode, the graphite structure was stable with cycling and exhibited relatively small effect on cell performance degradation. In a practical prolonged LEO simulation of the operation of large-capacity lithium-ion cells, we indeed detected a cell-volume change at the end of charge and discharge with cycling.15 Because this volume increase correlates well with the decline of cell performance, it appears rewarding to investigate the volume change during charging and discharging to understand the cycling behavior of lithium-ion cells for space applications.
There have been a few reported investigations of electrode-volume change in lithium-ion cells. The Kim group probed the doping effect on the onset of Jahn-Teller distortion in  cathodes, using an in situ bending beam method.16 Winter et al. used an in situ electrochemical dilatometry technique to record the expansion and contraction of graphite samples during charge/discharge in Li ion-containing organic electrolytes.17 Dilatometry was also used by the Ohzuku group to measure the anomalous expansion of graphite-negative electrodes upon first charge.18 The common point of these reports is the limiting of the volume-change investigation to a single electrode. Because the cell-volume change is a result of volume change in both the cathode and anode, it is more important to evaluate the cell behavior. This viewpoint encouraged us to investigate the cell-volume change in a commercial lithium-ion polymer cell during charging and discharging by using two in situ methods, load-cell measurement and X-ray observation, in a previous work.19 We observed an excess cell-volume change that was delayed with respect to the change induced by the state of charge (SOC) at high charge and discharge rates. We attribute this phenomenon to the slow diffusion of lithium ions in the active materials of the electrode and to slow structural change in the outer region of the electrode particles. For convenience, we use the outer region to represent the area near the electrode/electrolyte interphase in the electrode particles here.
In this work, we used an in situ strain-gauge measurement to probe the total volume change of five 50 Ah-class lithium-ion cells during charging and discharging. These cells, consisting of graphite anodes and  cathodes, were cycled in a simulated LEO spacecraft operation with a depth of discharge (DOD) of 40% as a function of taper voltage and charge rate. We demonstrated the correlation of the volume change and performance fading of these cells. Furthermore, to understand the above experimental results, we investigated the volume change of a commercial 0.65 Ah-class lithium-ion polymer cell using in situ load-cell measurements. These commercial lithium-ion polymer cells use gel electrolytes, graphite anodes, and
  cathodes. We used a lithium-ion polymer cell because this type of cell utilizes an aluminum laminate film package, which exactly reflects the volume change of the electrode's active materials. Because the cell-volume change is mainly due to lithium-ion diffusion in active materials of the electrode, the experiment results obtained from lithium-ion polymer cells is significant in understanding cell-volume change in common lithium-ion cells as satellite power sources.19
Experimental
Samples of lithium-ion cells
Table I lists typical specifications for the two types of lithium-ion cells evaluated in this work.
Table I. Lithium-ion cells evaluated in this work.
| Cell type | Nominal | Dimensions (mm) | Note | |||
|---|---|---|---|---|---|---|
| Capacity (Ah) | Voltage (V) | Width | Thickness | Length | ||
| Lithium- ion | 50 | 3.7 | 123 | 50 | 130 | Space applications |
| Lithium- ion polymer | 0.65 | 3.7 | 40.6 | 3.8 | 53.8 | Commercial |
The 50 Ah-class lithium-ion cells have an elliptic cylindrical shape and were developed specifically for space applications by GS Yuasa Technology Ltd. (GYT, formerly Japan Storage Battery Co., Ltd.). Graphite anodes and  cathodes are used in these cells, along with a lithium salt dissolved in an alkyl carbonate mixed solvent. The cell element is tightly enclosed in an aluminum-alloy container with rupture plates. The positive and negative terminals are hermetically sealed with a metal-brazed ceramic seal.4
The commercial lithium-ion polymer cell (nominal capacity 0.65 Ah) was manufactured by a Japanese company for cellular phone use and consists mainly of a graphite anode, a  cathode, a gel electrolyte supported by a polymer material, and an aluminum-laminate film package.11 Before being used in this work, the cell experienced a receiving examination for capacity verification over fourteen cycles, as a function of taper voltage and discharge rate.
In situ strain-gauge measurement
Five 50 Ah-class lithium-ion cells were connected in series and stacked between two metallic end plates with four tie rods (Fig. 1). A strain sensor was attached to a tie rod to record in situ the strain change of the cell stack during charging and discharging, using an instrumentation amplifier (Kyowa Denko, WGA-710B). Because the cells were tightly fixed between the end plates with an initial strain value of  , the strain change of the cell stack reflected the cell-volume change. An increase (decrease) in strain indicates an expansion (contraction) of the five lithium-ion cells.
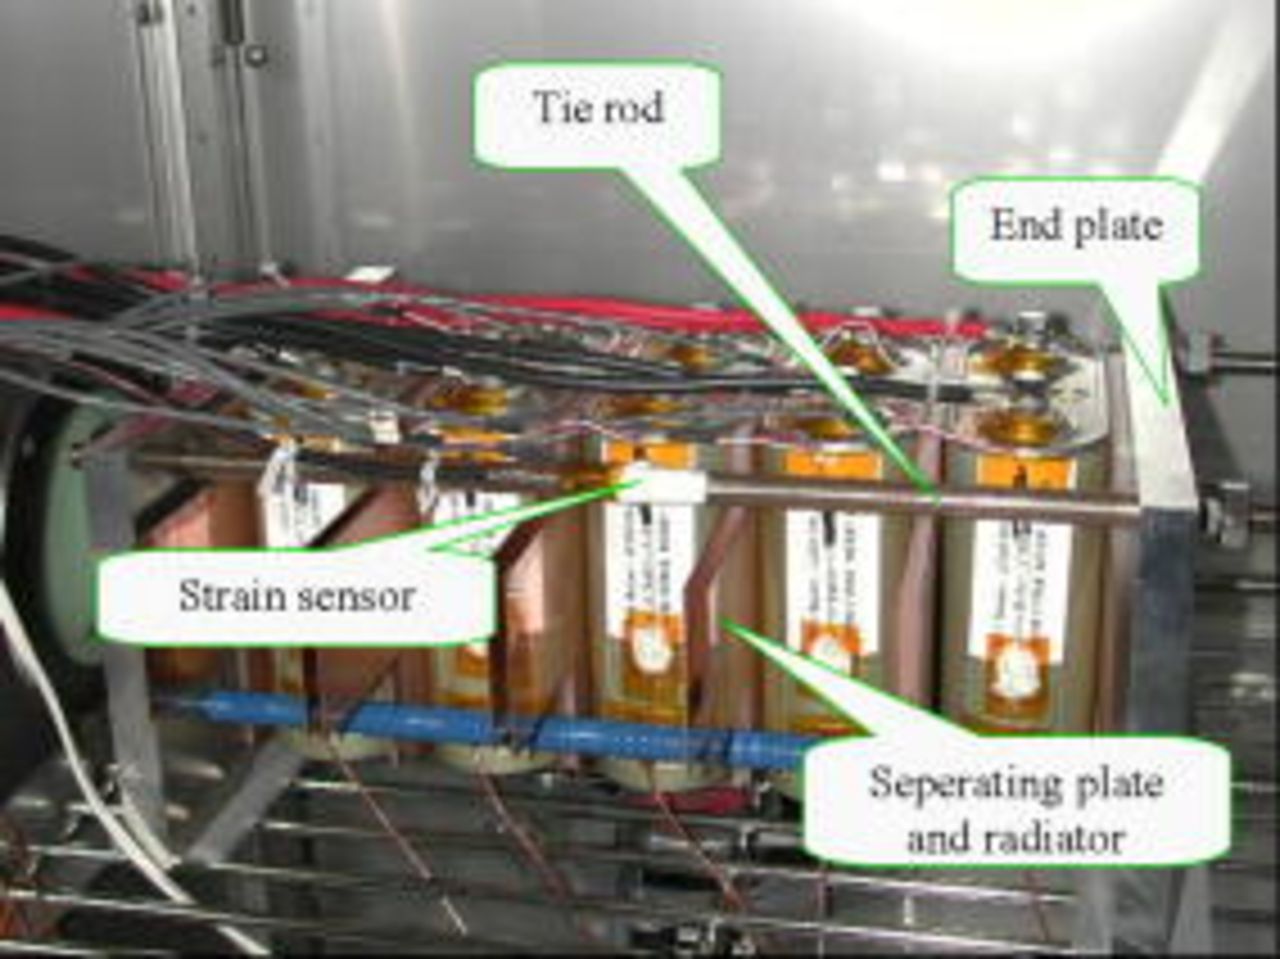
Figure 1. (Color online) Photograph of five in-series 50 Ah-class lithium-ion cells developed for space applications in a simulated LEO operation.
During the testing, the cell stack was set in a thermostatic incubator (Espec Engineering, PU-2K) at  . We performed the charging and discharging of the 50 Ah-class lithium-ion cells with a charge-discharge battery tester (Advanced Engineering Services, 2789-C933). Based on the common current-setup method used for lithium-ion cells in simulated satellite operation, the charge (discharge) current was calculated by using the nominal capacity of 50 Ah.
The 50 Ah-class lithium-ion cells were tested by simulating a spacecraft in LEO operation with a DOD of 40% under regimens of constant current-constant voltage (CC-CV) charge and constant current (CC) discharge, as summarized in Table II. During cycling, we changed the taper voltage from  and the charge current from
  to optimize the operating conditions. In every charge-discharge cycle, the cells were charged with a charge time of
  at the designated taper voltage and charge rate, and discharged with a discharge time of
  and a discharge rate of
  . At every operation condition, the cells were first precharged with the designated taper voltage for a total charge time of
  at a charge rate of
  , before the cycle-life testing.
Table II. Testing condition for cycle-life testing of 50 Ah lithium-ion cells in a simulated LEO operation.
| Simulation mode | LEO | |
| Ambient temperature, °C | 15 | |
| Charge | Rate, C | 0.5 |
| CC-CV regimen | Taper voltage, V | 3.95-4.1 |
| Time, h | 1.0 | |
| Discharge | DOD, % | 40 |
| CC regimen | Rate, C | 0.8 |
| Time, h | 0.5 | |
In situ load-cell measurement
A schematic illustration of the load-cell system may be found in our previous paper. A lithium-ion polymer cell was set between the load cell and spacers and secured by screws. The two-side cell-volume change during charging and discharging was captured by the strain change of the load cell and monitored in situ by a strain amplifier (Kyowa, DPM-611A). The strain was recorded with a data acquisition/switch unit (Agilent, 34970A). An increase (decrease) in cell strain indicates expansion (contraction) of the lithium-ion polymer cell.
One lithium-ion polymer cell was used to evaluate the effect of taper voltage on cycling performance. Electrochemical tests were performed with a charge-discharge battery tester (Kikusui, PFX40W-08) in a thermostatic program incubator (Yamato, IN600) of  .
.
The cells were tested by simulating satellite LEO operation with a DOD of 40% under the profiles of CC-CV charge and CC discharge. Here, the DOD was defined by using the rated capacity measured at each taper voltage, which ensured the same DOD regardless of taper-voltage change. Although the charge (discharge) current changed at difference taper voltages, the cell was subjected to the same stress because the cell stress was affected predominately by DOD rather than charge (discharge) current). The cell was charged at a charge rate of  for a total charge time of
  with different taper voltages ranging from
  , with an interval of
  . The cell was discharged at a discharge rate of
  over a total discharge time of
  . The cell was cycled 10 times at each taper-voltage level. Before cycling at a given taper voltage, the cell was precharged with a taper time of
  and a charge rate of
  to place the cell in a known initial state. After ten cycles, the cell was discharged in CC mode at a rate of
  and a cutoff voltage of
  . The charge/discharge current was determined by using the capacity measured at each taper voltage as shown below.
The cells were charged in CC-CV mode at a rate of  with a taper voltage ranging from
  , with an interval of
  , and a taper time of
  . The cells were discharged in CC mode at a rate of
  and a cutoff voltage of
  . Here, we calculated the current by using the nominal capacity of each cell, which was generally determined by using a taper voltage of
  .
.
Results
In situ strain-gauge measurement
Generally, voltage at the end of the discharge is an important parameter in comparing the cycling performance of cells. A high voltage at the end of the discharge is needed to realize long-term satellite operation. As an example, Fig. 2 depicts typical charge and discharge curves for a 50 Ah-class lithium-ion cell with a taper voltage of  and a charge rate of
  , as a function of the number of cycles. Obviously, the strain change occurred along with changing and discharging. The voltage at the end of the discharge declined with cycling, indicating performance degradation of this cell. Furthermore, we found that this performance degradation correlated well with the strain change during charging and discharging. The cell-volume change may be explained by simultaneous volume expansion (contraction) of the graphite anode and
  cathode in the lithium-ion cell experiencing the charge (discharge) process, as described in our previous paper.19

Figure 2. Comparison of charge and discharge profiles of 50 Ah-class lithium-ion cells as a function of (a) cycle number and (b) SOC (DOD). The charge rate and taper voltage were  and
and  .
.
Figure 3 depicts the voltage trend at the end of the charge and discharge of five 50 Ah-class lithium-ion cells. The cycle-life testing was completed after  , corresponding to one year of LEO operation. We changed the taper voltage from
  and the charge current from
  during cycling. Overall, a high charge rate and taper voltage seem to be beneficial to maintain a high voltage at the end of the discharge. This tendency was more noticeable as the cell voltage became lower at the end of the discharge. Additionally, the voltage dispersion for these five cells was sufficiently small at the end of the charge and discharge. This is very important for these cells, as they will be connected in series to construct a battery, and the overall battery performance is determined by the cell with the poorest performance.
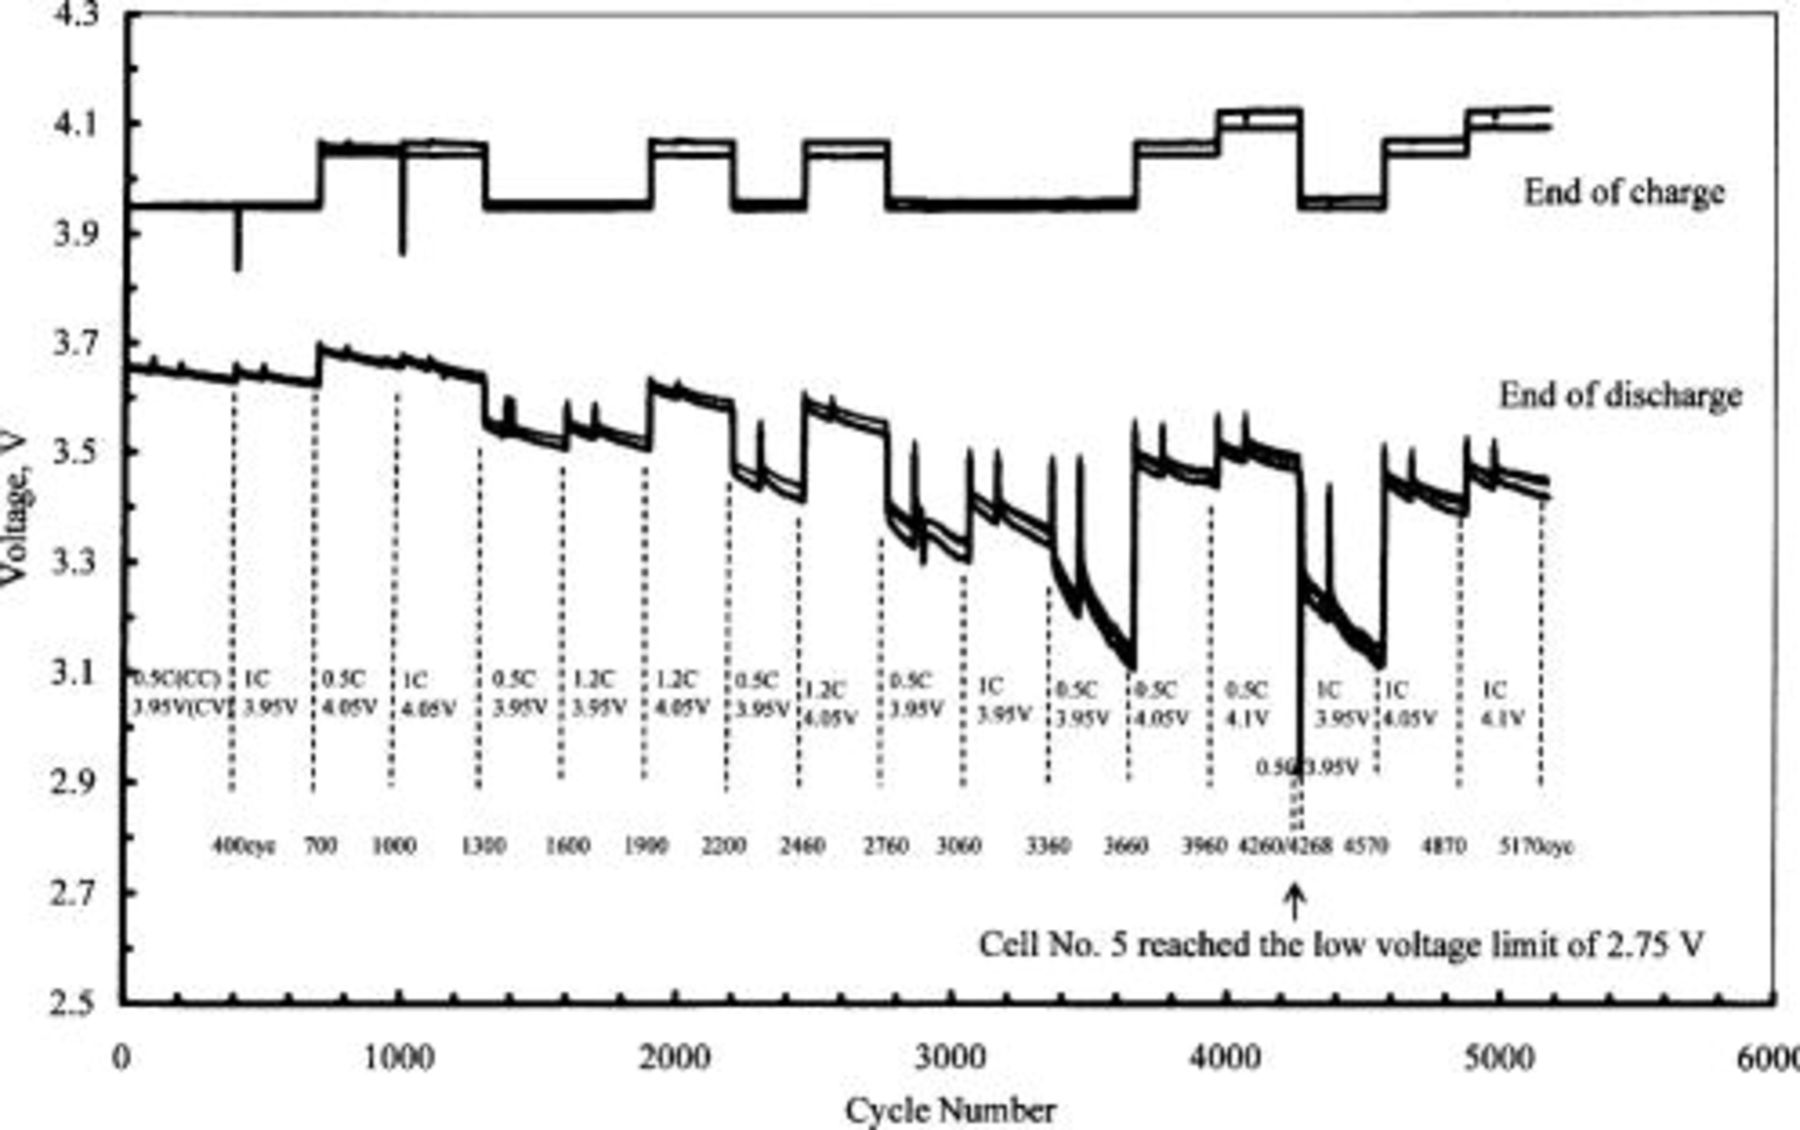
Figure 3. Cell-voltage trend at the end of charge and discharge of five 50 Ah-class lithium-ion cells. The charge rate and taper voltage were changed during cycling as indicated in the figure.
Figure 4 presents the strain trend for five 50 Ah-class lithium-ion cells at the end of charge and discharge. The main strain change occurred at the end of the charging period. Four interesting phenomena were observed at the end of the charging period. First, the strain increased with charge rate and taper voltage. Relatively, the taper voltage exhibited substantial effect on the strain increase. Second, the strain increase after raising the taper voltage from  was more than twice that observed after raising the taper voltage from
  , as seen in cycles 3660 and 3960. Third, the strain decreased with cycling at taper voltages of 4.05 and
  , in contrast to the increase in strain at the end of the charge when using a taper voltage of
  . This phenomenon became more noticeable with cycling. Fourth, when the taper voltage was changed from
  , the strain became smaller than the previous strain at
  , as seen in cycles 2760 and 2460. This was very different from the commonly accepted knowledge that strain monotonically increases during cycling with a constant taper voltage of
  .19
.19
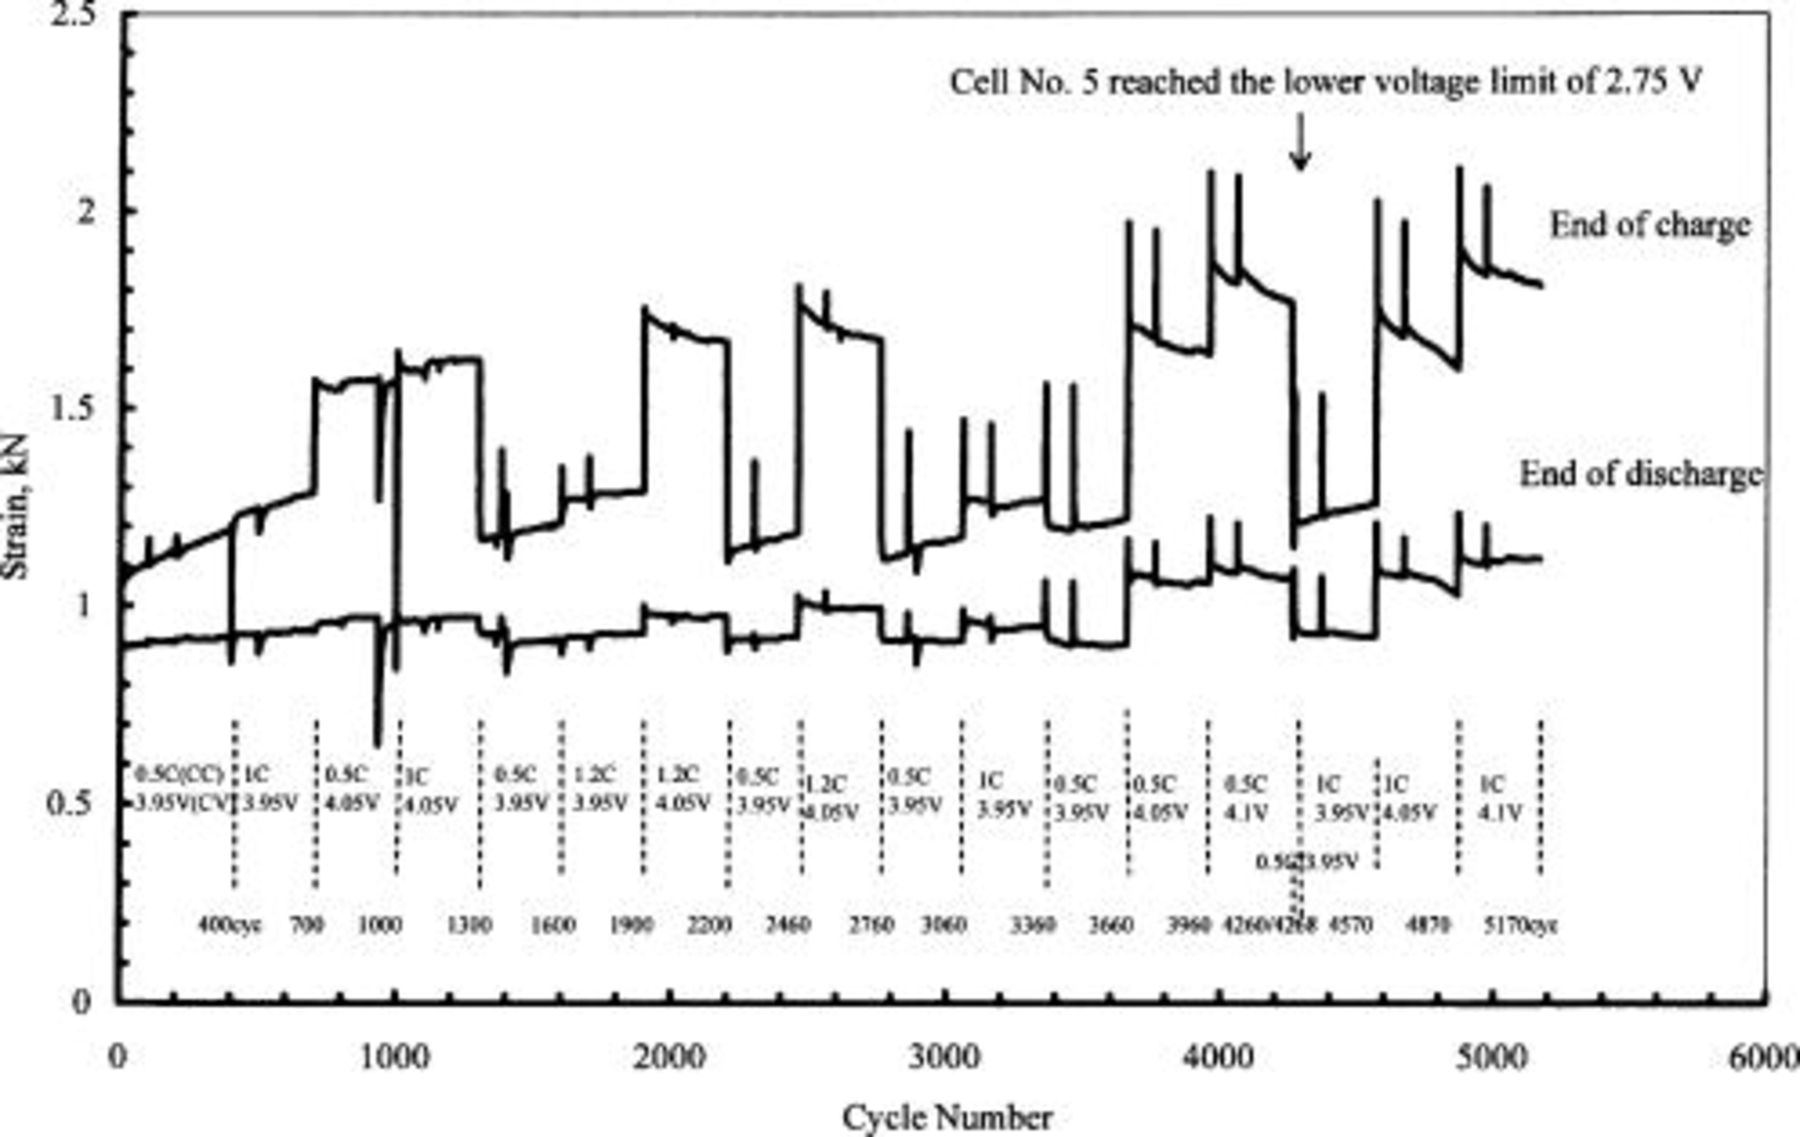
Figure 4. Strain trend at the end of charge and discharge of five 50 Ah-class lithium-ion cells. Charging conditions are also indicated in the figure.
In cycle-life testing, we periodically checked the cell capacity and conducted equipment maintenance. This caused the strain spikes as shown in Fig. 4. However, after we restarted the cycling, the strain returned to the original locus at the same testing condition, suggesting slight effect of testing interruption on string change.
We tested the cells at the same CC current, CV voltage, and total charge time at each condition pattern. However, the cell impedance increased due to performance degradation, and caused the cell capacity decrease and charge current slight increase at the end of charge (CV phase). This situation should be real for all condition patterns (taper voltage). In general, the strain decreases with cell capacity. However, we found that the strain change depended severely on the taper voltage. This suggests that the capacity fading with cycling had less effect than on strain change than taper voltage.
At a high taper voltage, the SOC of a lithium-ion cell increases due to an increasing capacity for lithium-ion intercalation (deintercalation) into a graphite anode (from a  cathode). This causes a volume increase in both the graphite anode and the
  cathode at the end of the charge, which is reflected in a strain increase as described for the first phenomenon. The strain increase at high rates has been explained in our previous paper by excess cell-volume change that is delayed with respect to the change induced by the SOC.19 We attribute this phenomenon to slow diffusion of lithium ions in the active materials of the electrode and slow structural change in the outer region of the electrode particles.
However, with available knowledge it is difficult to explain the taper-voltage effect on strain change, as described for the other phenomena. To explain the taper-voltage effect on the strain change, we investigated the cell-volume change of a lithium-ion polymer cell as a function of taper voltage. A small interval of  in taper voltage ensured we would capture this phenomenon precisely.
In situ load-cell measurements
We first verified the capacity to calculate the charge and discharge currents at different taper voltages. Strictly speaking, charge and discharge currents should be calculated by using the actual capacity at different taper voltages, rather than the nominal capacity. Nevertheless, because we used a low discharge rate of  and a long taper time of
  , the IR drop during the charge and discharge should be sufficiently small. Consequently, we may neglect the capacity measurement error originating from calculating the charge/discharge current by using the nominal capacity rather than the actual capacities with different taper voltages. Table III summarizes the capacities obtained here, which were used to calculate the charge and discharge currents in the following testing.
Table III. Cell capacity of a lithium-ion polymer cell as a function of taper voltage.
| Taper voltage, V | 4.20 | 4.15 | 4.10 | 4.05 | 4.00 | 3.95 | 3.90 |
| Capacity, Ah | 0.667 | 0.63 | 0.581 | 0.554 | 0.527 | 0.458 | 0.406 |
Figure 5a plots a total charge-discharge profile of a lithium-ion polymer cell. The taper voltage was varied from  . At each taper voltage, we subjected the cells to ten charge-discharge cycles. Before cycling at each taper voltage, the cell was precharged in order to place the cell in a known initial state. As examples, Fig. 5b and 5c show enlarged charge-discharge curves during cycling along with charge curves from the precharging phase with a taper voltage of
  .
.
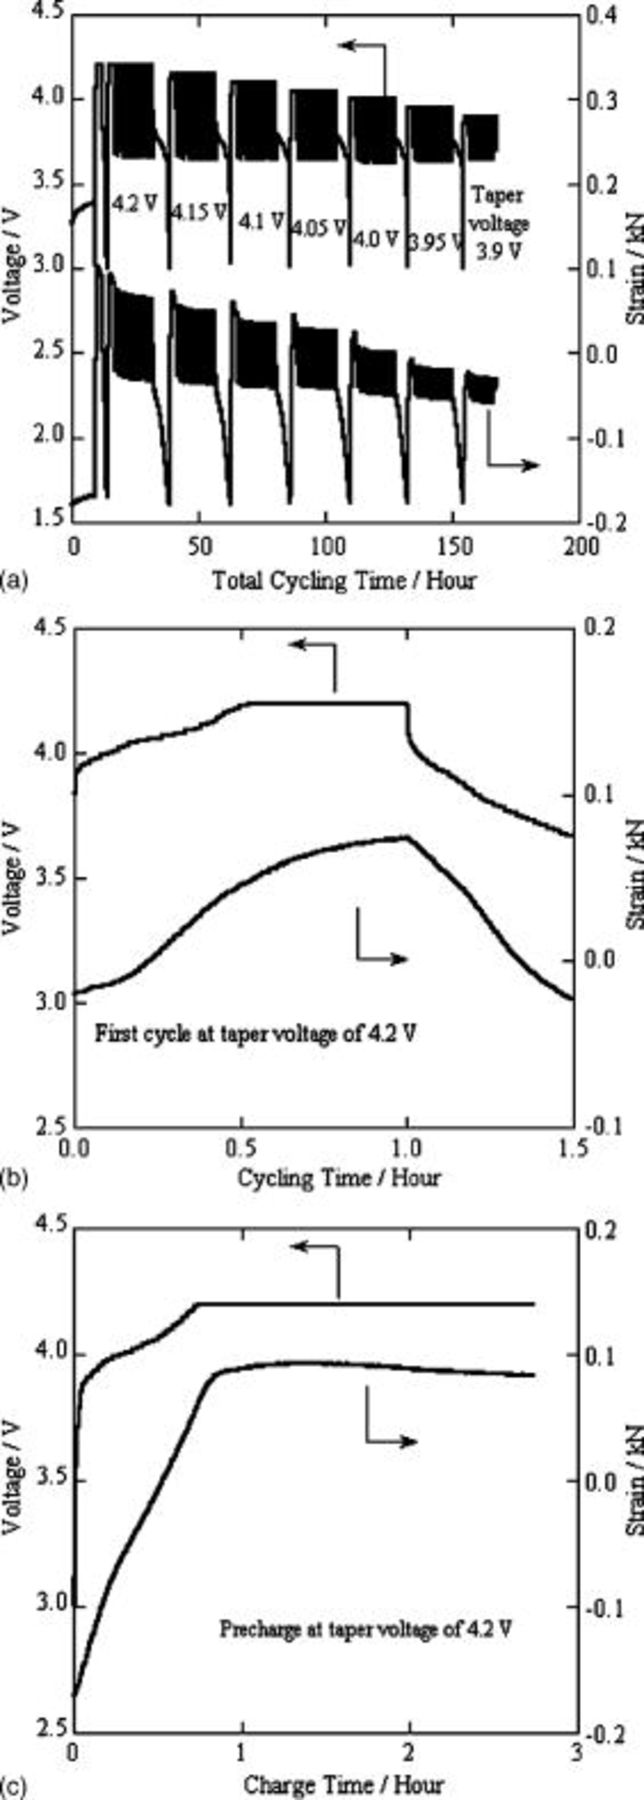
Figure 5. (a) Whole charge-discharge curves, (b) typical charge-discharge curves during cycling, and (c) typical precharge curves for the 0.65 Ah-class lithium-ion polymer cell used for load-cell measurement.
During cycling, the cell had maximum strain at the end of the charge and minimum strain at the end of the discharge (Fig. 5b). We determined the maximum and minimum strain for each cycle. These are summarized as a function of taper voltage in Fig. 6a. Obviously, the strain value became stable after a few cycles. The difference between the maximum and minimum strain values for the same cycle reflects the cell-volume change for this cycle, and is plotted as strain change in Fig. 6b. We found that the strain change depended on the taper voltage. When the taper voltage changed from  , or from
  , the cell-volume increase was obviously greater than that in the other cases. Because the charge-discharge cycle was set in a constant DOD of 40%, the charge capacity should be the same for each cycle, independent of the taper voltage, due to high coulombic efficiency (near 100%). This indicates that the use of a taper voltage near
  is an important factor in cell-volume change.
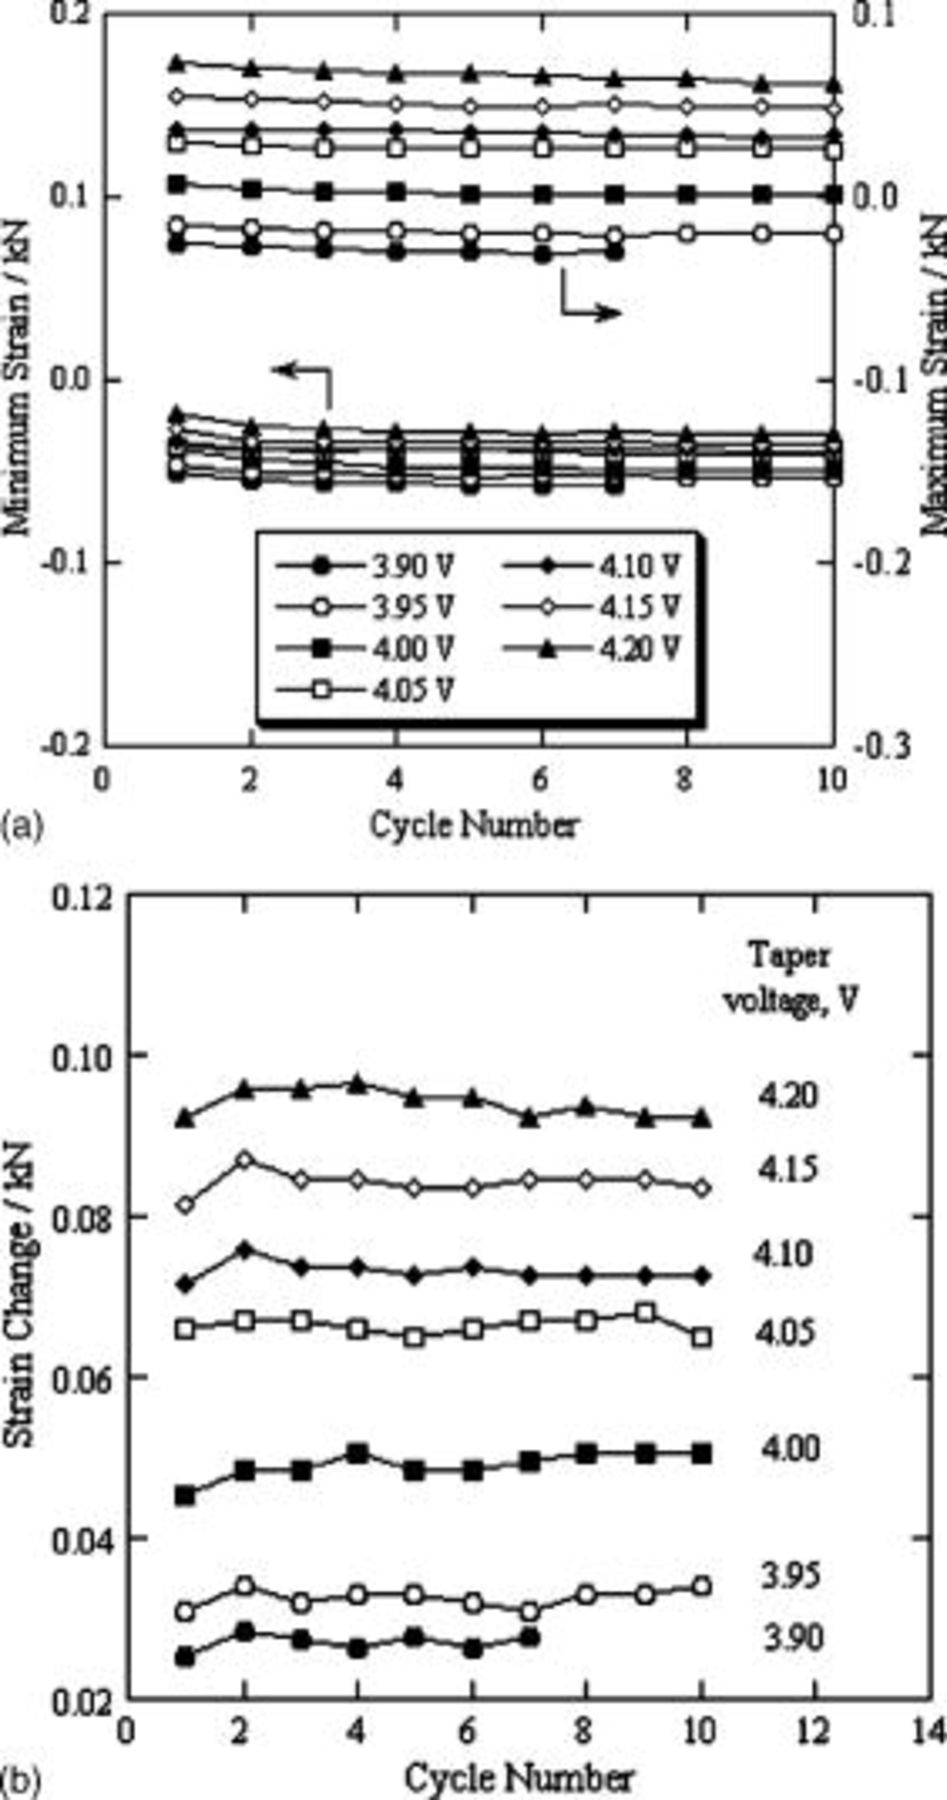
Figure 6. (a) Maximum and minimum strain values and (b) their difference as strain change during cycling of a lithium-ion polymer cell, as a function of taper voltage.
Before cycling testing at each taper voltage, the cell was precharged to full-charge state. Also, the maximum strain was observed in the charging process. We collected the strain increase during each precharge process and plotted them against the precharge capacity in Fig. 7. Obviously, a maximum strain increase against precharge capacity at taper voltages ranging from  , suggesting that a taper voltage of
  indeed plays an important role in changing the cell volume.
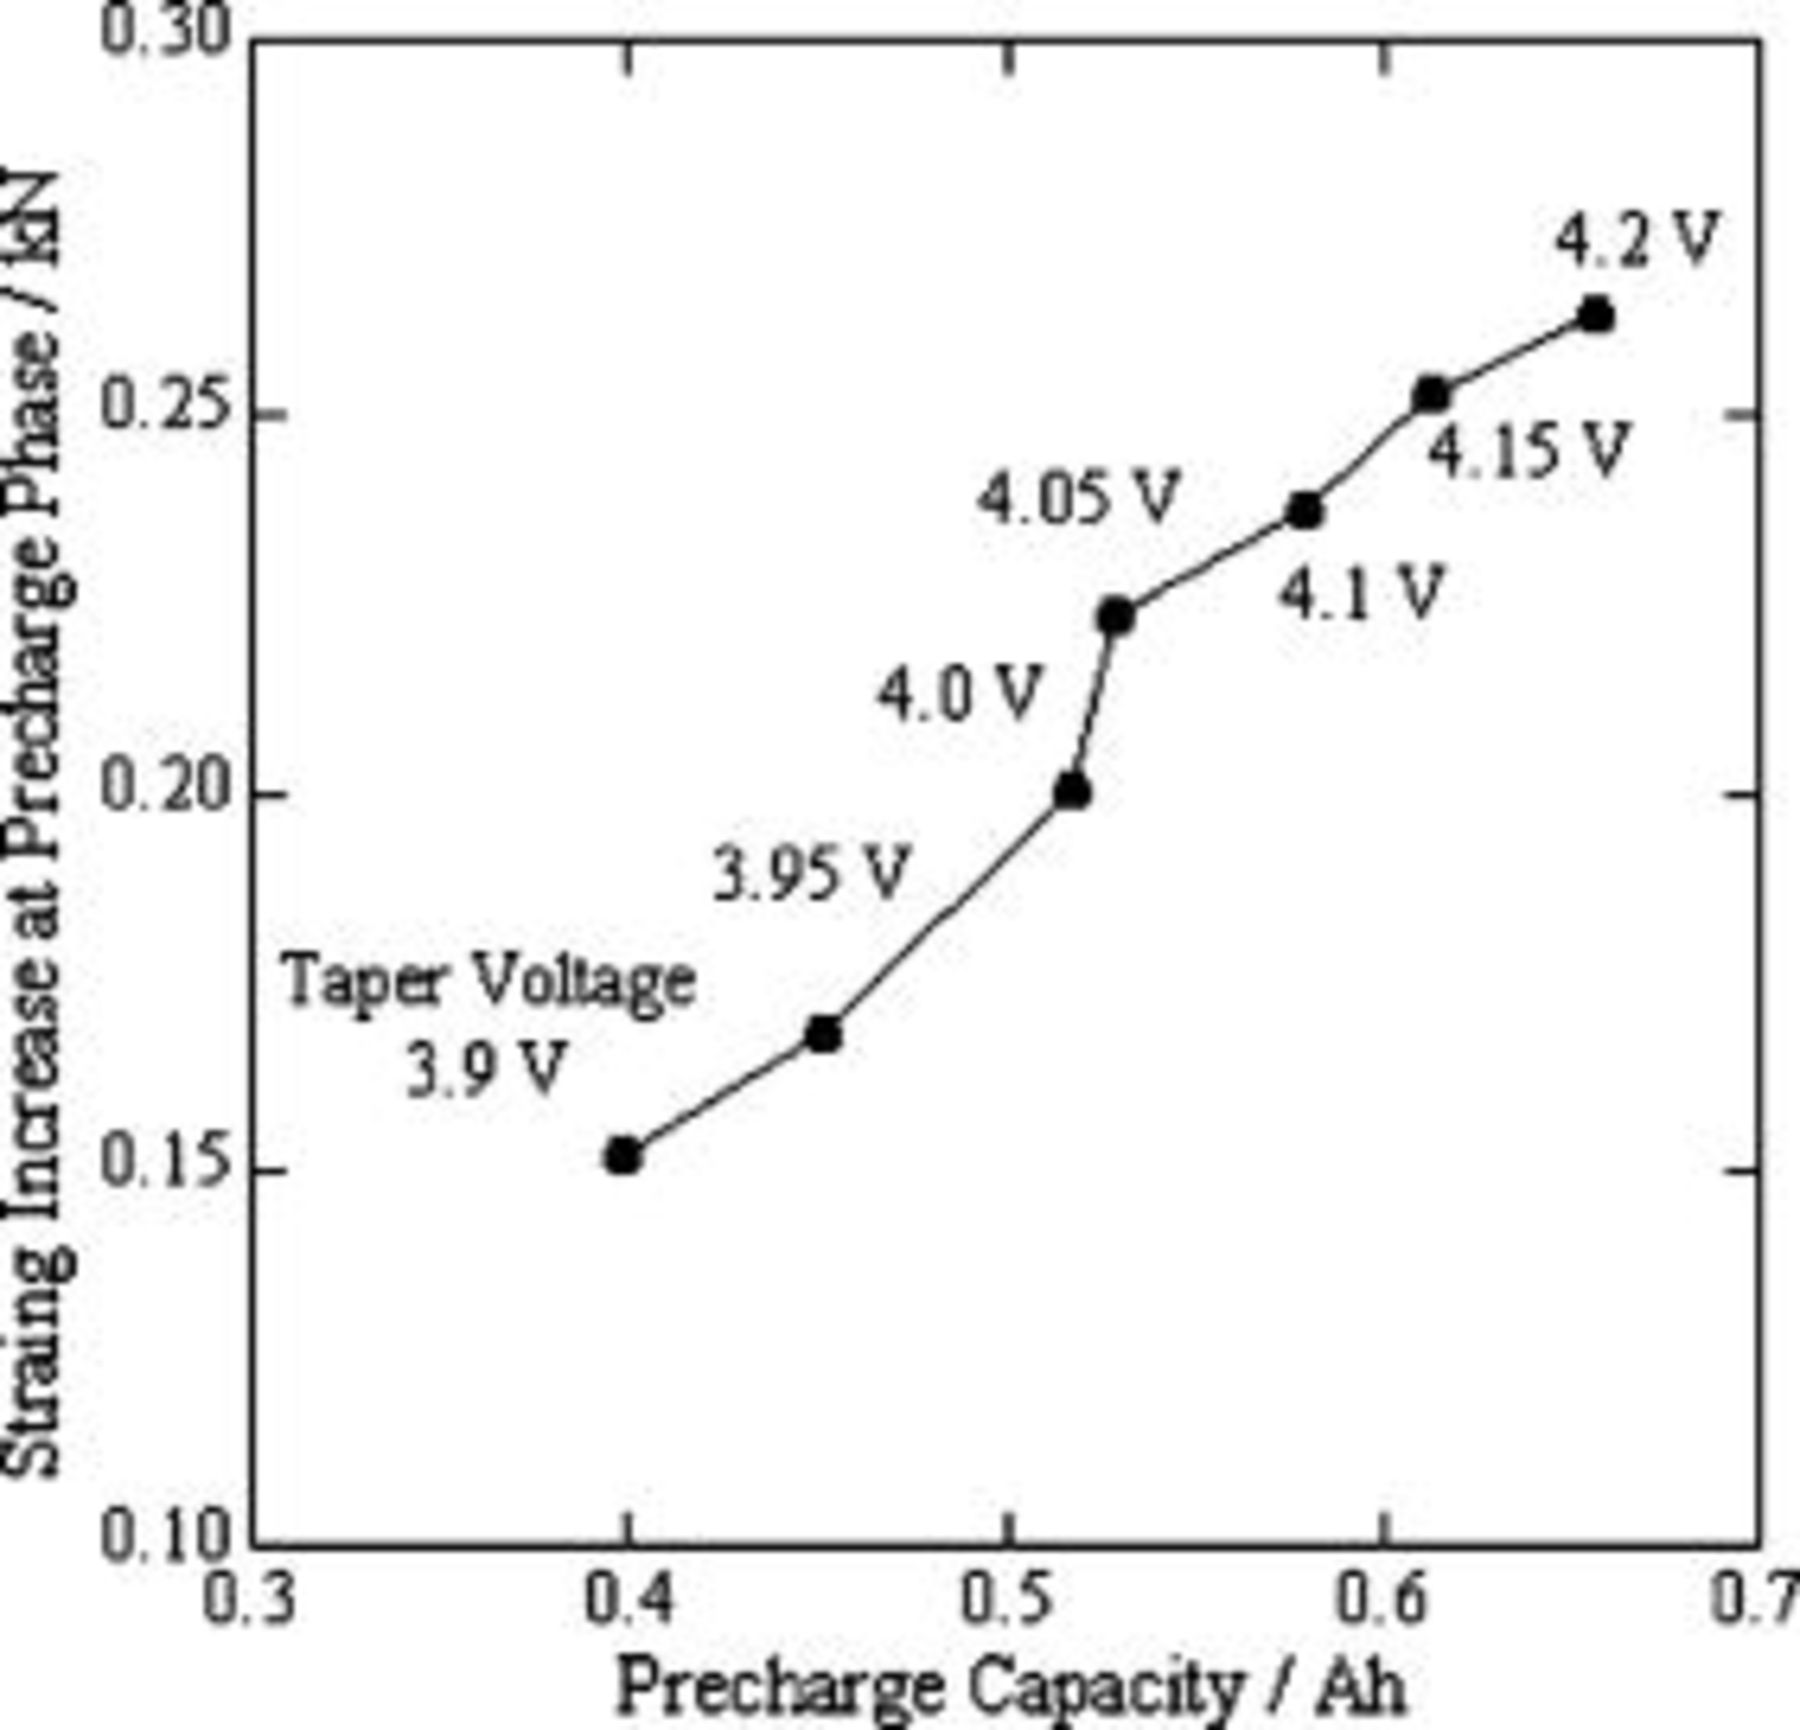
Figure 7. Strain increase in the precharge phase against precharge capacity for a lithium-ion polymer cell, as function of taper voltage.
In Fig. 5c, we note that the strain decreased in the CV charge phase of the precharge process. This is a very interesting finding, as the SOC of the cell still increases in the CV charge phase. This indicates that the cell-volume change does not depend on the change of SOC alone. Other factors may also temporarily lead to excess cell-volume change. This excess cell-volume change, delayed relative to the change induced by the SOC, should be a function of time. In our previous paper, we attributed this phenomenon to slower lithium-ion diffusion in the electrode's active materials than lithium-ion intercalates (deintercalates) into (from) the graphite anode ( cathode).19 Based on the above deduction, the strain decrease in the CV charge phase reflects the diffusion rate of lithium ions in the electrode's active materials. We determined the strain decrease in the CV charge phase at different taper voltages and summarized them in Fig. 8. At taper voltage ranging from
  , the strain decrease was at a maximum, indicating a relatively large lithium-ion differential coefficient at these taper voltages.
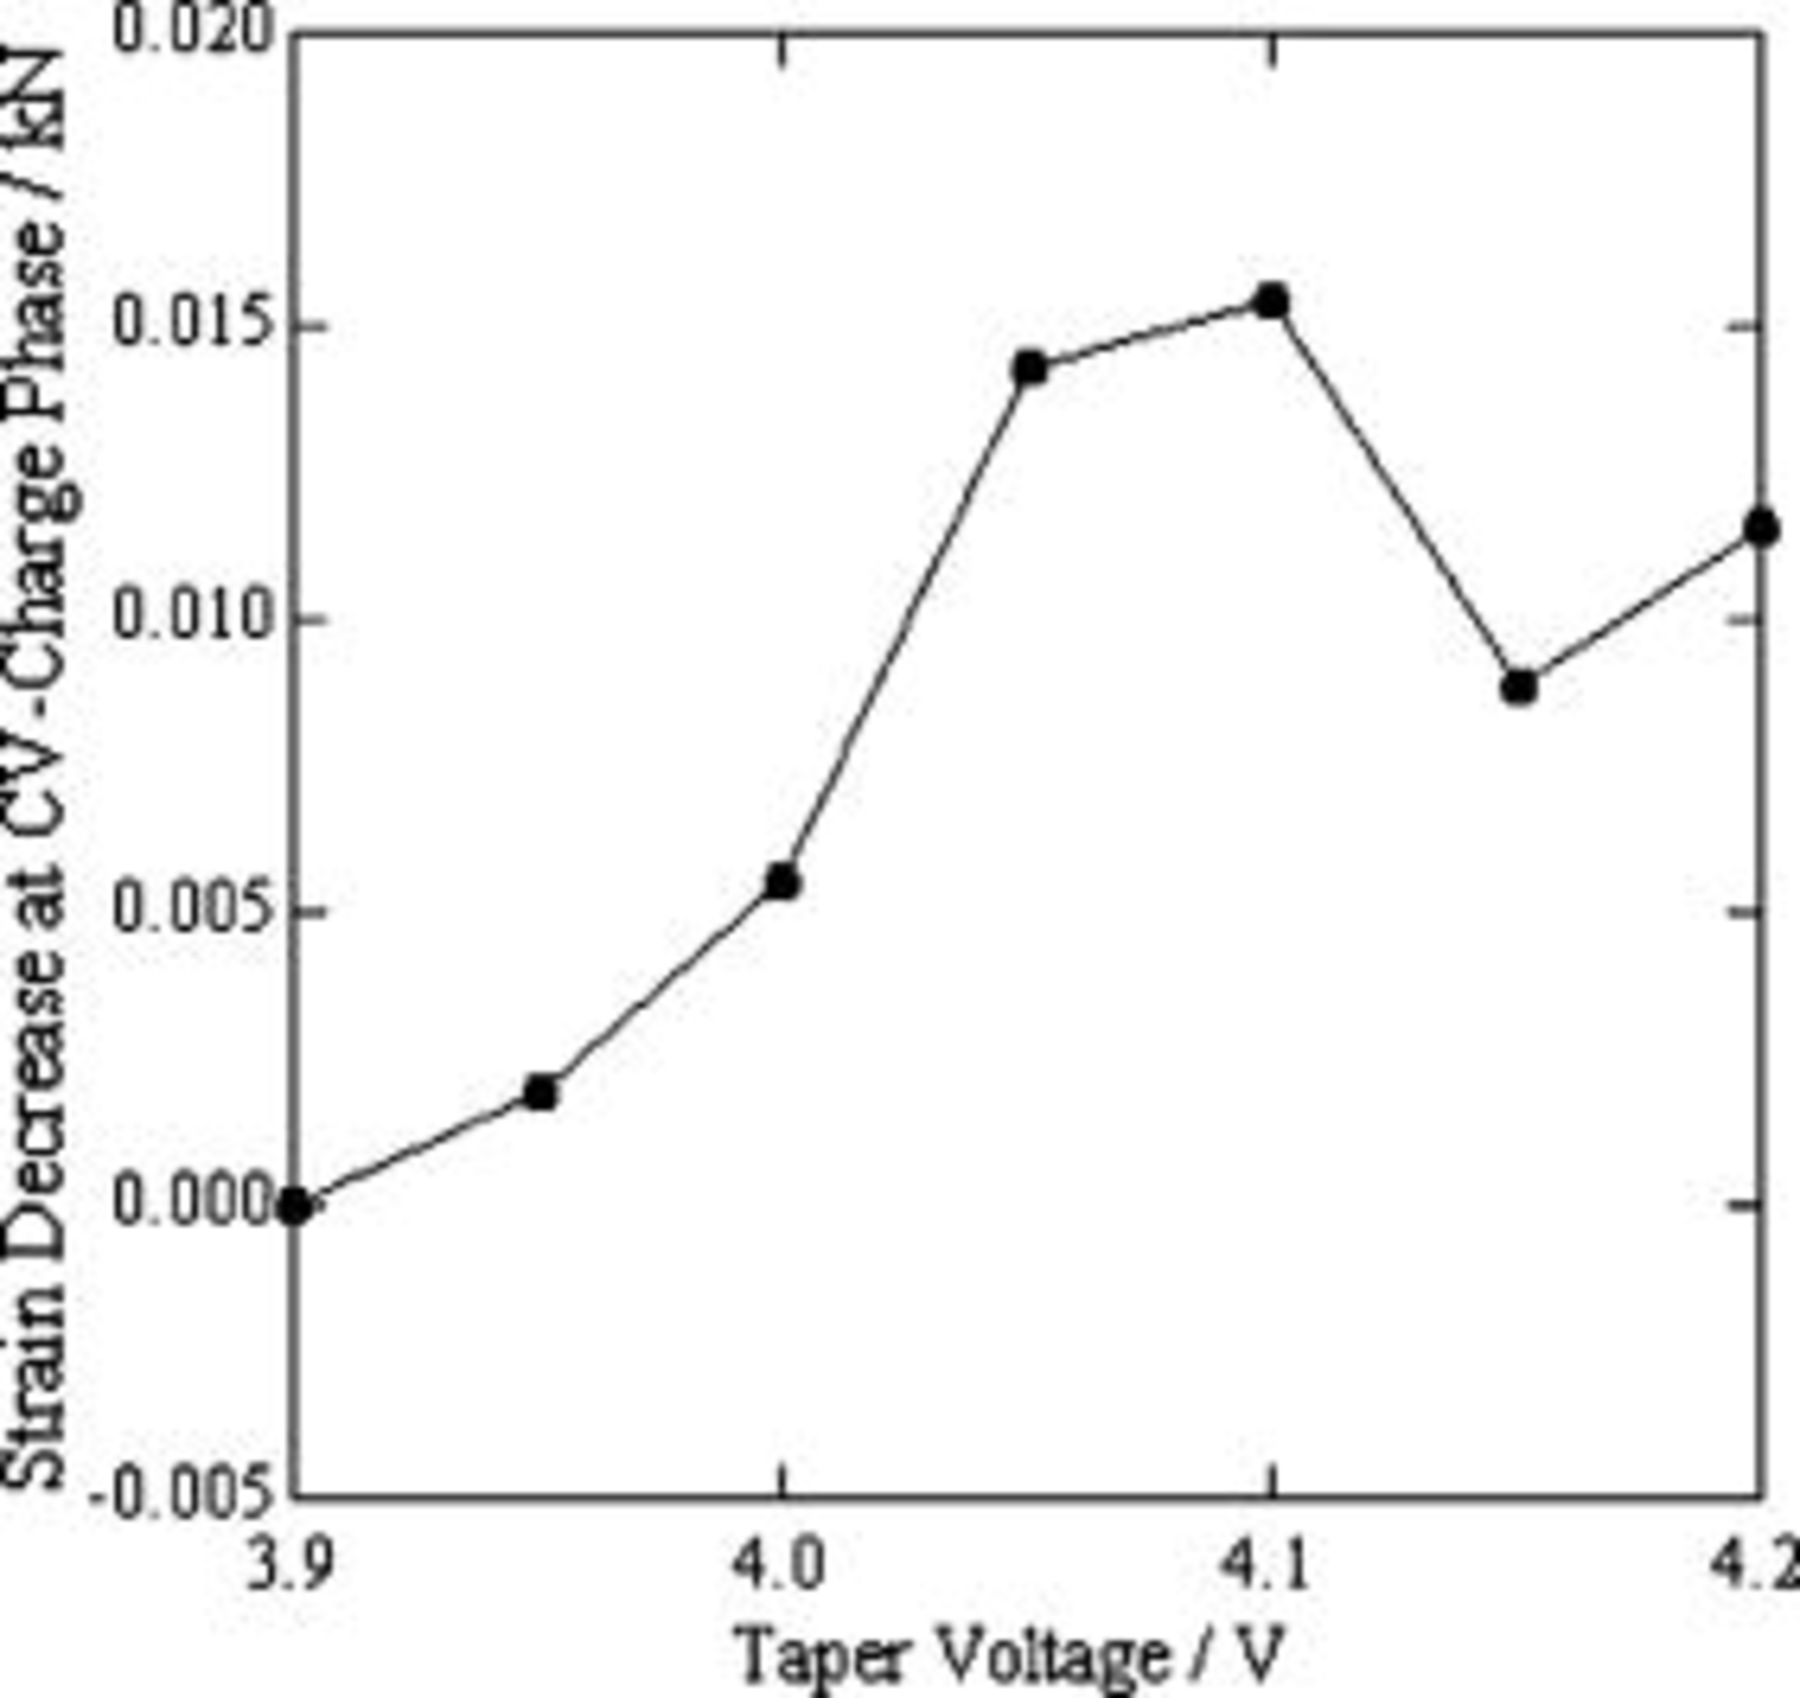
Figure 8. Strain decrease during the CV-charge phase when precharging a lithium-ion polymer cell.
Discussion
Much effort has been devoted to understanding the structure changes of both graphite anode and  cathode as a function of voltage using XRD analysis.20–25 It is well known that the volume change of graphite anode exhibits a nonlinear relationship with the lithium-ion number inside. This change is a continuous process. This explains the result obtained in Fig. 4 as the first conclusion that the cell volume increased with taper voltage. On the other hand,
  cathode exhibits much more influence on the cell volume change due to its two-phase coexistence in crystalline structure and discontinuous volume change at the taper voltage near
  . This led us to deduce that the cell volume change correlated mainly to the
  cathode, rather than the graphite anode. Therefore, we focused our attention on the cycling behavior of
  cathode to explain the taper voltage effect in this work.
In Fig. 4, we demonstrate that a taper-voltage change from  is an important factor in cell-volume change in 50 Ah-class lithium-ion cells. In situ load-cell measurement of lithium-ion polymer cells supported the above results and gave a more accurate taper-voltage range near
  . As summarized above, we investigated the performance-degradation mechanism of lithium-ion polymer cells with the same design as that used this work by using various structure analysis and surface characterization.13, 14 We found that the serious structure change in the
  cathode, rather than the solid electrolyte interphase (SEI) formation on the graphite anode, was primarily responsible for the performance degradation of the lithium-ion cell. This also led us to focus our attention on the structure change in the
  cathode to explain the phenomena observed in Fig. 4.
As described above, it has been accepted for charged  that there is a structure change from hexagonal phase (H1) to a new hexagonal phase (H2) near a voltage of
  . In addition, the H2 phase is characterized by lattice expansion along the c-axis compared to the original H1 phase. On the other hand, the graphite lattice experiences a continuous volume change with charging.24, 25 Based on the above knowledge, we can attribute the larger strain increase at the end of the charge after raising the taper voltage from
  , which is designated as the second phenomenon observed in Fig. 4, to the new hexagonal phase (H2) formation in
  cathode.
The third phenomenon observed in Fig. 4 is that the strain decreases at the end of the charge as a function of the number of cycles at taper voltages above  , in contrast to the strain increase observed at the end of the charge when using a taper voltage of
  .15 In our previous paper, we attributed the strain increase at the end of the charge at a taper voltage of
  to slow lithium-ion diffusion in the electrode particles, which causes the lithium ions to be distributed heterogeneously within the electrode's active material, and ultimately causes the excess volume change.19 The strain decrease at the end of the charge at taper voltages above
  may be explained by the schematic interpretation in Fig. 9a. Before cycling, the cell was first precharged to
  with a long taper time of
  , causing a homogeneous H2 phase in the
  structure. After this, the
  particle continuously experienced structure change between the H1 phase and H2 phase due to lithium-ion deintercalation (intercalation) during the charge (discharge) process. Because the lithium-ion diffusion in the
  particle is slower than lithium-ion intercalation/deintercalation, lithium ions in the inner region of the
  particle become difficult to take part in the charge process. The inner region of the
  particles holds residual lithium ions and will retain the H1 phase even at the end of the charge. Consequently, the region with the H1 phase increases with cycling, and causes cell-volume (strain) to decrease.
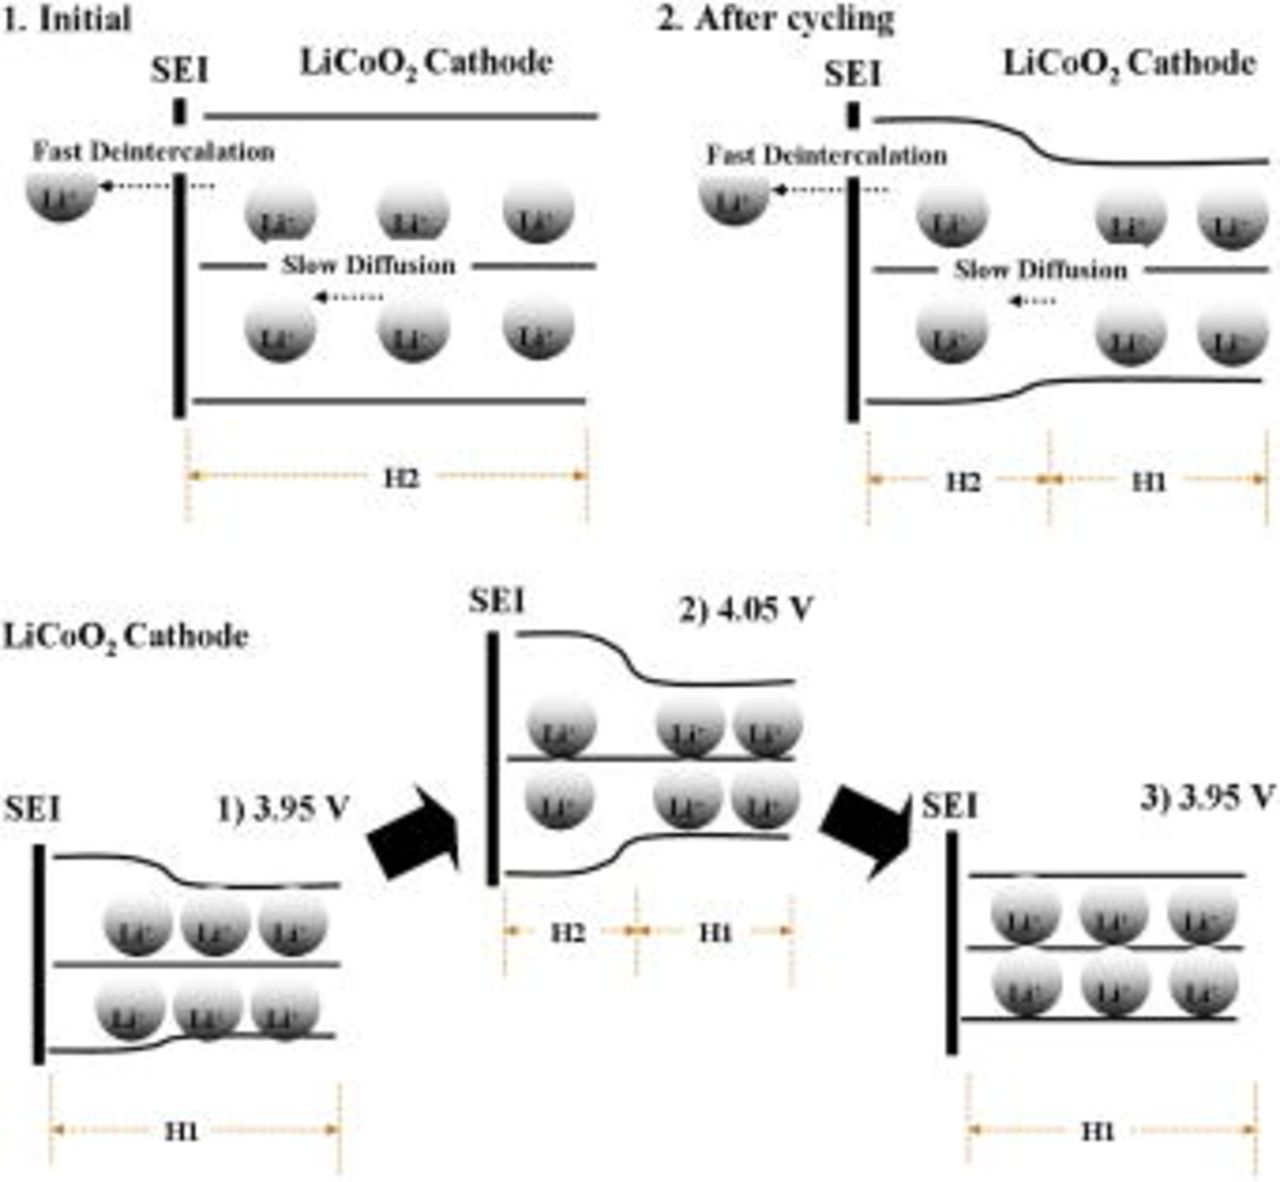
Figure 9. Interpretation of cell-volume change of a  cathode, deduced from the experimental results. (a) Charging with a taper voltage above
  . (b) Charging with a taper voltage ranging from
  .
.
It is possible that the real cell SOC decrease also affect the cell volume change. As shown in Fig. 3, the cell voltage declined at the end of the discharge, indicating the real cell SOC decrease with cycling. As summarized above, we have attributed the SOC decrease to the irreversible lithium-ion loss in  cathode. We therefore conclude that the H1 phase increase correlated to the SOC decrease. This deduction supports our explanation in the manuscript.
Figure 9b depicts a schematic interpretation for the fourth phenomenon observed in Fig. 4, which reveals that the strain at the end of the charge became smaller than the previous strain at the taper voltage of  when the taper voltage was changed from
  , as seen in cycles 2460 and 2760. During phase I, the outer region of the
  particle expands with charging at a taper voltage of
  due to slow lithium-ion diffusion, as described in our previous paper.19 However, the
  structure remains in the H1 phase during the charge process. After the taper voltage increases to
  , the H1 and H2 phases coexist in the
  structure, and the volume of the inner region in
  particle decreases with cycling, as demonstrated in Fig. 9a. When the taper voltage was changed from
  , the cell was first precharged to
  with a long taper time. Consequently, the
  structure reset to the H1 phase at the end of the charge, and the strain in the initial cycles became smaller than the previous strain at the same taper voltage of
  .
.
From Fig. 8, we deduce that the lithium-ion diffusion at taper voltage ranging from  was faster than that at the other taper voltages. This finding coincides with our previous work where minimum current at the end of the charge and maximum voltage at the end of the discharge was observed when using taper voltages ranging from
  .26 Some authors have reported that a
  cathode has a large lithium-ion diffusion coefficient in the voltage range from
  , supporting our deduction.27, 28
Here, we mainly used the structure change in the  cathode, rather than graphite anode, to explain the taper-voltage effect on cell volume change. This may be attributed to serious structure change in the
  cathode compared with the graphite anode as a function of taper voltage, though the latter has a larger volume change during charging and discharging.13, 14 It is also important to refer to the phase diagram of
  system. Because a real lithium-ion cell is designed by anode excess, the phase diagram of
  system reflects only the behavior of
  cathode. Though it is possible that the
  voltage in the phase diagram may change due to different reference electrode of lithium metal and graphite anode, the error is generally small because the voltage of graphite anode spans in
  in the cell charging state near
  . So far, the Dahn's group has conducted outstanding works on the phase diagrams of
  , and been commonly quoted in the related papers.21 Their measurements indicated a sequence of three distinct phase changes as
  was electrochemically varied over the range
  . They found clear evidence for a first-order transition (coexisting H1 and H2 phases) in the range of
  , which corresponds to the voltage range near
  in the charge process. This result supports our above explanation well that the coexisting H1 and H2 phases are the primary cause of strain behavior observed in Fig. 4.
In another paper, we investigated the relationship of strain and ambient temperature.29 We found that the strain first increased, and then decreased when the ambient temperature decreased. This led us to believe that the ambient temperature may be also an important factor to affect the strain. In the cycle-life testing of 50 Ah lithium-ion cells as shown in Fig. 1, 2, 3 and 4, the cell temperature indeed decreased with charging. However, the cell-temperature decrease was slight (below  ) because we set the cell in a thermostat environment. It is therefore possible to neglect the thermal effect on the strain change in cycle-life testing of 50 Ah lithium-ion cells.
It is important to optimize the operating conditions to maximum the cycle life of a lithium-ion cell. In our previous paper, we concluded that serious structure change in the  cathode was primarily responsible for the performance degradation of lithium-ion cells. The detrimental effects of cell-volume expansion on cycling behavior include both electrode crumbling and excess exhaust of lithium ions due to the formation of a SEI on the new electrode surface.30, 31 This work suggests that we should hold the taper voltage below
  to suppress the structural destruction of the
  particle. In the practical operation of space lithium-ion cells with graphite anodes and
  cathodes, we generally set the taper voltage at
  during the initial phase to realize a cycle life of more than
  with a DOD of 25%. After the cell's internal impedance increases to a certain extent, we raise the taper voltage to compensate for the IR-drop effect. The maximum taper voltage is
  for a lithium-ion cell with a graphite anode and a
  cathode.
Conclusions
This work investigated strain change as an indicator of cell-volume changes in five 50 Ah-class lithium-ion cells with graphite anodes and  cathodes, during charging and discharging, using an in situ method. Some interesting phenomena concerning the correlation of the taper voltage with the strain change were found at the end of the charge in the strain-trend curves, including a large strain change with a taper voltage ranging from
  , a strain decrease when using the taper voltages of 4.05 and
  , and a smaller strain after the taper voltage was changed from
  than the previous strain at a taper voltage of
  .
.
To explain the above phenomena, we examined the strain change in a commercial 0.65 Ah-class lithium-ion polymer cell with the same electrodes as a function of taper voltage. A large volume change occurred at taper voltages near  . Based on the common knowledge of continuous volume change in graphite structure and discontinuous two-phase coexistence in
  structure near
  with cycling, we focused our attention on the cycling behavior of
  cathode to explain the above phenomena. This result led us to deduce that the cell-volume change during charging correlates to the structural transition of the
  cathode from the initial hexagonal phase (H1) to a new hexagonal phase (H2). Consequently, the above experimental phenomena were explained well, as the H2 phase is characterized by a lattice expansion along the c-axis compared to the original H1 phase.
The results obtained here are important for understanding cell-volume change in lithium-ion cells used as satellite power sources. To suppress the structural destruction of the  particles and hence to maximize the cycle life, we must maintain a taper voltage below
  during practical operation.
The Japan Aerospace Exploration Agency assisted in meeting the publication costs of this article.