
Abstract
The electrochemical behaviors of native and  -coated
  electrodes which were cycled in different potential regions (i.e., 3.0-4.3 and 3.0-4.6 V) were investigated by the powder microelectrode technique. The surface species on the electrodes were also studied by Fourier transform infrared and temperature-programmed desorption-mass spectroscopy (TPD-MS) techniques. Different oxidation products were formed on the bare and coated electrodes, respectively. The results indicated that the improved cyclic stability of the coated electrodes may be attributed to formation of different surface oxide films through an electro-oxidation mechanism of the solvents on the electrodes. A possible electro-oxidation mechanism has been proposed based on the results. © 2004 The Electrochemical Society. All rights reserved.
Export citation and abstract BibTeX RIS
 is a candidate for a cathode material with high capacity and reasonable thermal properties for lithium-ion batteries.1 However,
  fades capacity relatively rapidly when the upper cutoff potential is set above 4.3 V.2
3
4 Recently, sol-gel coating of various metal oxides has been reported to improve cyclic performance, for example,
fades capacity relatively rapidly when the upper cutoff potential is set above 4.3 V.2
3
4 Recently, sol-gel coating of various metal oxides has been reported to improve cyclic performance, for example,  with
with  5 coating,
  with
with  coating,6 and other cathode materials with various metal oxide coatings.7
8
9
10
11
12
13
14 All these coated materials exhibited good cycle stability when cycled to a higher potential of ∼4.5 V. However, the mechanism of improved cycling behavior generated by coating is still not clear. Some authors suggested that a thin coating layer suppressed the lattice expansion of cathode materials during cycling that resulted in improved behavior,9
10 whereas other authors thought the coating may inhibit side reactions involving oxygen transfer from the material to the electrolyte7 or the oxidation of the electrolyte.4 Therefore, it is helpful to understand the decomposition mechanism of the electrolyte through the study of the decomposition products on the electrode surface.
coating,6 and other cathode materials with various metal oxide coatings.7
8
9
10
11
12
13
14 All these coated materials exhibited good cycle stability when cycled to a higher potential of ∼4.5 V. However, the mechanism of improved cycling behavior generated by coating is still not clear. Some authors suggested that a thin coating layer suppressed the lattice expansion of cathode materials during cycling that resulted in improved behavior,9
10 whereas other authors thought the coating may inhibit side reactions involving oxygen transfer from the material to the electrolyte7 or the oxidation of the electrolyte.4 Therefore, it is helpful to understand the decomposition mechanism of the electrolyte through the study of the decomposition products on the electrode surface.
Powder microelectrode technique is a direct way to evaluate the electrochemical characteristics of the active materials without the interference of binder and conductive additives.15
16 Because the measured current is very small (nanoampere level), the internal resistance  potential drop of the working electrodes may be neglected. The voltammetric behavior of powder materials is affected mainly by the diffusion rate of Li ions inside the particles.
Spectroscopic techniques may provide direct evidence to study and understand the electrode reaction mechanism at a molecular/atomic level. For example, Fourier transform infrared (FTIR) is a powerful technique for characterizing the absorbed species on the material surface, and temperature-programmed desorption-mass spectroscopy (TPD-MS) may be applied to obtain the mass-electric charge ratio  of the species adsorbed on the material surface. The combination of the two techniques should help us to determine species adsorbed on the electrode surface confidently. To the best of our knowledge, in the field of rechargeable lithium batteries, the TPD-MS technique has been applied to the study of surface species only on Li and graphite electrodes.17
18
of the species adsorbed on the material surface. The combination of the two techniques should help us to determine species adsorbed on the electrode surface confidently. To the best of our knowledge, in the field of rechargeable lithium batteries, the TPD-MS technique has been applied to the study of surface species only on Li and graphite electrodes.17
18
In this work, the surface of  particles were coated with a thin layer of
  by a chemical method. After 300 cyclic voltammetric experiments, their electrochemical performance and surface organic species were investigated by microelectrode and FTIR techniques. Furthermore, TPD-MS technique was applied to analyze the decomposition products of the electrolyte on the cathode material surface.
Experimental
 powders were synthesized by a sol-gel method using citric acid as the chelating agent, as reported in previous work.19 The
  -coated
  powders were synthesized by hydroxylation of tetra-n-butyl titanate (TBT) in air and the mole ratio of
  is 0.03. The sintering condition was controlled at 400°C for 5 h in air. The coating layer was about 50 nm thick by scanning electron microscopy (SEM) imaging.20 The specific surface area of the powders was measured by the Brunauer-Emmett-Teller (BET) method with
  adsorption (TriStar 3000). The surface area of powders increases from 1.57 to 3.22 m2 g−1 after
  was coated on the
  surface.
Cavity powder microelectrodes (CMEs) were made of a glass tube containing a Pt wire (diameter: 100 μm) inside; the cavity was obtained by ac electrochemical corrosion of the Pt wire in a mixture of saturated  solution and HCl solution (1:10) in a volume ratio 1:1; the voltage amplitude was controlled at about 15 V. The connection between the Pt wire and the Cu wire collector was achieved with soldering tin. The usual height-diameter of the cavity ratio was between 0.4 and 0.8.
The electrochemical experiments of the powder microelectrodes adopted a three-electrode system and were performed using a CHI 600A potentiostat/galvanostat system (Shanghai, China). A Li foil pressed into Ni net served as the counter and reference electrodes. The electrolyte was 1 M  (1:1). The potential scan rate was 10 mV/s in the cyclic voltammety (CV) experiment. The ac perturbation signal was ±5 mV and the frequency range was from 1 to
  Hz in the impedance experiments.
All FTIR measurements of electrodes were carried out by a micro-IR spectrometer  microscope, USA). After cycling, the electrodes were washed immediately several times with pure ethanol and dried under infrared light for 10 min. The spectral resolution was set at 2 cm−1 and all spectra were collected by 128 scans in the IR experiments.
TPD-MS experiments were performed by Qminstar QMS 200 (USA). First, the cathode materials were pressed directly on Al foil, the 300 cycles of CV experiments were performed, then the electrodes were disassembled in a glove box (MBraun Co., Germany,  ppm) and were washed immediately with pure DMC for several minutes and returned to the glove box for 24 h to evaporate the liquid electrolyte. Finally, the powders were scraped from the Al foil and used for the TPD-MS experiments. Helium (He) served as loading gas, the collection time of each channel was 0.5 s, and the rate of increasing temperature was controlled at 15°C/min.
Results and Discussion
Figure 1 shows multicyclic voltammetry curves of uncoated and  -coated
  materials in different potential regions at the rate of 10 mV/s. Relative changes in integrated charge with CV cycles in the potential ranges (4.6,
  V) are also presented in Fig. 1e. Only a couple of current peaks were observed in all CV curves at this potential scan rate, and the coated electrode exhibits good cycle stability no matter that the upper cutoff potential was 4.3 or 4.6 V. In comparison, the uncoated
  showed poor cyclic stability during cycling as shown in Fig. 1e. The latter, where the electrode was cycled in 3-4.6 V, the stability of the material is very poor. After 300 repeat cyclings, the shape of the CV curve became quite different from that of the first cycle, and the electrochemical activity decreased dramatically as shown in Fig. 1c. This may imply that the charge-transfer resistance of the electrodes had greatly increased.
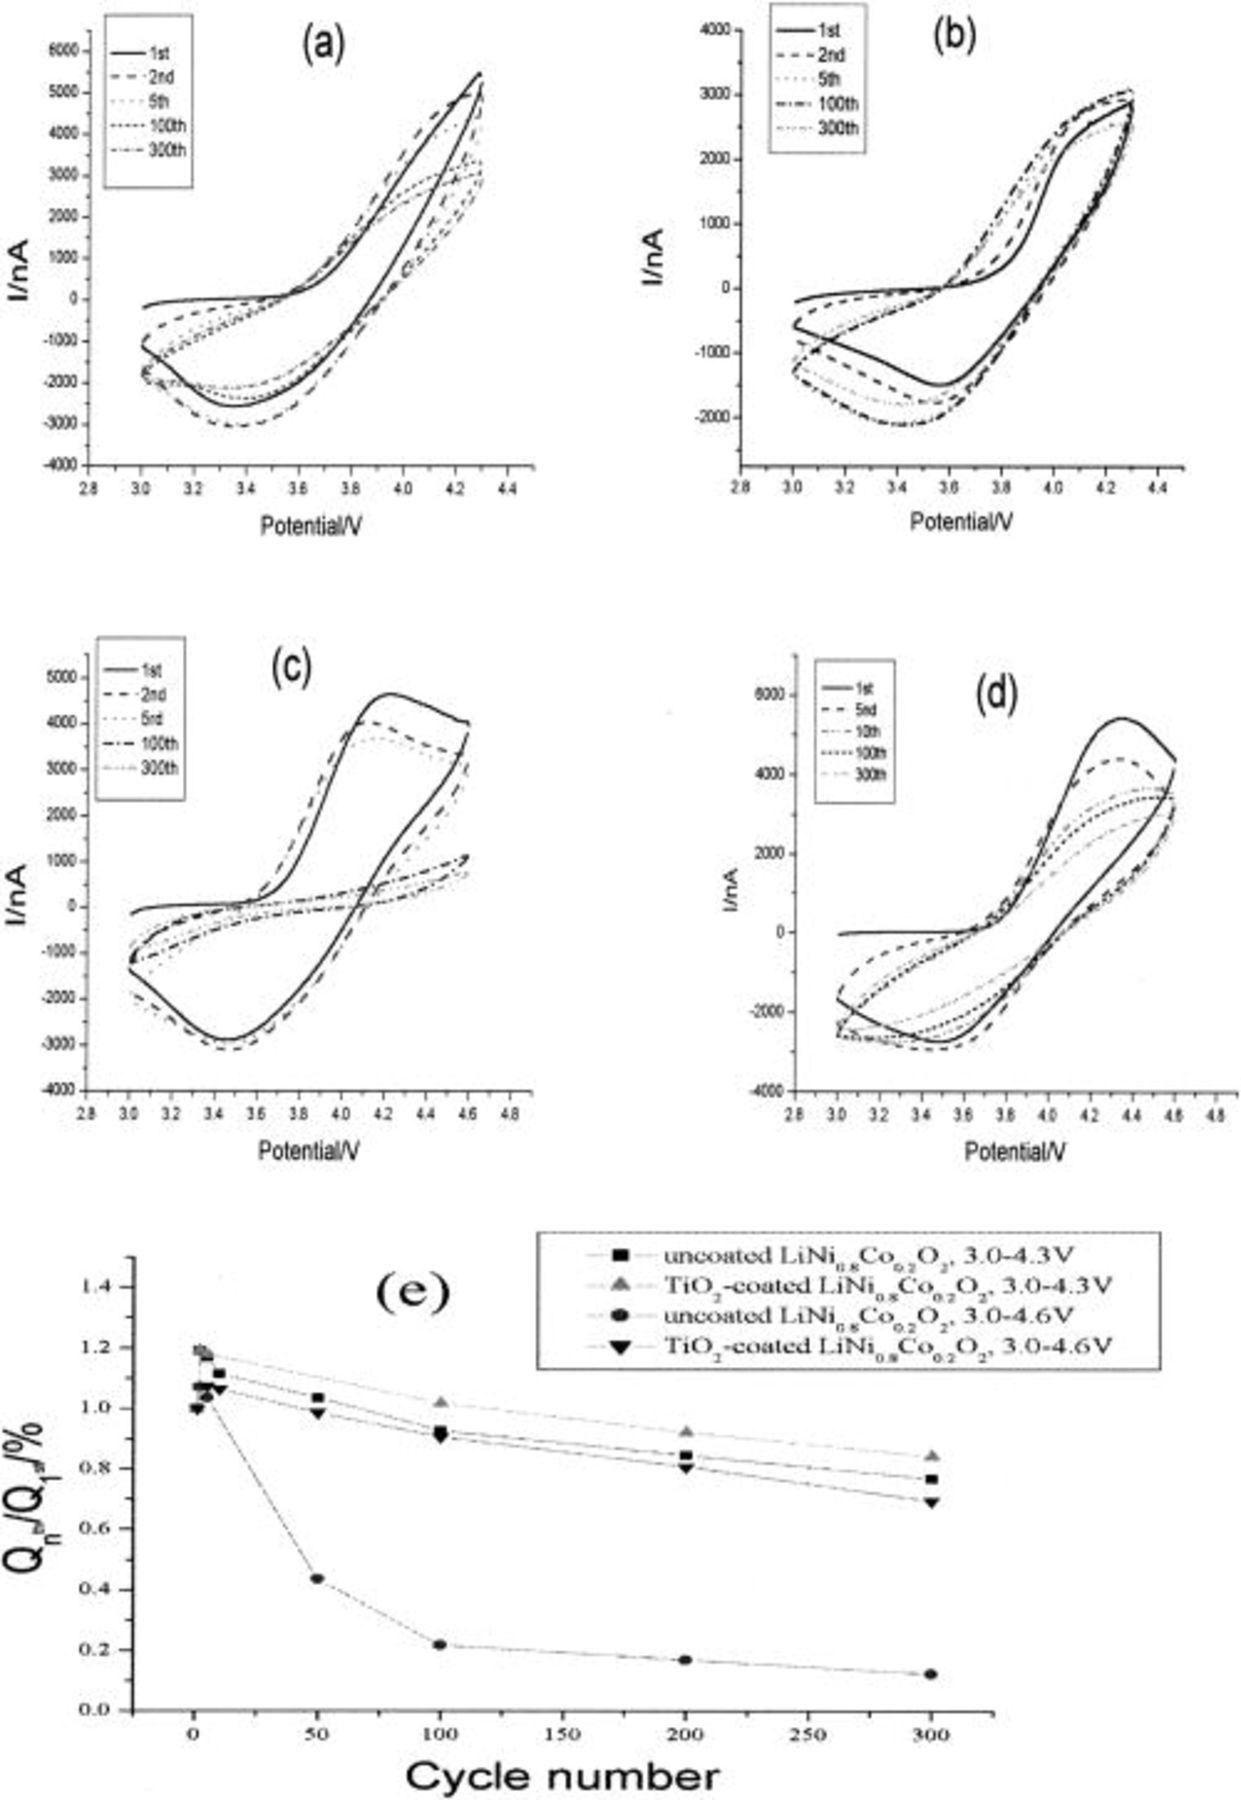
Figure 1. Cyclic voltammograms of  with and without
  coating at 10 mV/s in 1 M
  (1:1) in different potential regions; (a) uncoated
  3.0-4.3 V, (b)
  -coated
  3.0-4.3 V, (c) uncoated
  3.0-4.6 V, (d)
  -coated
  3.0-4.6 V. (e) Relative changes in integrated charge with CV cycles in the potential ranges (4.6, 4.3 to 3.0 V) of the uncoated and
  -coated
  particles.
Figure 2 compares the EIS profiles of the bare and  -coated
  before and after cycling at 10 mV/s in the 3-4.6 V region. All the electrical impedance spectroscopy (EIS) profiles in Fig. 2 consist of a high and a low frequency arc. Generally, the low frequency arc contains the contribution of the contact impedance between interparticles, whereas the high frequency arc can be attributed to the charge-transfer process between the electrode/electrolyte interface; namely, it may reflect the growth of a passive surface film formed by the reaction between the lithiated metal oxide and electrolytes.21
22 Because the initial real part of the impedance varies with the depth of the microcavity of powder microelectrodes, the ratio of the high frequency arc after the ith cycle to that before cycling can reflect more accurately the change of the high frequency arc without consideration of the influence from the depth and number of the particles in the microcavity. The ratio may follow the growth of the surface film formed through the oxidation of electrolytes at a high potential. For comparison, we define a variable A as
before and after cycling at 10 mV/s in the 3-4.6 V region. All the electrical impedance spectroscopy (EIS) profiles in Fig. 2 consist of a high and a low frequency arc. Generally, the low frequency arc contains the contribution of the contact impedance between interparticles, whereas the high frequency arc can be attributed to the charge-transfer process between the electrode/electrolyte interface; namely, it may reflect the growth of a passive surface film formed by the reaction between the lithiated metal oxide and electrolytes.21
22 Because the initial real part of the impedance varies with the depth of the microcavity of powder microelectrodes, the ratio of the high frequency arc after the ith cycle to that before cycling can reflect more accurately the change of the high frequency arc without consideration of the influence from the depth and number of the particles in the microcavity. The ratio may follow the growth of the surface film formed through the oxidation of electrolytes at a high potential. For comparison, we define a variable A as
Where  and
and  are the initial and final real part value of the high frequency arc in the ith cycling,
  and
and  are those corresponding values before cycling. The relationship between A and the number of cycles is shown in Fig. 3. It indicates that the A value of the uncoated material increases sharply with the number of cycles, whereas that of the coated material does so much more slowly. This is interpreted that the formation of surface film is restrained and the decomposition reaction of the electrolytes is suppressed upon coating the
  surface with
  this is further confirmed by the following FTIR experiments.
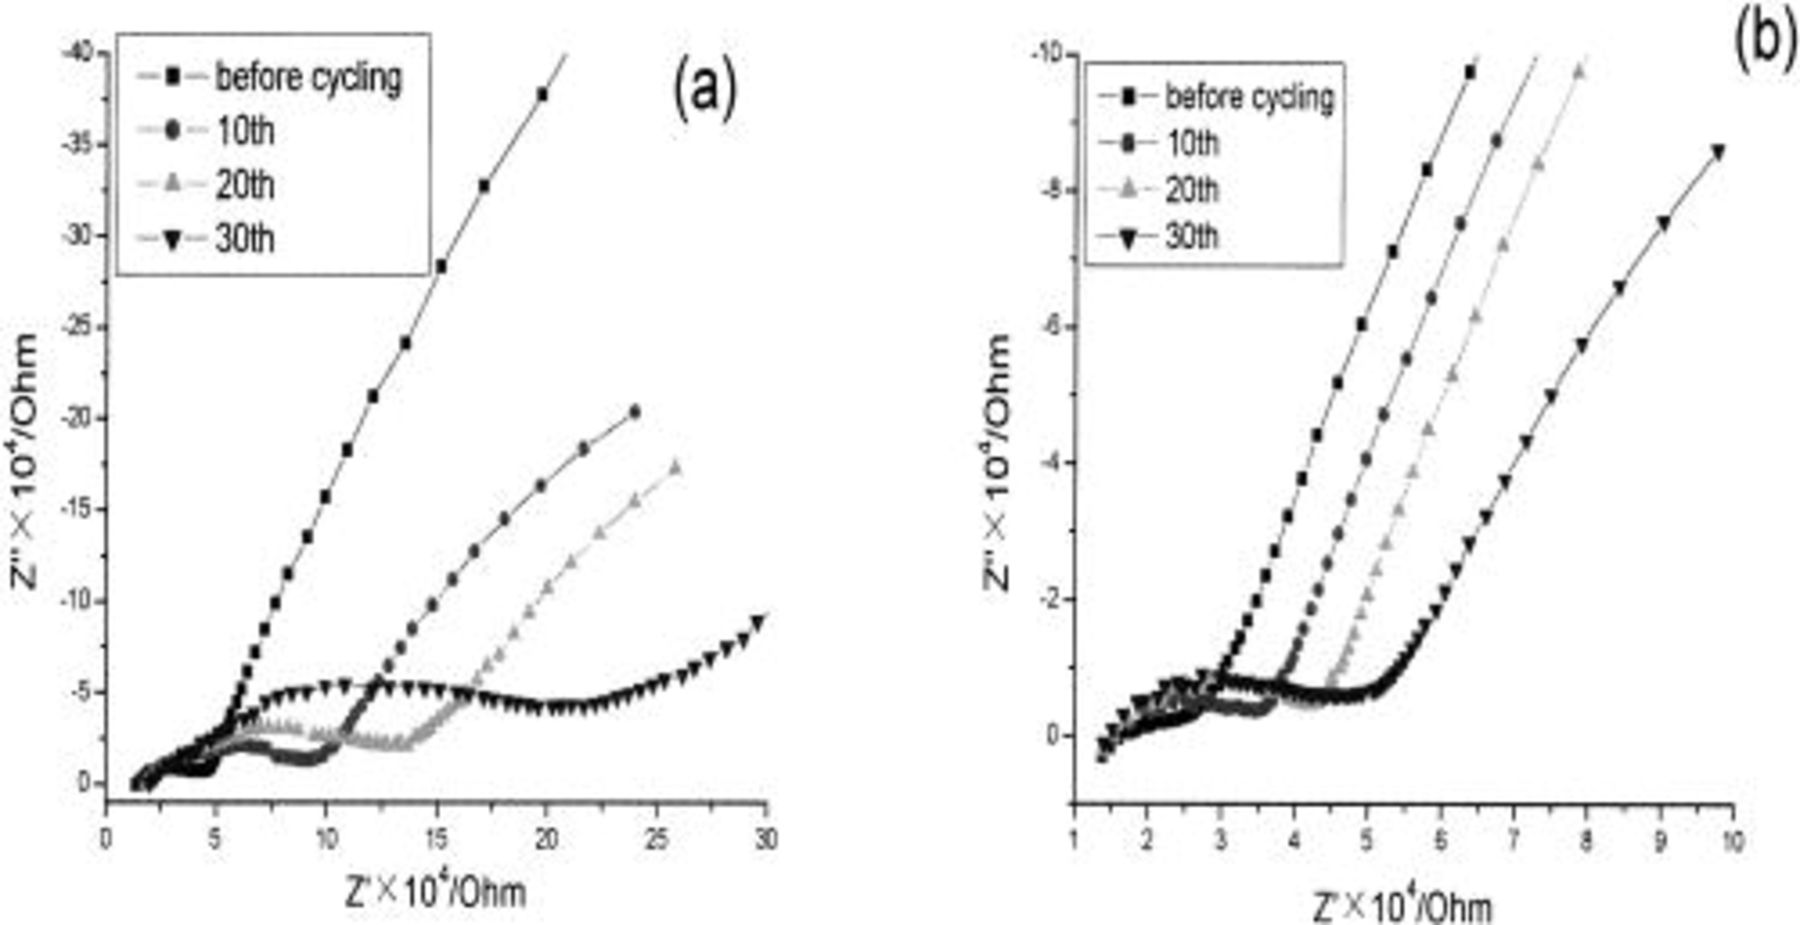
Figure 2. The ac impedance spectra of the (a) uncoated and (b)  -coated
  before and after multiple cycling at 10 mV/s in 3-4.6 V in 1 M
  (1:1).
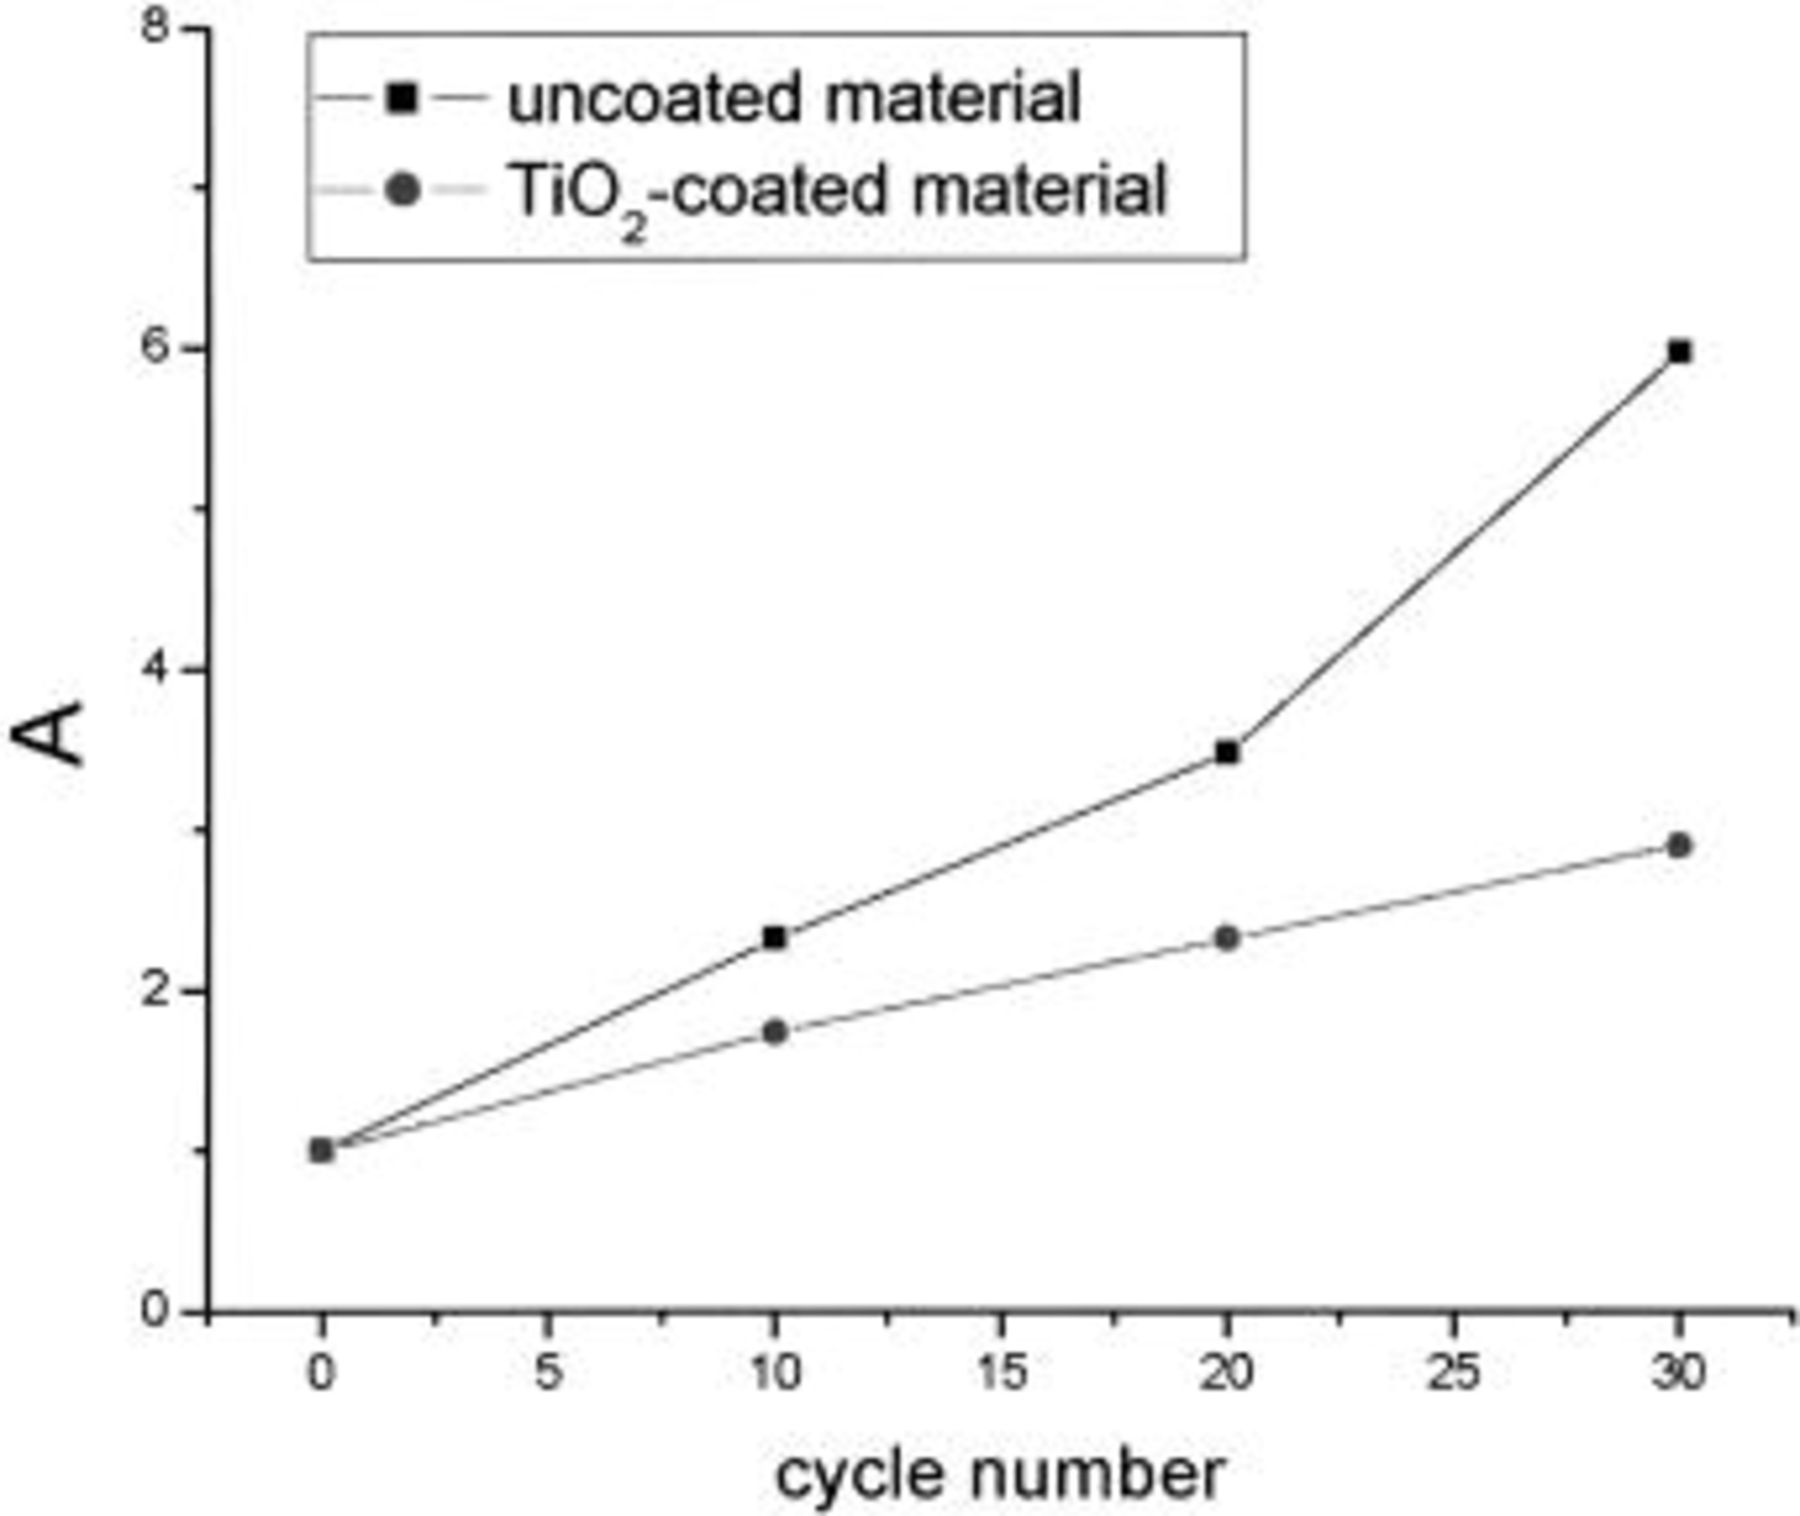
Figure 3. Change of A value with the number of cycling in the potential region of 3.0-4.6 V.
The FTIR reflection spectra of the coated and uncoated  particles in the microcavity before and after 300 cycles in different potential regions show (Fig. 4) a new band at about 1510 cm−1 that is assignable to the
  stretching vibration.23 This band must come from the decomposition products of EC and/or DMC, and was also observed in the in situ subtractively normalized interfacial (SNI) FTIR spectra, wherein Ni served as the work electrode, by Joho and Novak.24 Therefore, it is concluded that the decomposition products of electrolytes in these electrochemical experiments are mainly carboxylate salts
  In addition, as seen in Fig. 4, the intensity of this band for the uncoated electrode is greater than that for the coated electrode. Furthermore, the intensity for the uncoated electrode increases dramatically in higher potential cycling. These results indicate that the decomposition of electrolytes on the uncoated electrode surface is much more serious leading to more decomposition products. It is concluded that the decomposition of organic electrolytes at high potential is suppressed when
  coats on the
  particle surfaces. This is in good agreement with the EIS results.
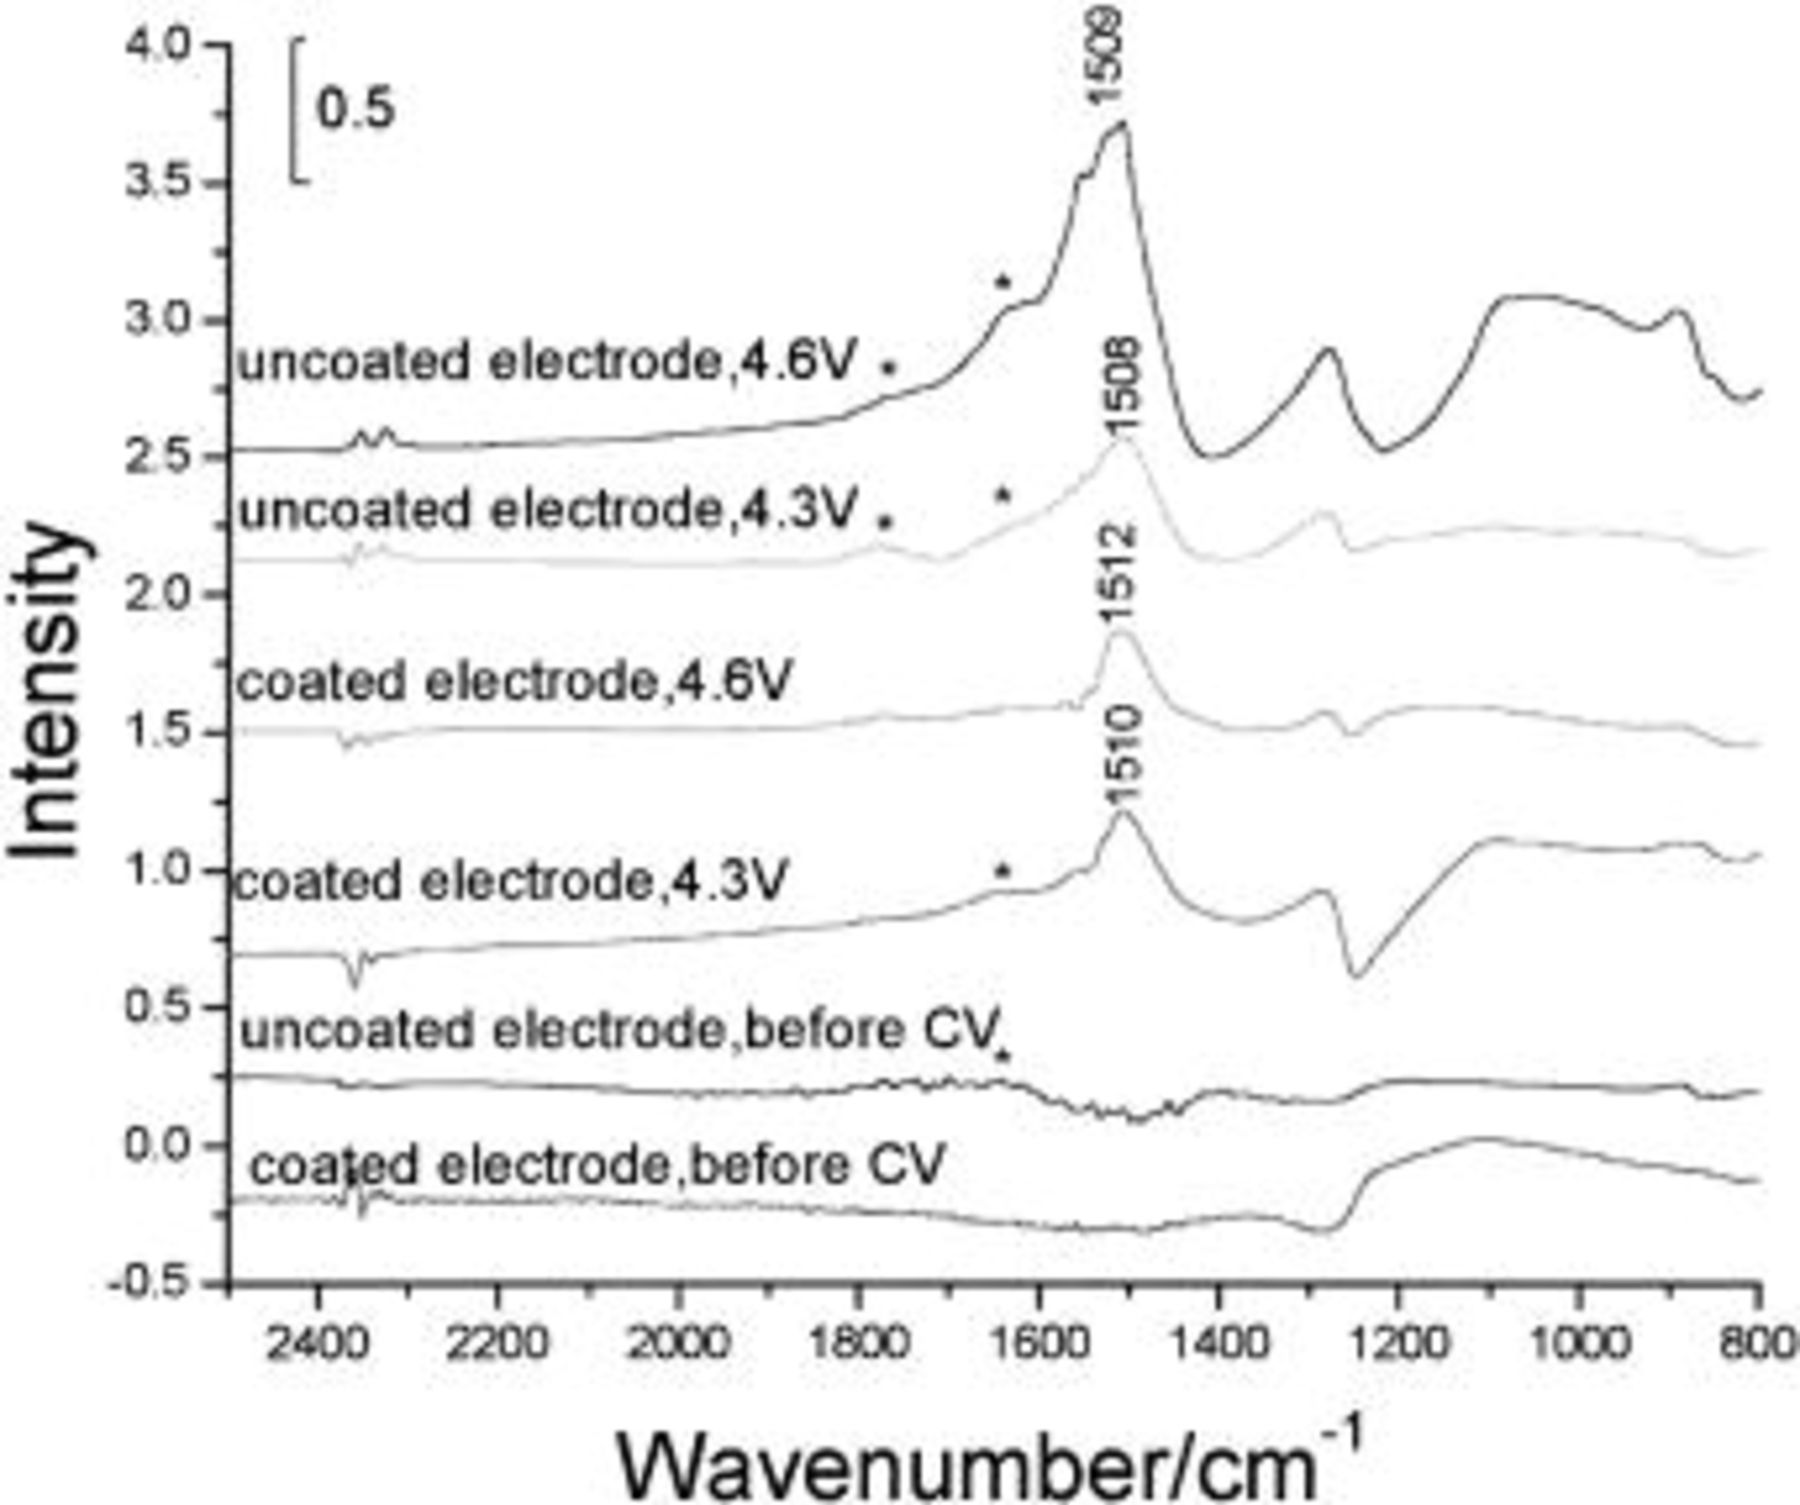
Figure 4. FTIR spectra of the uncoated and  -coated
  before and after 300-fold cyclings in 1 M
  (1:1) (* peaks represent the residual electrolyte). The conditions of the samples have been indicated above each spectrum.
The suppressed decomposition of the electrolyte on the coated materials is readily understood in the term of a  intermediacy which is known to have very strong oxidation ability. At a high potential,
  is formed significantly on a bare, high deintercalation state
  surface and these
  must oxidize electrolytes. In contrast,
  is a very stable ion without high oxidation capability. When the cathode particle surface was coated with
  its surface materials were insulated from the electrolytes. Therefore the oxidation of the electrolyte was suppressed.
Determination of the oxidation products helps us to understand the electrolyte oxidation mechanism. To investigate these decomposition products in depth, a series of TPD-MS experiments were performed. With the increase in temperature, the species of  20, 30, 32, 44, 45, 46, 69, 85, 104, and 88 were observed simultaneously for both electrode materials. The assignments of possible structure for these species are shown in Table I. Whereas the species of
  59, 73, and 87 that correspond to
 and
and  (see Table I) are observed for the uncoated electrode materials (see Fig. 5 and 6), respectively, the last species of
  87 was observed only for the
  -coated electrode material. The absence of
  and
and  on the coated electrode surface may be credited to two reasons: (i) the electrolyte decomposition was greatly suppressed due to
  insulating the cathode surface, so that the formation of
  and
and  was too small to detect.
  The mechanisms of electrolyte decomposition on the two electrode surfaces are different, namely, that they show either different decomposition routes or the same route but not with the same rate-limited step. From TPD-MS experiments, the amount of
  or
or  from the uncoated electrode is significant in comparison to the nil detection from the coated electrode (see Fig. 5). For the related comparison of
  yields, Fig. 6b shows that there is an obvious decrease for the coated electrode but not to the extent of zero. If we assume that the same mechanism governs electrolyte decomposition on both types of electrodes, the relative amount of both
  and
and  should be comparable to that of
  observed in Fig. 6b, i.e., the amount of the formed species in Fig. 5a and b for the coated electrode should not be zero. Thus, the disparity observed in TPD-MS experiments (Fig. 5 and 6) dictates a dissimilarity in electrolyte decomposition routes.
Table I.
The mass/electron ratio  and corresponding assignment of the decomposition products on coated and uncoated electrode surfaces. and corresponding assignment of the decomposition products on coated and uncoated electrode surfaces. | |||
|---|---|---|---|
 | Assignment | Uncoated electrode | Coated electrode |
| 20 | HF | +a | + |
| 30 | HCHO | + | + |
| 32 |
 or or  | + | + |
| 44 |
 or or  | + | + |
| 45 |
 | + | + |
| 46 |
 | + | + |
| 59 |
 | + | −b |
| 69 |
 | + | + |
| 73 |
 | + | − |
| 85 |
 | + | + |
| 87 |
 | + | + |
| 88 | EC | + | + |
| 104 |
 | + | + |
| a + represents the presence of the species. | |||
| b − represents the absence of the species. | |||
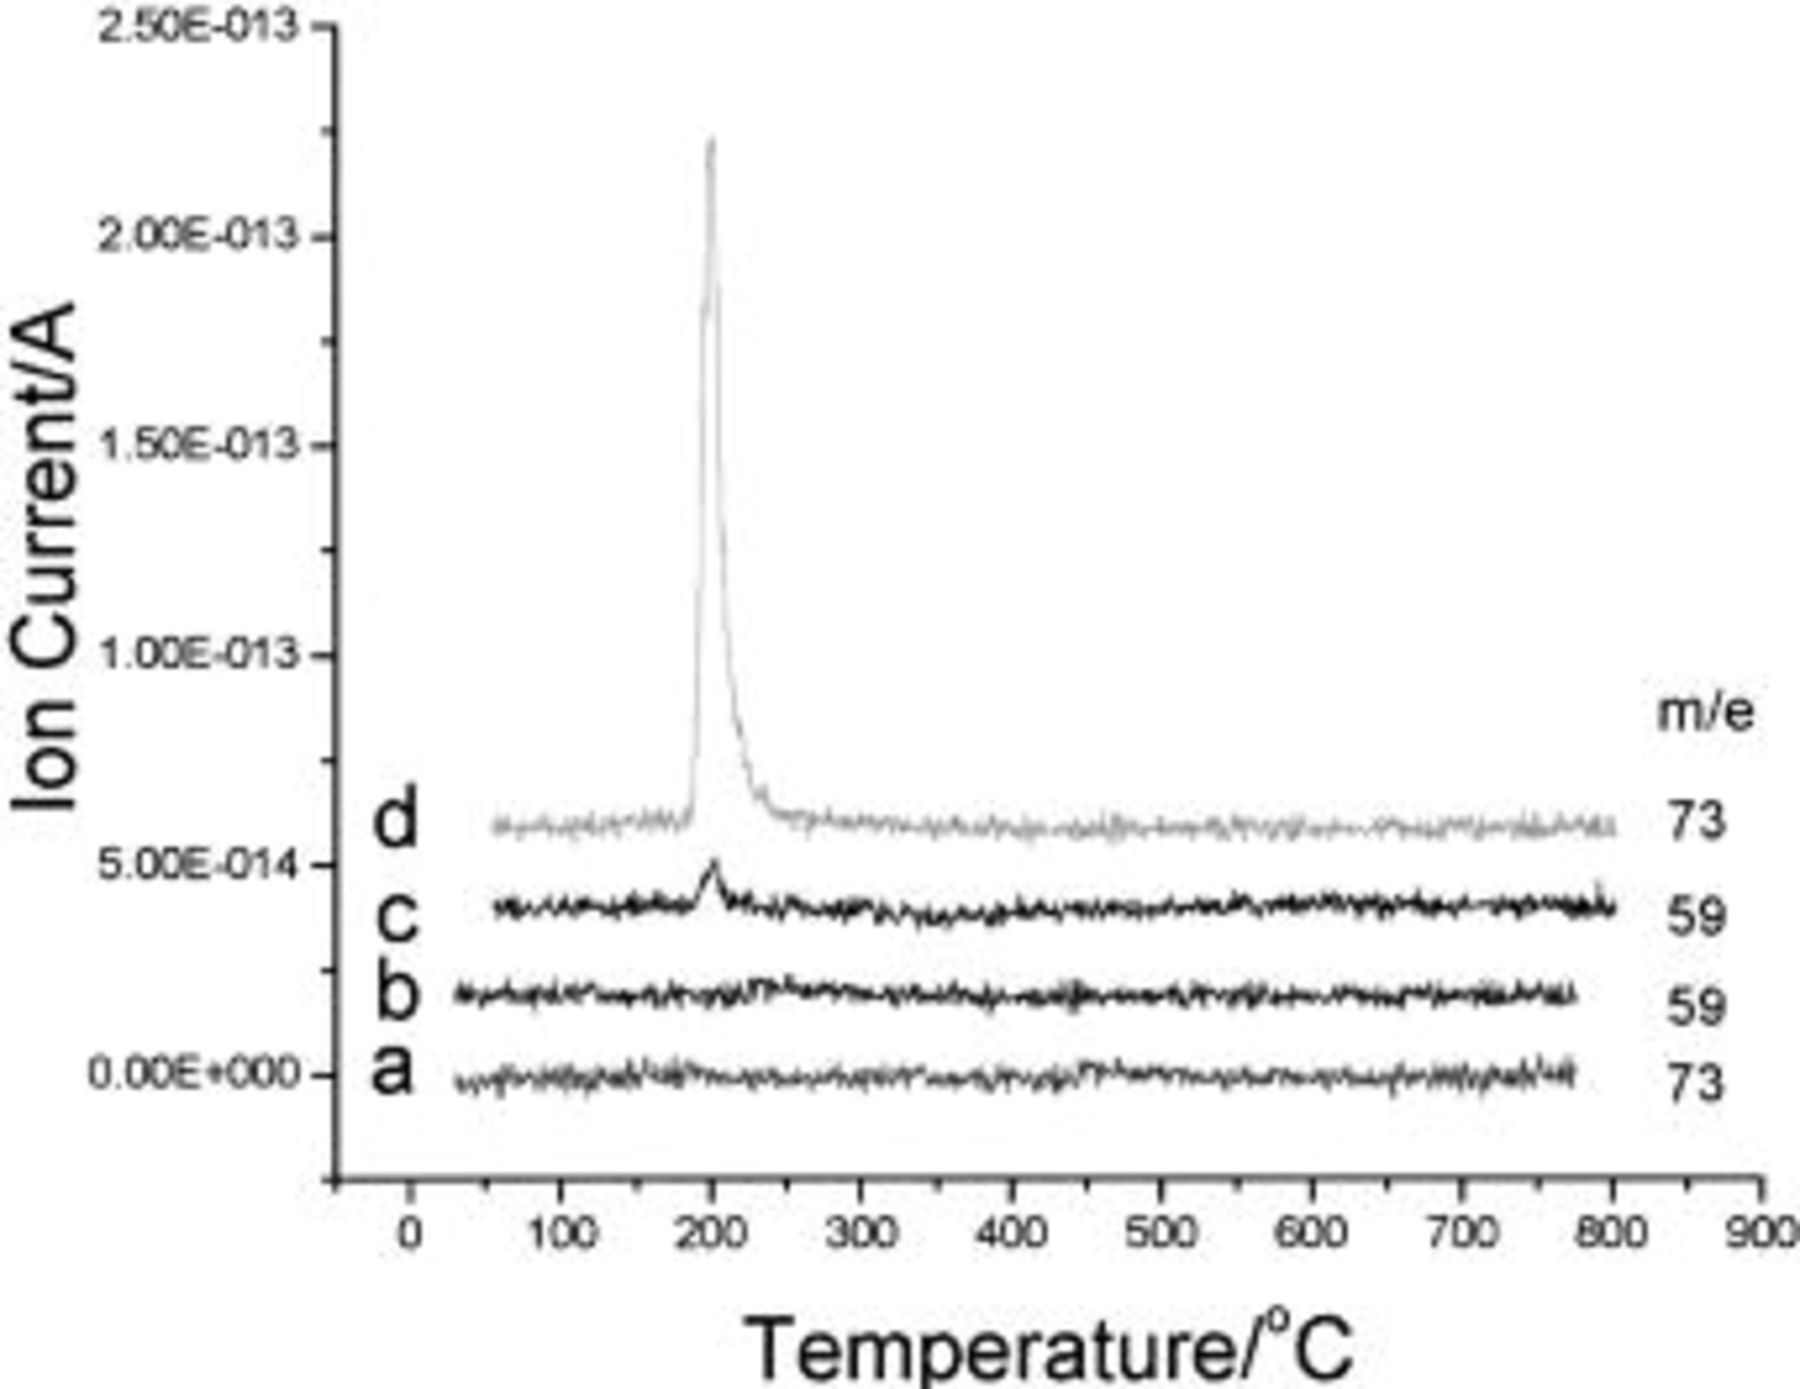
Figure 5. TPD-MS results of the (a,b)  -coated and (c,d) uncoated
  after 300 cycles in 1 M
  (1:1) in the 3-4.6 V scan potential range.
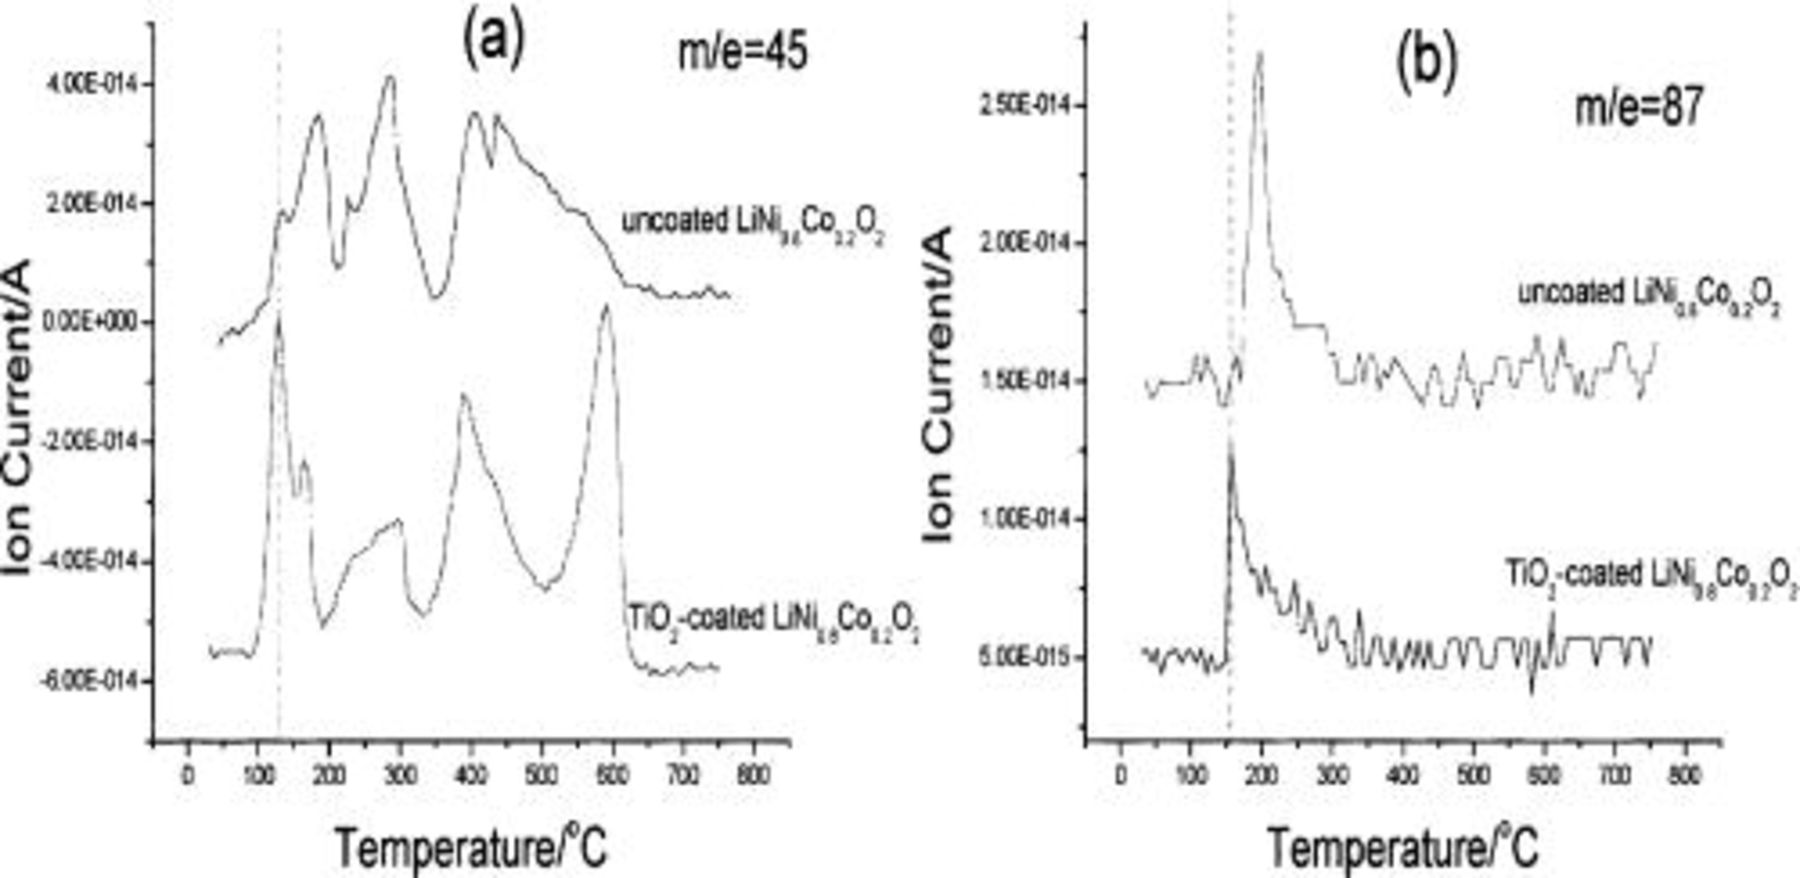
Figure 6. TPD-MS experiments of the  -coated and uncoated
  after 300 cycles in 1 M
  (1:1), the scan potential region: 3-4.6 V.
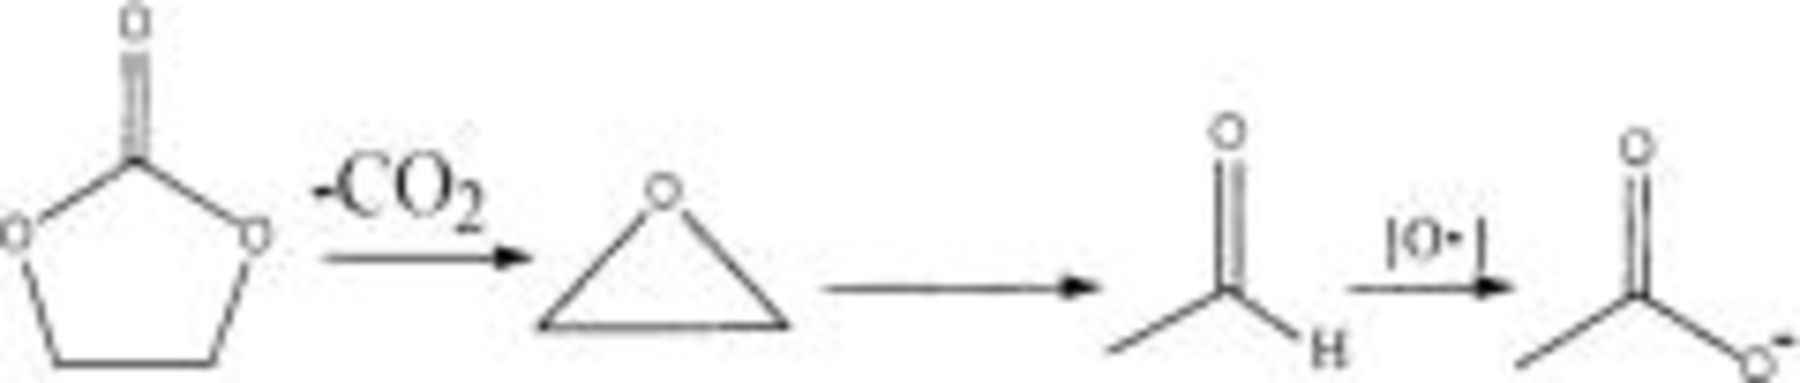
The TPD-MS experiments of the two electrode materials before and after 300 cycles in pure DMC as the electrolyte between 3 and 4.6 V were performed to clarify the decomposition mechanism of the electrolyte. The results showed that the species of  30, 45, and 46 were observed only after cycling, but not before cycling for the two materials; that is, the decomposition products of DMC are HCHO,
  etc. that are generated through an electrochemical process as depicted below
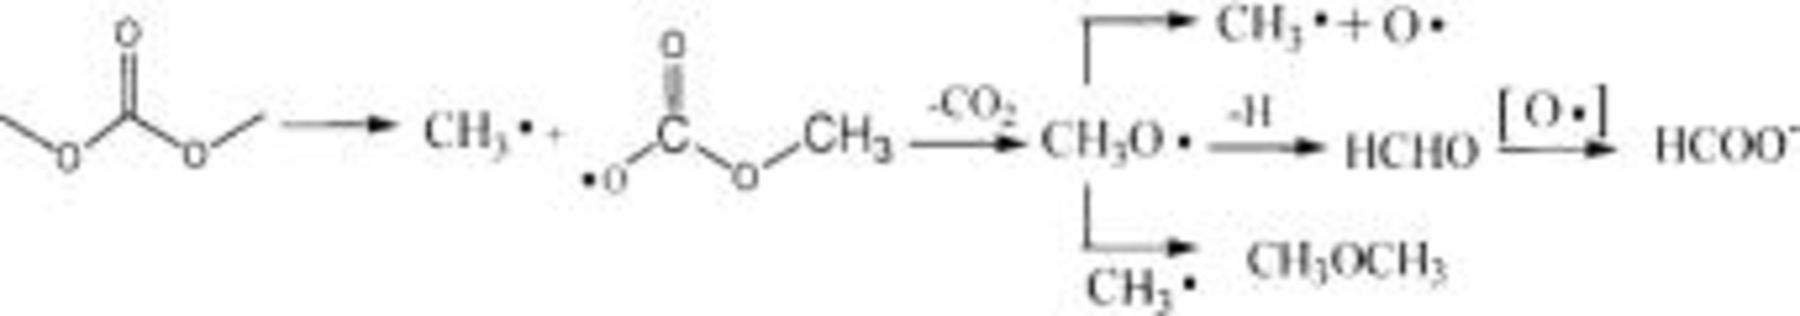
For the small amount of  generated in
  electrolytes on the uncoated electrode surface (see Fig. 5c), it is most reasonable to propose EC as the source, and in analogy to the suggestion by Arakawa and Yamaki,25 follows the following mechanism involving a 1,2-proton shift
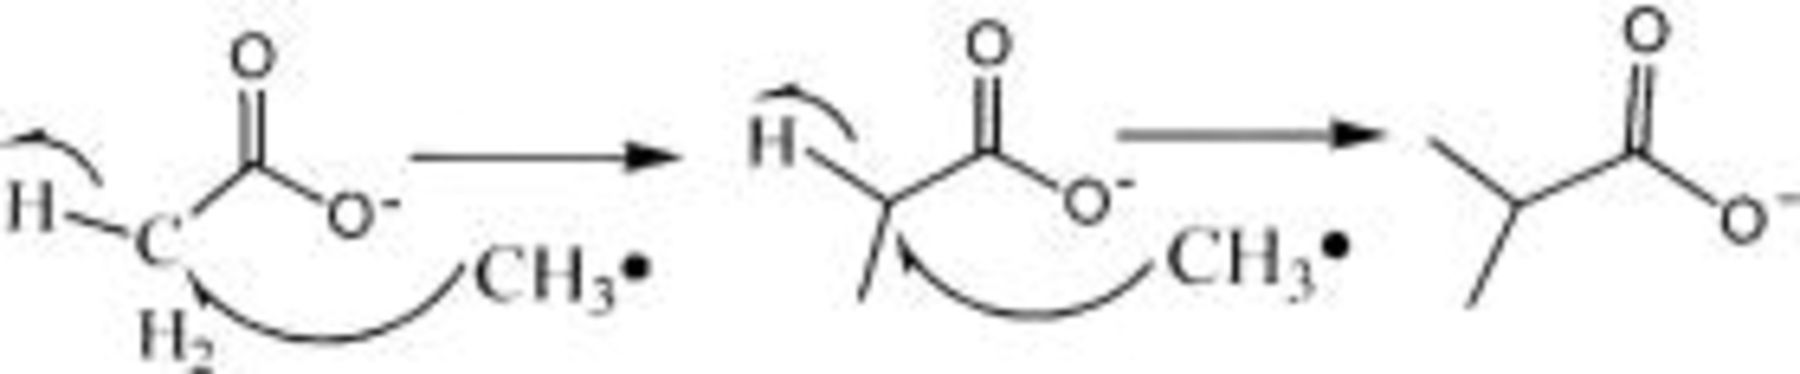
Because of the effect of electric fields,  is concentrated on the positive electrode surface, and the electron cloud on the carboxyl
  is attracted by the positive charge electrode surface. Therefore the β-C of
  is electropositive due to the induction effect and it is easily attacked by
  which comes from the decomposition of DMC. These
  can react continuously with β-C of
  and generate
 However,
  is very difficult to react further with
  due to the effect of space. Consequently, the amount of
  is absent or too little to observe in the TPD-MS experiment. The reaction route may be expressed in the following path
The desorption temperature of 
 and
and 
 for the uncoated electrode is higher than that for the coated electrode as shown in Fig. 6; this is particularly obvious for the
  87 species. It implies stronger interaction between the carboxylate anion and the uncoated electrode surface. This strong interaction may be caused by chemical absorption between carbonyl/carboxyl groups and nickel ions
  or
or  on the uncoated electrode surface. Therefore, it is proposed that
  is first partly absorbed on the electrode surface and those excessive and free
  can react with
  to generate
  Similarly,
  is also absorbed on the electrode surface after its formation. Therefore,
  and
and  are adsorbed on the uncoated electrode surface in the decomposition process and then they can be detected in TPD-MS experiments of the uncoated electrode. However, for the coated electrode, the interaction between carboxylate ion and
  is much weaker and carboxylate anions cannot be adsorbed well on the coated electrode surface. These newly formed carboxyl salts on the coated electrodes should react continuously with
  and yield
  Furthermore, the decomposition of electrolyte is greatly suppressed on coated electrodes, probably due to the lesser catalytic activity of
  layer. Thus the amount of
  on the coated electrode surface is much less than that on the uncoated electrode surface in TPD-MS experiments. Further research of the electrolyte decomposition mechanism on different cathode materials is in progress in the lab.
Conclusion
Electrochemical experiments indicated  -coated electrodes showed better cyclic performance. When potential was cycled to 4.6 V, the increasing rate of the impedance of surface films was slower than the uncoated electrodes. The effects could be attributed to the presence of
  on the surface of
  particles, which separated the active
  particle surface to the organic electrolyte. In addition, the TPD-MS experiments indicated that the electrolyte decomposition products on the two material surfaces were different. Beside
  salt, the electrolyte decomposition products on the coated
  surface were mainly
 whereas the products on the uncoated electrode surface included not only
 but also carboxyl salts of shorter carbon chains such as
  and
and  The difference in the electrolyte decomposition mechanisms may be caused by the interaction between carboxyl salts and the electrode surface.
Acknowledgment
This work was financially supported by the National Natural Science Foundation of China (no. 29925310, 29833090, and 20021002). We also thank Professor Y. L. Chow (Simon Fraser University, Canada) for comments and discussion of the manuscript.
Xiamen University assisted in meeting the publication costs of this article.