Article Text

Abstract
Background Metastatic human epidermal growth receptor II (HER2) negative breast cancer remains incurable. Our phase I study showed that anti-CD3 × anti-HER2 bispecific antibody armed activated T cells (HER2 BATs) may be effective against HER2-tumors. This phase II trial evaluates the efficacy and immune responses of HER2 BATs given to patients with metastatic HER2-estrogen and/or progesterone receptor positive (HR+) and triple negative breast cancer (TNBC) as immune consolidation after chemotherapy. The primary objective of this study was to increase the traditional median time to progression after failure of first-line therapy of 2–4 months with the secondary endpoints of increasing overall survival (OS) and immune responses.
Methods HER2- metastatic breast cancer (MBC) patients received 3 weekly infusions of HER2 BATs and a boost after 12 weeks.
Results This phase II study included 24 HER2-HR+ and 8 TNBC patients who received a mean of 3.75 and 2.4 lines of prior chemotherapy, respectively. Eight of 32 evaluable patients were stable at 4 months after the first infusion. There were no dose limiting toxicities. Tumor markers decreased in 13 of 23 (56.5%) patients who had tumor markers. The median OS was 13.1 (95% CI 8.6 to 17.4), 15.2 (95% CI 8.6 to 19.8), and 12.3 (95% CI 2.1 to 17.8) months for the entire group, HER2-HR+, and TNBC patients, respectively. Median OS for patients with chemotherapy-sensitive and chemotherapy-resistant disease after chemotherapy was 14.6 (9.6–21.8) and 8.6 (3.3–17.3) months, respectively. There were statistically significant increases in interferon-γ immunospots, Th1 cytokines, Th2 cytokines, and chemokines after HER2 BATs infusions.
Conclusions In heavily pretreated HER2-patients, immune consolidation with HER2 BATs after chemotherapy appears to increase the proportion of patients who were stable at 4 months and the median OS for both groups as well as increased adaptive and innate antitumor responses. Future studies combining HER2 BATs with checkpoint inhibitors or other immunomodulators may improve clinical outcomes.
- breast neoplasms
- cell engineering
- clinical trials
- phase II as topic
- cytokines
- cytotoxicity
- immunologic
Data availability statement
All data relevant to the study are included in the article or uploaded as online supplemental information. The data are deidentified participant data in the ONCOR data base in the Clinical Trials Office at Karmanos Cancer Institute and in a secure access database in LGL’s laboratory at the University of Virginia.
This is an open access article distributed in accordance with the Creative Commons Attribution Non Commercial (CC BY-NC 4.0) license, which permits others to distribute, remix, adapt, build upon this work non-commercially, and license their derivative works on different terms, provided the original work is properly cited, appropriate credit is given, any changes made indicated, and the use is non-commercial. See http://creativecommons.org/licenses/by-nc/4.0/.
Statistics from Altmetric.com
Introduction
Patients with unresectable or human epidermal growth receptor II (HER2) negative metastatic breast cancer (MBC) have a median overall survival (OS) between 18 and 24 months.1 Progression of disease after failure of first-line therapy is inevitable and durable responses to subsequent therapies are in the order of months and become shorter and shorter after each subsequent line of therapy.2 There is a need for novel, non-toxic strategies to prolong time to progression (TTP) and OS in the 75%–80% of the HER2-MBC patients who are not eligible for HER2-targeted therapies.
Although trastuzumab and other anti-HER2 antibodies have been approved for HER2 positive breast cancer (BrCa), the antibodies or bispecific antibodies (BiAb) have failed in clinical trials directed at HER2 negative BrCa. Arming ex vivo activated T cells (ATC) with anti-CD3 × anti-HER2 BiAb (HER2Bi) creates an entire population of HER2Bi armed ATC (HER2 BATs) that kill BrCa cells in a non-MHC restricted manner via perforin and granzyme B. Our preclinical studies show that HER2 BATs not only target and kill cells expressing high levels of HER2 but also low HER2 receptor expressing target cells.3 4
In a phase I clinical trial, the median OS for 23 women with HER2 0–3+MBC who received multiple infusions of HER2 BATs was 37 months.5 The median OS for the HER2 3+ and the HER2 negative (0–2+) were 57 and 27 months, respectively. Infusions of HER2 BATs induced statistically significant increases in interferon (IFN)-ɣ ELISpots responses to SK-BR-3 BrCa cell line in fresh peripheral blood mononuclear cells (PBMC) and Th1 cytokines in patient sera.5 HER2 BATs infusions induced both antigen-specific T cell and antibody responses to multiple epitopes of HER2, Carcinoembryonic antigen (CEA), and epidermal growth factor receptor (EGFR) that could be transferred by immune ATC expanded from patients who had HER2 BAT infusions.6
In this study, we hypothesized that consolidation IT consisting of 3 weekly HER2 BATs infusions after 4 months or 4 cycles of standard chemotherapy (chemoT) in combination with cyclophosphamide immune depletion would improve TTP from an estimated 2–4 months and OS. This phase II study confirms the encouraging clinical effects of our phase I study in women with high risk MBC and triple negative breast cancer (TNBC).5 It also shows that HER2 BATs infusions can vaccinate the endogenous immune system against the patient’s own tumors.
Patients and methods
Treatment plan
Patients with MBC were enrolled in the phase II clinical trial at Barbara Ann Karmanos Cancer Institute (KCI) and Wayne State University (WSU) in Detroit, Michigan between July 2010 and August 2014. It was monitored by the KCI data safety monitoring committee. All patients signed an informed consent form prior to enrolment.
Phase II clinical trial design
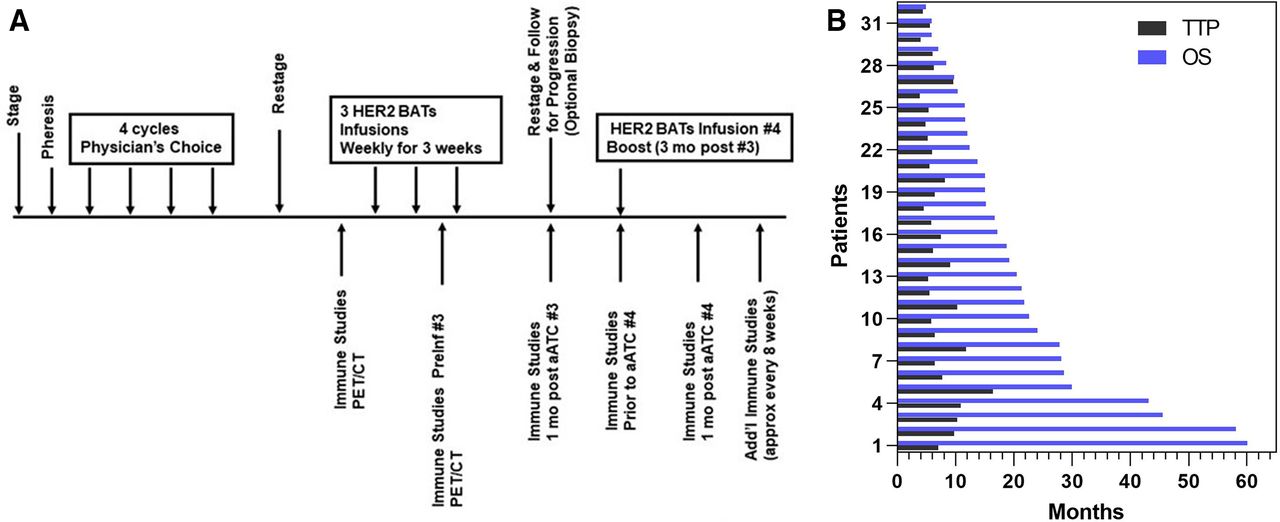
Patients with stage IV BrCa with HER2 amplification of 0–2+HER2 (0–2+) were enrolled into the phase II clinical trial (figure 1A) to evaluate if HER2 BATs infusions could extend OS and progression free survival (PFS). PBMC were collected from patients using a single apheresis, activated with anti-CD3 mAb and expanded with interleukin 2 (IL-2) to ATC. The ATC were harvested after 12–16 days of culture, armed with HER2Bi,3 and cryopreserved in aliquots for infusions.5 After apheresis, patients received four cycles or 4 months of their oncologist’s choice chemoT. The original protocol included a single dose of lymphodepleting cyclophosphamide 1.0 gm/m2 (Cy) on day −7 prior to the first dose of HER2 BATs. Immune studies in the first five patients (#1–5) suggested that the addition of Cy to 4 cycles or 4 months of chemotherapy was impairing endogenous immune. Therefore, further immune depletion was eliminated from the protocol. In an effort to increase immune responses, the last five patients (#28 – #32) were given low dose IL-2 300 000 IU/m2 subcutaneous injections daily and granulocyte-macrophage-colony stimulating factor (GM-CSF) 250 µg/m2 two times per week. A dose of 20×109 HER2 BATs per infusion (a total dose of 80×109 HER2 BATs) was selected based on safety profiles, immune and clinical responses in our phase I clinical trial.5 HER2 BATs were then thawed and infused once a week for 3 weeks followed by a booster infusion of 20×109 given 12 weeks after the third infusion. The protocol schema is shown in figure 1A.

(A) Treatment schema showing schedule of infusions, immune evaluations, and tumor evaluations and (B) Swimmer’s plot showing the TTP and OS for each of 32 patients. ATC, activated T cells; HER2, human epidermal growth receptor II; OS, overall survival; PET/CT, positron emission tomography/CT; TTP, time to progression.
Eligibility criteria: Eligible patients were ≥18 years with histologically proven HER2 negative BrCa as defined by a fluorescence in situ hybridization (FISH) ratio <2.2. Radiological/clinical evidence of metastases was required with noted progression after prior therapy. Patients were estrogen and/or progesterone receptor positive(ER/PR+) (HR+) or TNBC. Eligible patients had progressed after ≥1 line of hormonal and/or chemoT with Karnofsky ≥70% or Eastern Cooperative Oncology Group score of 0–1 and life expectancy ≥3 months.
Laboratory testing
Required initial laboratory data included: lymphocyte count is >500 mm3; granulocytes >1000/mm3; platelet count >50 x 109/L; hemoglobin 80 g/L; blood urea nitrogen <1.5 times normal; serum creatinine <1.8 mg/dL; creatinine clearance ≥60 mL/min (can be calculated using the Cockcroft & Gault equation); bilirubin <1.5 times normal; alanine aminotransferase, aspartate aminotransferase, and alkaline phosphatase <5 times upper normal; negative HIV, hepatitis B or hepatitis C infection serology; left ventricular ejection fraction ≥45% at rest (multiple-gated acquisition scan or echocardiogram and pulmonary function tests of forced expiratory volume in 1 s -forced expiratory volume in 1 s, diffusing capacity, and forced vital capacity ≥50% of predicted.
Evaluable disease
Measurable or evaluable metastatic disease documented by radiograph, computerized tomography (CT) scan, positron emission tomography (PET)/CT scan, magnetic resonance imaging (MRI), bone scan, or physical examination was required. Each patient was required to have at least one bi-dimensionally measurable lesion that had not been irradiated with at least one diameter being ≥10 mm for liver, lung, skin lesions, and ≥15 mm for lymph node metastases. Biopsy of recurrent site(s) was not required. Biopsy of accessible sites before and after HER2 BATs was an option.
Production of anti-CD3 × anti-HER2 BiAb
The heterconjugation of OKT3 (Miltenyi, Auburn, California, USA) with trastuzumab (Herceptin, Genentech) is well described.3 In brief, OKT3 was cross-linked with Traut’s reagent and trastuzumab was cross-linked with sulfosuccinimidyl-4-(N-maleimidomethyl)cyclohexane-1-carboxylate (Sulfo-SMCC). The two cross-linked mAbs were heteroconjugated overnight to produce anti-CD3 × anti-HER2 BiAb.3
Production of HER2 BATs
T cells from the aheresis product were activated with 20 ng/mL of OKT3 and expanded in 100 IU/mL of IL-2 for 12–14 days in Roswell Park Memorial Institute Medium (RPMI-1640 medium) containing 2% human serum without antibiotics in GE Bioreactors as described.5 Harvested ATC were armed with HER2Bi at a preoptimized concentration of 50 ng/106 ATC as described.5 Armed ATC were washed twice to remove unbound HER2Bi and cryopreserved in four aliquots. The HER2 BATs were tested for specific cytotoxicity, immune subsets, pathogens, mycoplasma, and endotoxin prior to release for clinical infusion.5
Phenotyping of products
The harvested ATC product and PBMC at multiple time points after BATs infusions from the patients were evaluated to assess changes in phenotype by staining for CD3+, CD4+, CD8+, CD25+, CD19+, CD20+, CD45RO+, CD45RA+, CD19+, CD20+, CD56+, CD127+, CD11b+, CD33+, and HLA-DR+ cells. Cryopreserved PBMC from the time of apheresis served as baseline controls.
Specific IFN-γ EliSpots
The number of specific cytotoxic T lymphocytes (CTL) was assessed with fresh PBMC from patients using SK-BR-3 (BrCa target) and K562 cells (natural killer (NK) cell target) as targets for IFN-γ Elispots to measure CD8-mediated memory CTL activity and CD4-mediated helper responses. IFN-γ EliSpots produced by PBMC were assessed after 18 hours of stimulation with SK-BR-3 or K562 as well as spontaneous IFN-γ EliSpots produced by PBMC at an effector to target ratio of 1:1 as previously described.6
Serum cytokines
Cytokines were measured in the serum at selected time points using a 25-plex human cytokine Luminex Array (Invitrogen, Carlsbad, California, USA) using Bio-Plex system (Bio-Rad Lab., Hercules, California, USA). The multiplex panel included IL-1β, IL-1 receptor antagonist (IL-1RA), IL-2, IL-2 receptor (IL-2R), IL-4, IL-5, IL-6, IL-7, IL-8, IL-13, IL-17, tumor necrosis factor (TNF-α), IFN-alpha (IFN-α), IFN-γ, GM-CSF, macrophage inhibitory protein (MIP-1α), MIP-1β, IFN-γ-induced protein-10 (IP-10), monokine induced by IFN-γ (MIG), Eotaxin, Regulated on Activation Normal T Cell Expressed and Secreted (RANTES) and monocyte chemotactic protein (MCP)-1. The limit of detection for these assays is <10 pg/mL. The cytokine levels were calculated from a standard curve.
Statistical analysis
The primary endpoint was to determine if infusions of HER2 BATs would increase the TTP beyond the estimated 2 months expected after 3 cycles of chemoT and to confirm the safety of HER2 BATS. SD (SD) and OS were measured from the first infusion. Published trials on chemoT alone reported a median TTP of around 1.6 months when calculated from completion of 3 cycles of chemoT without additional treatment. We estimated the median TTP would be roughly 2 months under traditional treatment (estimated 4-month TTP was 25%). We hypothesized that HER2 BATs treatment would improve the median TTP by 2 months (estimated 4-month TTP of 50%) using one-stage design test for a 4-month TTP ≤25% vs a 4-month TTP ≥50%. If ≥9 out of 26 patients had not progressed by the 4-month follow-up, we could declare that the treatment was effective on TTP. The secondary endpoint was OS among all patients which will be investigated from enrolment and from the first BATs infusion. The Kaplan-Meier (K-M) method was used to estimate TTP and OS. TTP and OS was examined among the chemoT-sensitive (ChemoS) and chemoT-resistant (ChemoR) groups. The secondary endpoints were to assess response rates. TTP and OS were measured from enrolment of the date of the first infusion. Descriptive statistics were used to evaluate immune monitoring using Prism (GraphPad, V.8.0). We used a paired t-test to compare their levels at pre-, mid- and post-infusion time points separated by their chemoT response status (ChemoS or ChemoR). We also applied Cox regression models to examine if chemoT response status, each biomarker level at prefirst infusion, or the change between preinfusion and postinfusion would be associated with TTP or OS. Biomarkers in ELISpot were log10-transformed in data analysis to improve their normality of distribution.
Results
Patient characteristics
Table 1 summarizes patient age, type of disease, status of disease after chemoT, total dose and number of HER2 BATs infusions, those with SD at 4 weeks after starting infusions, TTP, OS, tumor markers, and number of lines (L) of hormonal therapy, chemoT, radiation or antibodies. There were 32 evaluable HER2 negative patients who received therapy out 42 patients who were originally enrolled. Eight patients had TNBC and 24 patients had HER2-HR+MBC. The first five patients received a 1.0 g of Cy/m2 intravenously 7 days prior to the first HER2 BATs infusion. Since immune responses did not appear to be as robust as seen in the phase I study, Cy was stopped after the first five patients (#1–5). In an effort to increase endogenous immune responses, the last five patients were given IL-2 300 000 IU/m2 daily and GM-CSF 250 µg/m2 two times per week (#28 – #32).
Clinical tolerability
There were no severe treatment related toxicities. The HER2 BATs related grade 1–2 side effects were chills, hypotension, fever, hypertension, headaches, fatigue, nausea, and vomiting (online supplemental table S1). There were no irreversible grade 3 side effects that persist at grade 3 >72 hours.
Supplemental material
Clinical responses
There was one complete response (CR), 8 partial responses (PR) and 14 patients with SD after chemoT in 32 patients prior (table 1). Fifteen patients were SDor better at 4 weeks after the third BATs infusion. Nine patients who progressed during chemoT were able to receive some infusions of HER2 BATs. The lines (L) of therapy are summarized in table 1. Eight patients developed a PR response to chemoT and one patient (IT 20082) with progressive metastatic TNBC became stable after chemoT for 4.9 months with survival of 14.6 months. Interestingly, in the group of 8, 2 patients (IT 20073 and IT 20095) with TNBC who developed PRs to chemoT survived 12.4 and 12.2 months, respectively. Of note, the T cells from IT 20029 with chemosensitive disease who had received 9 lines of therapy expanded to a dose of 72.3×10⁹; IT 20029 was stable for 5.8 months and survived 17.4 months. On the other hand, T cells from IT 20085 with TNBC who had received 1 line of chemoT did not expand. Yet, the patient’s disease was stable for 4.9 months and the patient survived 42 months after receiving a dose of 10.7×10⁹ HER2 BATs.
Clinical information and results
TTP as endpoint
The primary goal of this study was to attain ≥9 of 26 (34.6%) patients stable or better at 4 months after the last infusion. Although we were not successful in achieving the primary goal, 9 of 32 (28.1%) evaluable patients were stable for >4 months after their last infusion. The nine patients who were stable at 4 months included 3 TNBC and 6 HER2-HR+ patients. One of the nine patients received a total of only 17×109 HER2 BATS. The mean TTP for all 32 patients was 2.7 months. The mean TTP was 1.4 months for the 8 TNBC patients and 2.5 months for the 24 HER2-HR+ patients (K-M curve not shown). The swimmer’s plot shows the TTP and OS for individual patients (figure 1B).
Effects of chemoT on OS
The median OS (with 95% CI) for all 32 patients, 8 TNBC patients, and 24 HER2-HR+patients is 13.1 (8.6–17.4), 12.3 (2.1–17.8), and 15.2 (8.6–19.8) months, respectively (figure 2A). For the chemoS group (n=25), the median OS was 14.6 (9.6–21.8) months, whereas the median OS for the chemoR (n=7) group was 8.6 (3.3–17.3) months (figure 2B and K–M, NS). In the HER2-, HR+ patients, the chemoS group had a median OS of 16.5 (9.1–24.2) months with a TTP 3.1 (1.4–4.2) months (figure 2C) whereas the patients in the chemoR group (n=8) had shorter median OS of 8.6 months with a TTP of 1.3 months.

Survival and time to progression. (A) Kaplan-Meier (K–M) survival curves show survival for all patients, HER2-/ER+/PR+ patients, and TNBC patients; (B) K-M survival curves show chemoS patient and chemoR patient; (C) K-M plots show survival for HER2 negative, ER+/PR+, chemoS HER2 negative and chemoR HER2 negative, HR+ patients; (D) the K-M curves show survival for chemoS TNBC, and chemoR TNBC with median os of 12.3 and 8.6 months, respectively; (E) K-M plot is show survival as a function of total doses of HER2 bats in quartiles: first (68–83 x 109), second (60–65 x 109), third (40–57 x 109), and fourth (11–38 x 109) of HER2 bats; (F) survival is shown for patients who received 2–3 infusions versus four infusions and (G) survival is shown for patients with SDor better versus PD. ChemoR, chemoT-resistant; ChemoS, chemoT-sensitive; ER+/PR+, estrogen and/or progesterone receptor positive; HER2, human epidermal growth receptor II; TNBC, triple negative breast cancer.
The TNBC patients with chemoS disease (n=6) had a median OS of 12.3 months and the two TNBC patients with chemoR disease had median OS of 10.6 months (figure 2D). The TTP for the chemoS TNBC patients was 3.2 months whereas the TTP for the chemoR TBNC patients was 1.7 months.
Effects of lines of chemoT
Table 1 summarizes total lines of therapy before the chemoT given as part of this protocol for all patients. Online supplemental table S3 provides the mean total lines of therapy prior to and after chemoT and the proportion of each group of patients who received 1, 2, 3, and ≥4 L. The mean L of chemoT for HR+, TNBC, and all patients at enrollment were 3.75, 2.38, and 3.4 L. After receiving the chemoT part of the protocol, the mean L of chemoT for HR+, TNBC, and all patients becomes 4.75, 3.28, and 4.4 L, respectively. The striking finding is that 50, 25, and 43.6% of the HR+, TNBC, and all patients were heavily pretreated with ≥4 L of chemoT.
Effects of cell dose or number of infusions on OS
The median OS for first (68–83 × 109), second (60–65 × 109), third (40–57 × 109), and fourth (11–38 × 109) cell dose level quartiles were 12.1, 17.2, 10, and 13.2 months, respectively, and were not significantly different (figure 2E). Although the median OS of 21.9 months appeared to be higher for patients who received four infusions than the median OS of 15 months for patients who received 2–3 infusions, it was not significant (figure 2F, p=0.11). Patients IT20085 and IT 20101 highlight how cell doses and tumor markers did not correlate with TTP or OS. IT20085 with TNBC disease, who received only 1 line of chemoTand a cell dose of 10.7×10⁹ HER2 BATs, had a TTP of 6.7 months and OS of 42.0 months. IT 20101 with HER2-HR+ disease, who received three lines of chemoTand four infusions totaling 83.1×10⁹ HER2 BATs, had a TTP of 6.7 months and OS of 55.0 months. The differences may be due to heterogeneity of different individual immune systems.
Effects of chemoT on TTP and OS
In order to address the question of whether four cycles or 4 months of chemoT prior to receiving HER2 BATs infusions affected the TTP and OS, TTP and OS were analyzed from the time of enrollment prior to chemoT. The median OS from the time of initiating chemo for all 32 patients, HER2-HR+patients, and TNBC patients were 17.0 (12.0–21.8), 19.0 (12.0–24.0), and 15.1 (5.9–221.3) months, respectively (online supplemental table S2). The median OS for the chemoS and chemoR groups were 18.8 (13.7–24.0) and 11.6 (5.9–21.3) months, respectively. The key caveat is that patients who progressed during their 4 cycles of chemoT were not included in the analysis. The median TTP from enrollment for all 32 patients, HER2-HR+patients, and TNBC patients were 6.2 (5.5–7.5), 2.9 (5.6–7.7), and 5.8 (4.0–8.2) months, respectively (online supplemental table S2). For the chemoS group (n=25), the median TTP from the time of enrollment was 6.4 (5.8–8.2) months, whereas the median TTP for the chemoR (n=7) group was 5.5 (3.8–6.4) months. In the HER2-, HR+ patients, the chemoS group (n=19) from the time of enrollment had a median TTP of 6.4 (5.8–9.1) months whereas the five patients in the chemoR group had shorter median OS of 5.6 months with a TTP of 2.6 months (online supplemental table S2).
A log-rank (Mantel-Cox) test was used to ask whether those who had SD, PR, or CR survived longer than those who had PD after 4 months or 4 cycles of chemoT, The differences (figure 2G) between those who were SDor better and those who had PDwas highly significant (p=0.029). These data show that those who were clinically stable after chemoT survived longer than those who had PDjust prior to IT.
TTP and OS in chemoS Patients
Cox regression models were used to determine if chemoT-response status was associated with TTP. The hazard rate for TTP in chemoS patients was 39% of that in chemoR patients, indicating that chemoS patients progressed significantly slower than chemoR patients (HR=0.39, p=0.042). For OS, the hazard rate in chemoS patients was 43% of that in chemoR patients, which indicated that chemoS patients had significantly better OS than those chemoR patients (HR=0.39, p=0.068).
Phenotyping and clinical status of disease
Immune phenotyping and CD4/CD8 ratios in PBMC obtained pre-IT, mid-IT, and post-IT are summarized for patients who were stable and patients who had progressed in online supplemental table S4. Online supplemental figure S1 shows CD4/CD8 ratios in patients with SD (n=9) vs patients who had PD (n=23) at study time points. Although there were no statistically significant differences between patients who had SD compared with patients with PD at any time point, the data suggest there was an increase in CD4/CD8 ratios in patients who had SD when compared with the CD4/CD8 ratios in those with PD at the post-IT time points from the pre-IT baseline. There were no statistical correlations observed between immune phenotypes and clinical responses except for the proportion of CD19 +B cells.
Supplemental material
Correlation of TTP and OS with proportion of CD19+ B cells at preinfusion and postinfusion
The proportion of CD19 +B cells was the only immune cell populations that was significantly associated with TTP or OS. The hazard rate increased 5% with one percent increase of CD19 +B cells at pre infusion #1 indicating that patients progress significantly faster if their CD19 +B cells were higher at pre infusion #1 (HR=1.05, p=0.029) compared with patients with lower CD19 +B cells at pre infusion #1
Correlation of TTP and OS with proportion of T subsets in the infused product
We examined whether there were any correlations between clinical responses and the proportion of T cell subsets (CD3, CD4, CD8, CD45RA, CD45RO, CD19, CD56, Tregs, MDSC) in HER2 BATs product or PBMC phenotypes at multiple time points during and after immunotherapy (IT). There were no correlations between T cell subsets in the ATC product or PBMC after HER2 BATs infusions and OS and TTP.
Tumor markers
Tumor markers decreased in 13 of 23 (56.5%) patients with evaluable tumor markers. In those patients whose tumor markers decreased, the 4 of 8 (50%) who were evaluable patients received four infusions each (total dose of 64.8–80 x 109 HER2 BATs). There was no correlation between the number of doses or the total amount of HER2 BATs received and tumors markers after IT. Ten of 23 (43.4%) patients had increases in their tumor markers.
Enhanced specific CTL and NK activity in PBMC after Infusions of HER2 BATs
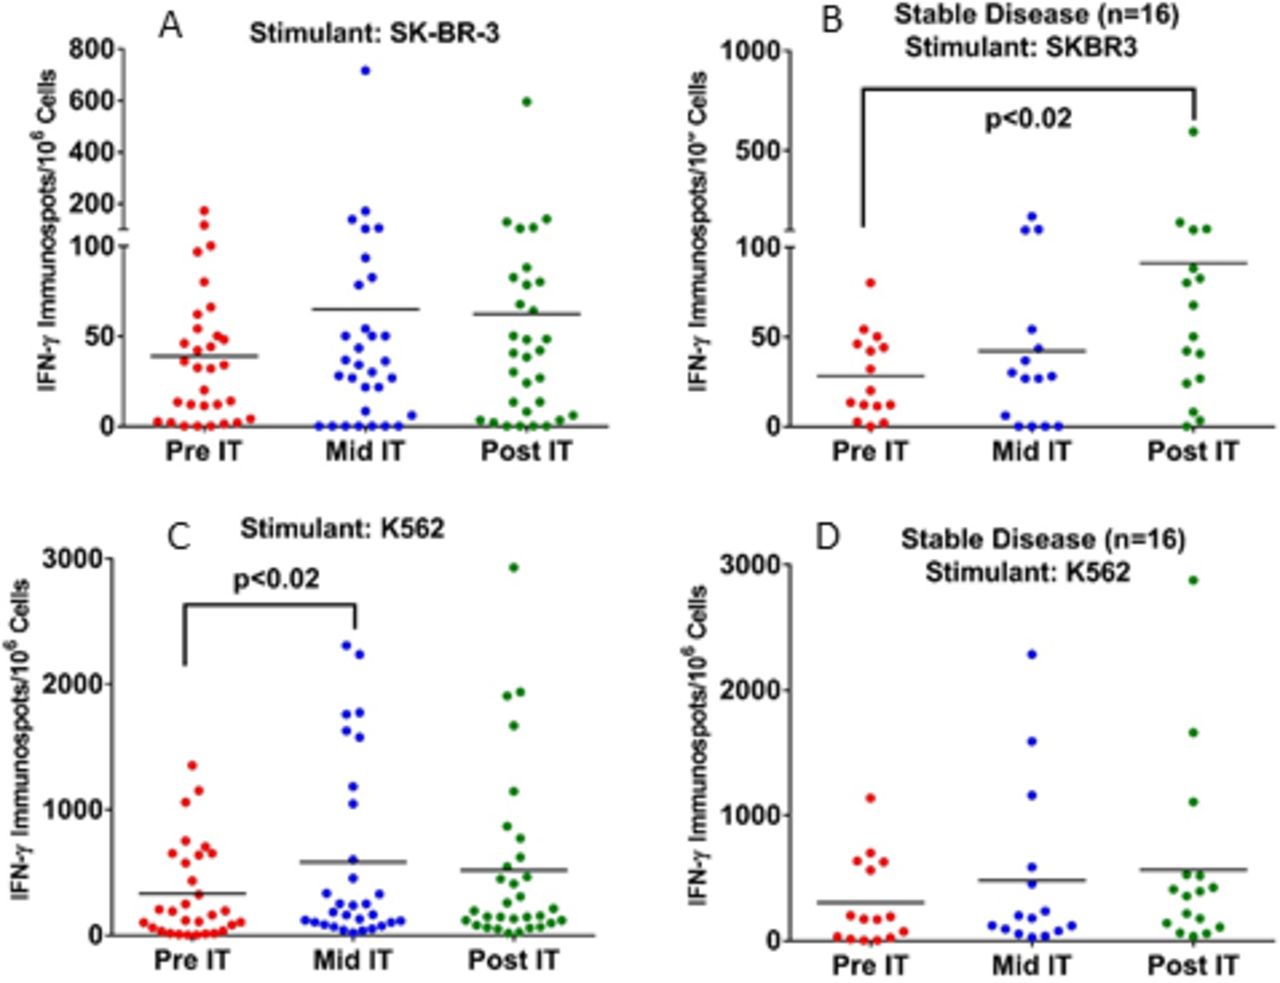
Fresh PBMC from 32 patients were tested for CTL activity by measuring the IFNγ ELISpots on exposure to SK-BR-3 or K562 at pretherapy (pre-IT), during therapy (mid-IT or preinfusion #3), and 1 month after treatment (post-IT). A significant increase (p<0.02) in the numbers of T cells in PBMC secreting IFNγ ELISpots in response to SK-BR-3 cells in PBMC from patients with SD at post-IT compared with pre-IT baseline (figure 3). There was also a significant increase (p<0.02) in innate immunity responses as seen in IFNγ ELISpots against NK specific K562 cells by PBMC from patients with SD at mid-IT compared with pre-IT baseline (figure 3, lower panel). These data clearly show immune responses directed at SK-BR-3 and K562 cells could be detected mid-IT or post-IT.

Panel A: Enhanced CTL activity by PBMC directed at SK-BR-3 and K562 mid-IT and post-IT. Panel B: Fresh PBMC show significantly higher T cell IFN-γ ELISpots directed at SK-BR-3 (p<0.02) in patients with SD (n=16) at post-IT time compared with pre-IT point. Panel C: PBMC from all patients (n=32) plated with NK targets K562 showed significantly enhanced CTL activity (p<0.02) at mid-IT compared with pre-IT time point. Panel D: PBMC from all patients plated with K562 did not increase IFN-γ ELISpots after IT. There were no differences observed for the cytotoxicity against SK-BR-3 or K562 cell by 51Cr release assay. IFN-γ, interferon gamma; NK, natural killer; PBMC, peripheral blood mononuclear cells.
The Th1/Th2 cytokine and chemokine responses
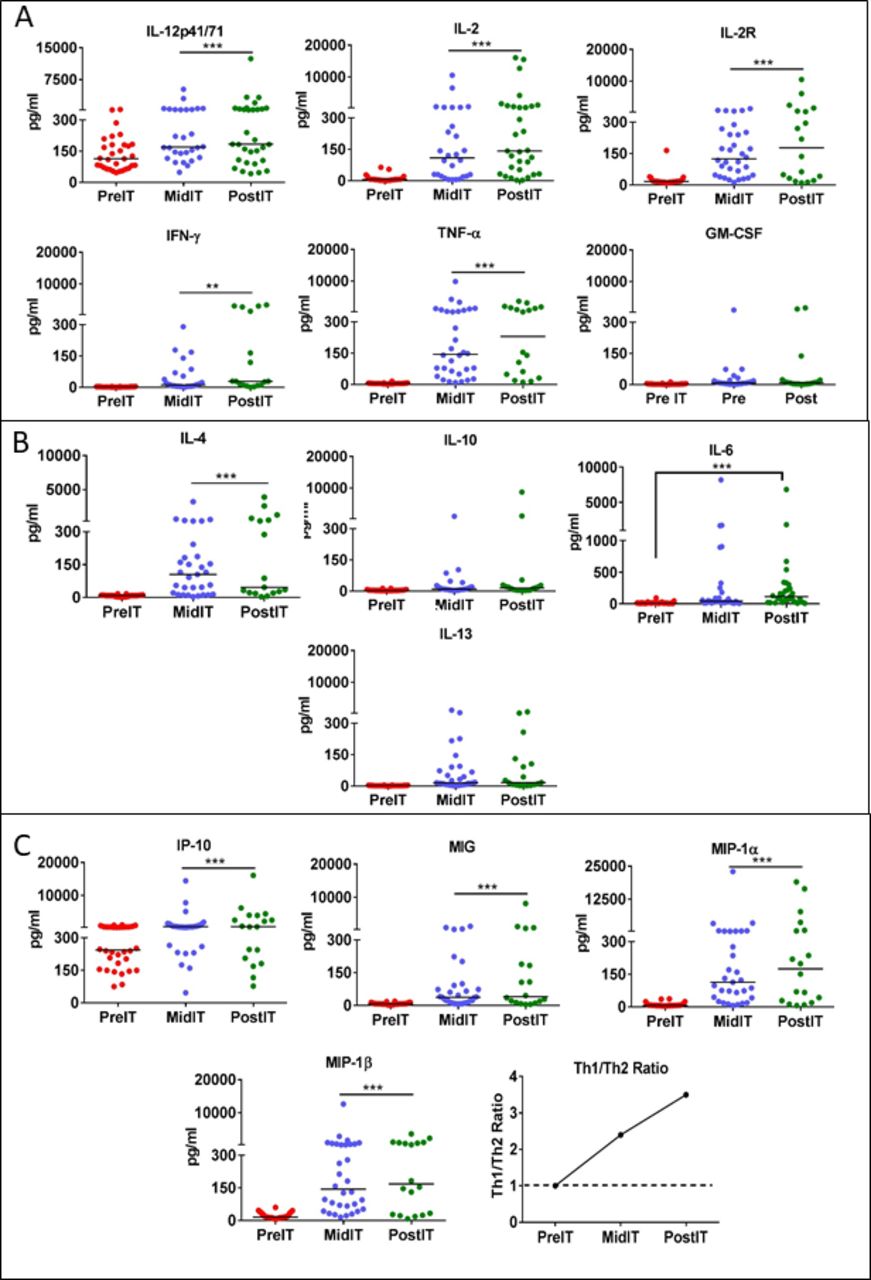
A panel of 25 cytokines and chemokines were tested in serum samples at pre-IT, mid-IT and post-IT from patients who received three or four HER2 BATs infusions. Online supplemental table S4 shows fold change for each cytokine or chemokine at pre-IT and post-IT, the fold change, and the p values. Th1 and Th2 cytokines (IL-2, IL-2r, IL-12, TNF-α, IFN-ɣ, GM-CSF, IL-6, IL-4, IL-10, IL-13), and chemokines (IP-10, MIG, MIP-1α, MIP-1β) using a multiplex array with the Luminex System (figure 4A–C). The fold changes were all highly significant for those listed in online supplemental table S5. The upper panel of figure 4A shows that Th1 cytokine levels IL-12, IL-2, IFN-γ, TNF-α and IL-2R increased significantly (p<0.0001 p<0.0005) at mid-IT and post-IT compared with pre-IT levels. The fold increases for Th1 cytokines IL-2, IL-2R, IL-12, TNF-α, IFN-ɣ, GM-CSF were 23.8, 1.6, 46.2, 14.5 times baseline, respectively. The fold increases for the chemokines IP-10, MIG, MIP-1α, and MIP-1β were 2.3, 5.7, 25.0, and 10.9 times baseline, respectively. Among the Th2 cytokines (figure 4B), IL-4, IL-6, IL-10, and IL-13 showed significantly increased levels at mid-IT and post-IT (p<0.0005) compared with pre-IT levels (figure 4B). IL-6 levels were significantly elevated at mid-IT and post-IT (p<0.001) without concomitant increases in clinical toxicities. Intriguingly, IFNγ induced chemokines IP-10 and MIG levels (figure 4C) increased significantly at mid-IT and post-IT along with T cell recruiting chemokines MIP-1α and MIP-1β (p<0.0001 and p<0.0003) compared with pre-IT levels. The mean = Th1[IL-2+IFNγ]/Th2 [IL-4+IL-10] ratio in the lower right of panel of figure 4, shows a Th1-type response induced as a function of HER2 BAT infusions, ratio increasing from 1 at pre-IT to 3.5 at post-IT. It should be noted that fold changes of serum cytokines/chemokines were greater than 10-fold for IL-2, TNF-α, IFN-ɣ, MIP-1α, and MIP-1β. These findings were consistent with increased specific IFN-γ production observed by ELISpot analysis of patient PBMC exposed to SK-BR-3 tumor cells at the post-IT time point. Together these immune data show that there is activation of a systemic endogenous immune effect induced by infusions of HER2 BATs. Other cytokines and chemokines including IL-1β, IL-1RA, IL-5, IL-7, IL-8, IL-17, Eotaxin, RANTES and MCP-1 did not increase or remained unchanged from pre-IT (data not shown).

Profile of serum cytokines and chemokines. Panel A: Analysis of sequential serum samples after HER2 bats infusions (IT) show significant increase in Th1 cytokine levels (IL-12, p<0.0004; IL-2, p<0.0001; IL-2R, p<0.0001; IFN-γ, p<0.0001 and TNF-α p<0.0001) at mid-IT and post-IT compared with pre-IT serum levels. Panel B: There was only one Th2 cytokine (IL-4) that showed significantly increased levels (p<0.0001) at mid-IT and post-IT compared with pre-IT levels. Panel C: Chemokines CXCL9 (mig, p<0.0001), CXCL10 (IP-10, p<0.0003), MIP-1α (p<0.0001) and MIP-1β (p<0.0001) increased at both mid-IT and post-IT compared with pre-IT levels.
Increased levels of IL-12 p70
IL-12p70, produced mainly by activated monocytes, is the principal cytokine for polarizing T cell responses toward Th1. Furthermore, IL-12 is known to enhance the cytotoxic functions of NK and CD8 +T cells. We observed an increase in serum levels of IL-12 at mid-IT and pos-tIT time points in patients with MBC (figure 4A). These data provide evidence that HER2 BATs infusions induce systemic Th1-type antitumor immunity that may activate monocytes during the process of T cell engagement of the tumor to produce IL-12.
Discussion
This study shows that immune consolidation with HER2 BATs after chemoT may improve clinical responses in patients who have failed multiple lines of therapy. Furthermore, infusions of HER2 BATs induced adaptive and innate immune responses in heavily pretreated HER2-HR+patients and TNBC patients. Historically, patients progress sooner after each subsequent line of therapy. Initial responses to hormonal and chemoT in patients with HER2- metastatic BrCa last between 8 and 14 months.7 8 In phase III trials of second and subsequent lines of chemoT for HER2-metastatic disease, the median TTP ranged from 3 to 6.3 months.1 7 9–11
By the time of the first infusion after chemoT, the mean number of lines of chemoT was 4.4 L of therapy for the entire study population. Given this prospective, the median OS for the entire group of 13.8 months is noteworthy. The median OS for the HR +patients who had received a mean of 4.75 L of therapy and TNBC patients who had received a mean of 3.28 L of therapy were 16.5 and 12.3 months, respectively. There are only a few study comparators for OS for HR+, HER2-MBC and mTNBC for 2L+failures of chemoT. The OS for HER2-patients is usually reported as HER2- MBC together with mTNBC after they have received 2L+was 12.6 months.12 In study 301, the eribulin phase 3 group MBC/mTNBC had a median OS of 15.1 months after 2 L.2 Perez et al reported a median OS of 8.8 months in the MBC/mTNBC population after 3 L13 and Isakoff et al reported a median OS of 11.0 months after 1–2 L in the MBC/mTBNC patients.14
For the eight patients with metastatic TNBC who received a mean of 2.4 L (range of 1–6 L), the median OS was 12.4 months with a TTP of 3.2 months after receiving a mean of 3.4 L. Only a few studies report TNBC patients. O'Shaughnessy et al reported a median OS of 8.1 months for 109 patients with mTBNC after 2–3 L15 and Li et al reported a median OS of 16.5 months for five patients with mTNBC patients after 2–3 L.16
We also analyzed TTP and OS from the initiation of chemoT. The median OS from starting chemoT for all patients, HER2-HR+, and TNBC were 17.0, 19.0, and 15.1 months, respectively. The medians for OS for time from initiating chemoT were not different from the medians for OS for time from first infusion.
The decreased in the median OS of 27 months from the first infusion seen in the HER2-group in our earlier phase I clinical trial5 to a median OS of 15.2 months in this trial may be due to the additional lines of chemoT and/or investigator selection bias. The additional chemoT may impair immune responses that were already damaged by chemoT. However, eliminating Cy depletion or addition of IL-2 and GM-CSF did not improve immune responses in those who did not receive Cy depletion or the combination of IL-2 and GM-CSF.
Immune responses to SK-BR-3 BrCa line and K562 (NK target) were significantly increased above pretreatment baseline at the mid-IT after starting HER2 BATs infusions. There were no obvious differences in immune responses between patients who received Cy or patients who received IL-2 and GM-CSF from patients who did not receive either Cy or IL-2/GM-CSF, although the numbers were too small to see differences. Serum Th1 and Th2 cytokines significantly increased from baseline to levels seen at mid-IT and post-IT when compared with pre-IT levels. The Th2 cytokines IL-4 and IL-6 increased significantly. Although levels of IL-10 and IL-13 increased in some patients, the difference was not statistically significant. The IP-10 (CXCL10), MIP-1α, MIG, and IL-12 were significantly elevated with IT with the Th1/Th2 ratio increasing from 1.0 pre-IT to 3.5 post-IT. These immune correlates show that 3–4 infusions of 11–83 x 109 are able to induce immune responses. Three infusions of HER2 BATs followed by a boost induced endogenous cellular immune responses similar to those seen in the phase I.5 Infusions of HER2 BATs in the phase I clinical trial involving 23 patients were safe, induced CTL and antibodies directed at BrCa antigens, a Th1 cytokine pattern, and a median OS of 27 months for the HER2 negative patients.5 There was no chemoT given between apheresis and the first HER2 BATs infusion. The rationale for making immune space for HER2 BATs to expand after infusion was part of the original rationale. To our surprise, despite the extensive amount chemoT, the immune systems of patients made detectable anti-tumor responses. It should be noted that the patients with a HER2- tumors in the phase I received mild or no bridging chemoT.5
In subsequent proof-of-concept study involving five of the phase I MBC patients, ‘immune T cells’ were obtained by a second apheresis after HER2 BATs infusions were expanded to produce immune ATC that were infused after autologous stem cell transplant (SCT). Immune testing within 1 month after SCT showed accelerated and enhanced reconstitution of specific anti-BrCa cellular and humoral responses to different epitopes of cancer antigens and different tumor associated antigens. Together, the immune data from the phase I study using booster infusions of immune ATC after SCT show that specific immunity develops and can be transfer after SCT.6 A follow-up question is whether ATC alone without infusion of BiAb can provide an antitumor effect. Multiple infusions of ATC were given to 23 women with stage IIIb/IV BrCa after autologous SCT in an early phase I study.17 OS and PFS at 32 months were 70% and 50%, respectively; whereas the OS and PFS in the historical group of 22 autologous SCT without ATC at 32 months was 50% and 10%, respectively. The study suggested that ATC alone can provide anti-tumor activity and the arming of ATC enhances anti-tumor activity above that seen for ATC alone.
In summary, HER2 BATs is a promising immunotherapeutic in patients with HER2 negative, HR+ or TNBC MBC. The correlative studies show that 3–4 infusions of HER2 BATs could induce endogenous adaptive and innate immune responses. This study suggests those with chemoS disease would benefit the most from IT and patients who are stable or better at the time of enrolment may have improved OS. Our study shows that those with SD, PR, or CR survived longer than those with PD. The K-M curve (figure 2G) shows significant difference between patients with stable or better disease and those with PD (p=0.029) and the hazard rate in chemoS patients was 43% of that in chemoR patients showing that chemoS patients had a significantly better OS than chemoR patients (HR=0.39, p=0.068). The chemoS effect was apparent in the HR+ group with median OS for chemoS and chemoR disease of 16.5 and 8.6 months, respectively. These results suggest that the ten patients who did not receive HER2 BATs due to PD may have benefited going directly to IT. Our ongoing trials in MBC and hormone refractory prostate cancer using HER2 BATs in combination with checkpoint inhibitors without additional chemoT suggest that their immune systems may be providing antitumor effects. The design of upcoming trials using HER2 BATs with checkpoint inhibitors or other immune modulators may lead to further improvements in T cell-based IT.
Data availability statement
All data relevant to the study are included in the article or uploaded as online supplemental information. The data are deidentified participant data in the ONCOR data base in the Clinical Trials Office at Karmanos Cancer Institute and in a secure access database in LGL’s laboratory at the University of Virginia.
Ethics statements
Ethics approval
The clinical protocol #2009–085 (NCT 01022138) was approved by the KCI protocol review committee, the Human Investigational Committee at WSU, and the FDA.
Acknowledgments
We acknowledge the patients with metastatic breast cancer who were willing to participate in this trial. We thank the nurse clinical coordinators Karen Meyers in serving the IT patients, the cGMP manufacturing and immune evaluation staff, and the outpatient infusion nurses in the Dresner Clinic at Karmanos Cancer Institute for their dedication to patient care for their efforts in bringing the therapy to the patients.
References
Supplementary materials
Supplementary Data
This web only file has been produced by the BMJ Publishing Group from an electronic file supplied by the author(s) and has not been edited for content.
Footnotes
Presented at The data presented in this manuscript are original and have not been published elsewhere except in the form of abstracts and poster presentations at symposia and meetings.
Contributors LGL and AT wrote the manuscript. LGL carried out the preclinical studies; LGL, ZA, and QL designed the protocol. AT managed the immune evaluation studies and analyzed the immune evaluation data. AD, LF and MS managed the patients; AT, VK, DS, and ET manufactured the cell product. QL performed the biostats analyses. PS, KF, KM,and MG coordinated care.
Funding LGL and AT were supported in part by funding from DHHS R01 CA 092344, R01 CA 140314, R01 CA 182526, and P30CA022453 (Cytometry Core) at KCI, P30CA044579 and P30CA044579 Cytometry Core at UVA, Susan G. Komen Foundation, and General Motor Company.
Competing interests LGL is cofounder of Transtarget and AT is cofounder of Nova Immune Platform. ZA, AD, LF, MS, VK, DS, PS, KF, MG, and QL have no conflicts of interest.
Provenance and peer review Not commissioned; externally peer reviewed.
Supplemental material This content has been supplied by the author(s). It has not been vetted by BMJ Publishing Group Limited (BMJ) and may not have been peer-reviewed. Any opinions or recommendations discussed are solely those of the author(s) and are not endorsed by BMJ. BMJ disclaims all liability and responsibility arising from any reliance placed on the content. Where the content includes any translated material, BMJ does not warrant the accuracy and reliability of the translations (including but not limited to local regulations, clinical guidelines, terminology, drug names and drug dosages), and is not responsible for any error and/or omissions arising from translation and adaptation or otherwise.