Article Text

Abstract
Background Nivolumab is an immune checkpoint inhibitor targeting the programmed death-1 receptor that improves survival in a subset of patients with clear cell renal cell carcinoma (ccRCC). In contrast to other tumor types that respond to immunotherapy, factors such as programmed death ligand-1 (PD-L1) status and tumor mutational burden show limited predictive utility in ccRCC. To address this gap, we report here the first molecular characterization of nivolumab response using paired index lesions, before and during treatment of metastatic ccRCC.
Methods We analyzed gene expression and T-cell receptor (TCR) clonality using lesion-paired biopsies provided in the CheckMate 009 trial and integrated the results with their PD-L1/CD4/CD8 status, genomic mutation status and serum cytokine assays. Statistical tests included linear mixed models, logistic regression models, Fisher’s exact test, and Kruskal-Wallis rank-sum test.
Results We identified transcripts related to response, both at baseline and on therapy, including several that are amenable to peripheral bioassays or to therapeutic intervention. At both timepoints, response was positively associated with T-cell infiltration but not associated with TCR clonality, and some non-Responders were highly infiltrated. Lower baseline T-cell infiltration correlated with elevated transcription of Wnt/β-catenin signaling components and hypoxia-regulated genes, including the Treg chemoattractant CCL28. On treatment, analysis of the non-responding patients whose tumors were highly T-cell infiltrated suggests association of the RIG-I-MDA5 pathway in their nivolumab resistance. We also analyzed our data using previous transcriptional classifications of ccRCC and found they concordantly identified a molecular subtype that has enhanced nivolumab response but is sunitinib-resistant.
Conclusion Our study describes molecular characteristics of response and resistance to nivolumab in patients with metastatic ccRCC, potentially impacting patient selection and first-line treatment decisions.
Trial registration number NCT01358721.
- immunotherapy
- tumor biomarkers
- gene expression profiling
- kidney neoplasms
- t-lymphocytes
This is an open access article distributed in accordance with the Creative Commons Attribution Non Commercial (CC BY-NC 4.0) license, which permits others to distribute, remix, adapt, build upon this work non-commercially, and license their derivative works on different terms, provided the original work is properly cited, appropriate credit is given, any changes made indicated, and the use is non-commercial. See http://creativecommons.org/licenses/by-nc/4.0/.
Statistics from Altmetric.com
Background
Renal cell carcinoma (RCC) provided some of the earliest proof of concept for immunotherapy. The first approved treatment for advanced disease was high-dose interleukin (IL)-2, which gave durable, complete responses in a subset of patients.1 Immune checkpoint inhibitor (CPI) therapy was approved for advanced RCC in 2015, following melanoma and non-small cell lung cancer (NSCLC) as the third approved indication for CPI.
Pan-tumor analyses reveal that RCC patient tumors are almost exclusively of the ‘inflammatory’ subtype, with an immune homogeneity unusual among cancers.2 Genomic analyses have also highlighted the oncogenic role of the von Hippel-Lindau (VHL) tumor suppressor/hypoxia inducible factor (HIF) pathway, chromatin remodeling/histone methylation, and phosphatidylinositol 3-kinase/AKT serine/threonine kinase.3 Reflecting this biology, the currently approved first-line (1 L) therapies4 include tyrosine kinase inhibitors (TKIs) that target hypoxic vascularization (sunitinib, pazopanib and cabozantinib), the CPI combination nivolumab plus ipilimumab, and more recently, the CPI/TKI combinations of pembrolizumab or avelumab with axitinib. Further options include nivolumab monotherapy, sorafenib, bevacizumab/interferon (IFN)-α, and the mammalian target of rapamycin (mTOR) inhibitors temsirolimus and everolimus as second line.
Although the approval of these treatments has provided targeted and immunotherapeutic options for patients and care providers, there are no clinically implemented biomarkers allowing rational selection, combination, or sequencing of therapies. For the TKIs, expression signatures reflective of hypoxia and angiogenesis may be relevant.5–7 For the CPIs, factors such as tumor mutational burden, programmed death ligand-1 (PD-L1) immunohistochemistry (IHC), and inflammation status seem less informative in RCC than in melanoma or NSCLC.8 Current treatment decisions depend primarily on clinical criteria, which show limited relationship to molecular subtypes of RCC.9 Several studies have explored pretreatment transcriptional markers for CPI response,5 10 11 but further delineation of the molecular characteristics underlying the distinct responses to TKI and CPI is clearly warranted.
In CheckMate 009, patients with advanced clear cell renal cell carcinoma (ccRCC) were treated with nivolumab. Our previous examination of their paired baseline and on-treatment biopsies demonstrated increased immune infiltration in all patients as a pharmacodynamic effect of treatment.12 Here we define additional characteristics underlying therapeutic response. Our findings could inform the scientific rationale for selecting primary therapy or future combinations to address resistance.
Methods
Study design
CheckMate 009 was an open-label, parallel, four-group, phase Ib study of nivolumab (Bristol Myers Squibb and Ono Pharmaceutical Company). Study design, methods, and baseline clinical and demographic features have been previously described.12
Response metrics
Best overall response was determined by Response Evaluation Criteria in Solid Tumors (RECIST) V.1.1. Tumor burden change (maximum reduction or minimum increase in index lesions) calculated by standard methods was available for 83 patients at study conclusion (figure 1A and online supplemental figure S1). Biopsy change was calculated by the same method using only the biopsied index lesion. Tumor burden reduction of ≥20% was chosen as a Response metric that would exceed measurement error.13 Two patients (identified as patients 12 and 29) had tumor burden reduction of <20% at interim analysis and were included as non-Responders. One patient (identified as patient 98) was categorized as non-Responder despite a tumor burden reduction of 48% because the assessment was suspect (online supplemental figure S2), and they had progressive disease by RECIST. Patients 12, 29 and 98 were placed to the left in waterfall plots (figure 1A and online supplemental figure S1).
Supplemental material
Biological analyses
Fresh biopsies from metastatic lesions at baseline and cycle 2 day 8 (study day 28) were used to evaluate tumor-associated lymphocytes, PD-L1 status, somatic genome sequence, T-cell clonality, and gene expression. IHC was used to assess tumor-associated lymphocytes (Mosaic Laboratories, Lake Forest, California, USA) and PD-L1 expression on the tumor cell surface (Dako PD-L1 IHC 28-8 pharmDx), as described previously.12 RNA was labeled by WT-Pico Ovation (NuGEN, San Carlos, California, USA) and profiled using the HG-U219 array on the GeneTitan platform (Affymetrix, Santa Clara, California, USA). Robust multiarray average expression values were determined for 18,562 loci (BrainArray V.10). Whole-exome sequencing was previously described14; data were reprocessed (Seven Bridges, Charlestown, Massachusetts, USA). Serum IL-18 was assessed in a multiplex panel (Myriad RBM, Austin, Texas, USA). T-cell receptor (TCR) sequencing used immunoSEQ assay (Adaptive Biotechnologies, Seattle, Washington, USA) at the survey level. Comparisons of productive TCR clonality used Student’s t-test.
Differential gene expression analysis
Data were evaluable for 69 of the 83 patients with Response information: 15 Responders (n=13 at baseline, 11 at day 28, 9 matched) and 54 non-Responders (n=43 at baseline, 44 at day 28, 33 matched). Analyses of the relationship between gene expression and Response used an extended linear model,15 with fixed effects of Response, day, batch, and sex as categorical variables, and interaction between Response and day. Within-patient correlations were modeled by a spatial exponential structure with Euclidean distance. A multicontrast conditional F test was used to first select genes with p<0.05 for the null hypothesis that all Response-related fixed-effect parameters were zero. Differential expression between Response groups (baseline or day 28) was defined as p<0.01 for the contrast, with >1.25-fold difference in estimated means. Differential change on treatment associated with Response status was defined as p<0.01 for the Response–day interaction, with >1.25-fold change over time in non-Responders (two genes: Alcohol Dehydrogenase 1B (ADH1B) and Neuron-Derived Neurotrophic Factor (NDNF)) or in Responders (189 genes including NDNF). Q values (expected proportion of false positives incurred at a given p value) also were estimated. Analyses of the relationship of gene expression to CD3TCR score used limma (Bioconductor V.3.816); logFC here represents log2 fold change per unit of the CD3TCR score.
Gene set enrichment analysis (GSEA)
Enrichment in the subset of genes passing criteria for association with Response was evaluated as described by Tilford and Siemers.17 For GSEA, results for all 18,562 genes were ranked by [direction of effect * -log10(p value)] (Response analysis), or t-statistic (limma analyses), then evaluated with the ‘GSEA’ algorithm (Bioconductor V.3.818). ‘Hallmark’ and curated gene sets were from MSigDb.18 19
Statistical analysis of molecular classifiers
Gene set scores were calculated as the median value of z-score expression level for the constituent transcripts (online supplemental table S1). The ‘ccrcc-like’ subtype was assigned by WARD.D2 hierarchical clustering of baseline expression data for 63 available transcripts (from the 70-gene panel,6 online supplemental table S1). This method correctly identified ccrcc types when applied to the original data (ArrayExpress ID E-MTAB-3267). Association of discrete factors with Response was evaluated using Fisher’s exact test. Odds ratios (ORs) for Response were estimated from logistic regression models. The association of discrete factors with CD3TCR score was evaluated using the Kruskal-Wallis rank-sum test.
Supplemental material
Data and code availability
Gene expression data are in ArrayExpress (E-MTAB-3218). Analyses performed in R V.3.5.3. are available online (github.com/rossmacp/CM9_response).
Results
Categorization of Response using tumor shrinkage
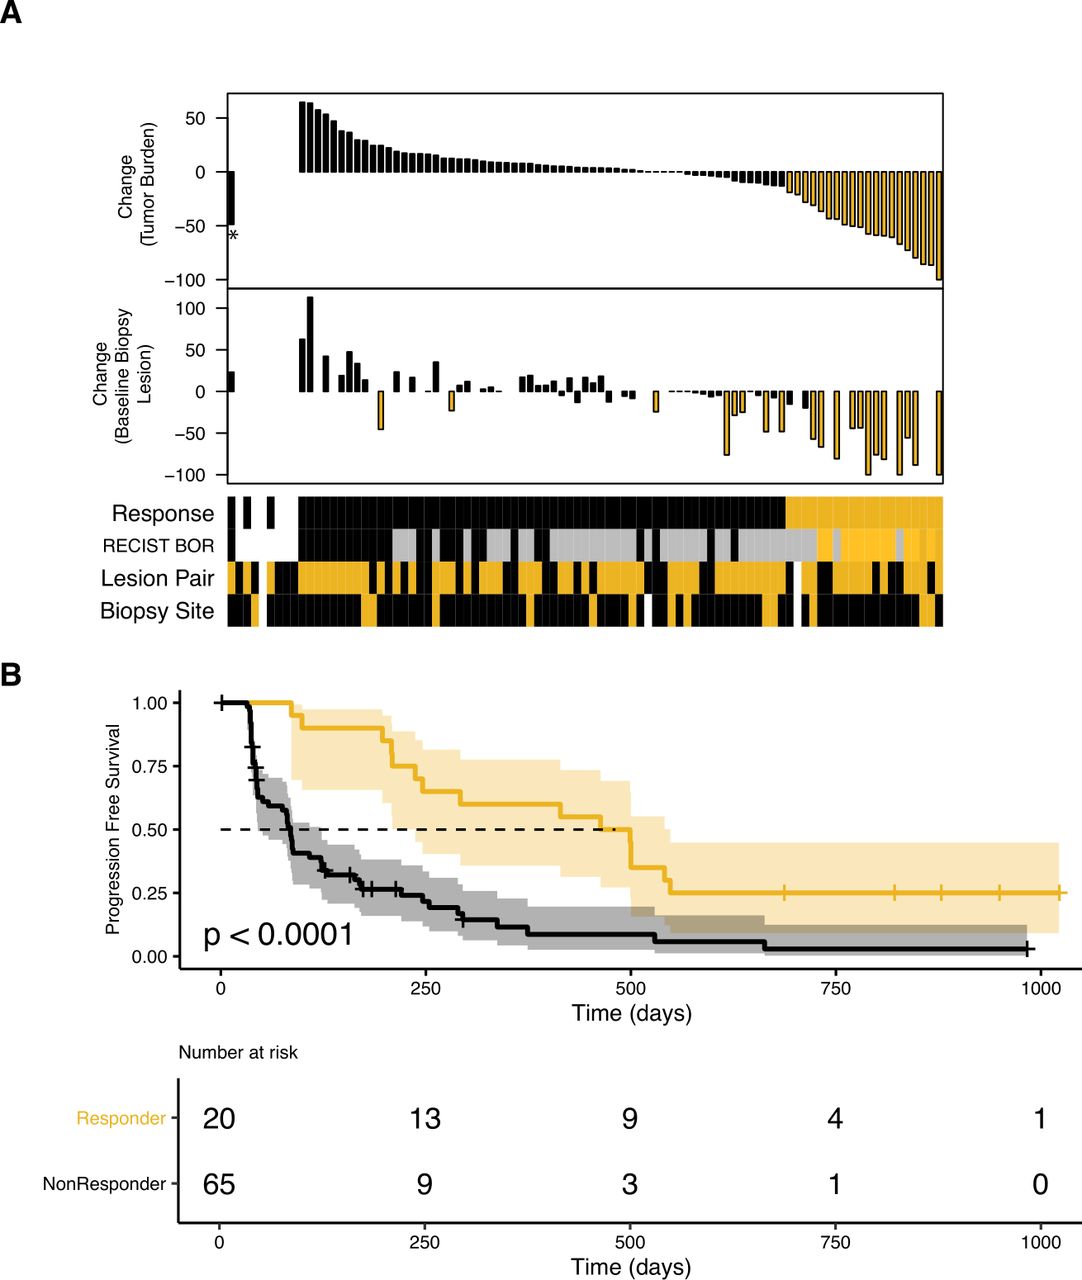
In this analysis, Responders were defined as patients who experienced tumor burden reduction of ≥20%13 (figure 1A, online supplemental figure S1 and table S2) to account for the very different clinical expectations for TKI-pretreated and 1 L patients. This Response categorization was associated with progression-free survival but not overall survival (OS) (figure 1B and online supplemental figure S3) and produced a Responder group similar to an alternative categorization used by Miao et al for CheckMate 00914 (online supplemental figure S4).
Where possible, the baseline and day 28 tumor biopsies were taken from the same site, preferably an index lesion. Hence, the change in size of the lesion that provided the data herein was also evaluable for most patients (n=63 for baseline biopsy lesion, n=59 for day 28 biopsy lesion; online supplemental table S2). The biopsy change agrees with tumor burden change in most but not all cases (figure 1A and online supplemental figure S5), and its relationship to molecular correlates of patient Response is shown in the following analyses.
Association of gene expression with Response
Differential expression between Response groups was identified at baseline and at day 28 (figures 2 and 3), and transcripts exhibiting change from baseline that differed between Response groups were also identified (figure 4). To interrogate the contribution of immune infiltration, we used 1539 genes previously assigned to immune cell lineages (immune response in silico (‘IRIS’) genes20).

Patient annotation and Response criterion. (A) Upper waterfall plot shows maximal percentage tumor burden reduction, available for 83 of the 91 treated patients. Reduction of ≥20% is indicated in gold. Lower waterfall plot shows maximal percentage reduction of the lesion that provided the baseline biopsy (index lesions, n=63). Reduction of ≥20% is indicated in gold. Sample annotation track shows ‘Response’ (Responders in gold), ‘RECIST BOR’ (CR and PR in dark gold/gold, SD in gray, PD in black), ‘Lesion Pair’, (baseline and day 28 biopsies from the same lesion in gold, n=59) and ‘Biopsy Site’ (lymph node metastatic site in gold). White indicates ‘no information’. *Patient 98. (B) Probability of progression-free survival stratified by Response status, estimated by the Kaplan-Meier method, for the 85 patients included in these analyses. BOR, best overall response; CR, complete response; PD, progressive disease; PR, partial response; RECIST, Response Evaluation Criteria in Solid Tumors; SD, stable disease.
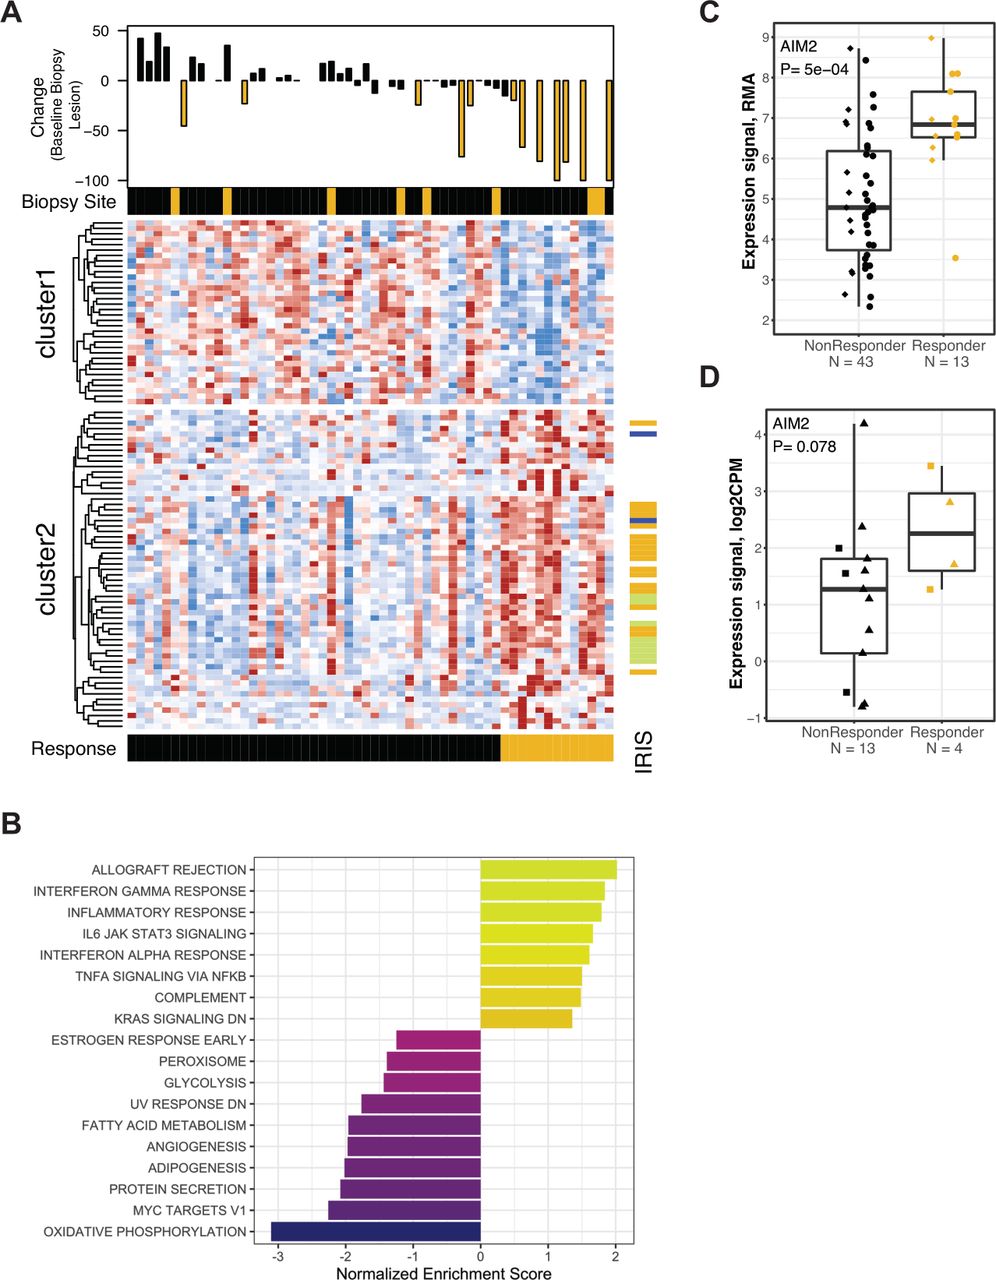
Differential gene expression between Response groups at baseline. (A) Heat map panel shows z-score expression data for 93 genes meeting p<0.01 and 1.5-fold expression difference at baseline between Responders and non-Responders (n=59). Scale is −2 to 2 (blue to red). Waterfall plot shows maximal percentage reduction of the lesion that provided the expression data shown in the heat map (index lesions, n=42). Lesions with reduction of ≥20% are indicated in gold. Sample annotation track shows ‘Biopsy Site’ (lymph node metastatic site in gold). Patient annotation track shows ‘Response’ (Responders in gold). Gene annotation track to the right of the heat map shows ‘IRIS’ immune-cell transcripts (lymphoid lineage in green, myeloid lineage in blue, expression in both lineages in gold). (B) Normalized enrichment scores for GSEA evaluating Hallmark gene sets in the results for differential gene expression analysis at baseline. (C) Expression values for the AIM2 transcript in 56 baseline biopsies. Data are grouped by Response categorization. Prior TKI therapy is indicated by circles, Naïve by diamonds. The p value was obtained by testing the appropriate contrasts from the extended linear model. (D) Expression values for the AIM2 transcript in RNA-seq data (TMM-normalized CPM values) from 17 pretreatment FFPE biopsies provided from metastatic lesions in the CheckMate 025 trial. Data are grouped by objective Response status (CR/PR by RECIST vs other). Samples collected within 3 years prior to initiation of nivolumab therapy are indicated with triangles. AIM2, absent in melanoma 2; CPM, counts per million; CR, complete response; FFPE, formalin-fixed paraffin-embedded; GSEA, gene set enrichment analysis; IL, interleukin; IRIS, immune response in silico; PR, partial response; RECIST, Response Evaluation Criteria in Solid Tumors; RMA, robust multiarray average; TMM, trimmed mean of M-values; TKI, tyrosine kinase inhibitor.

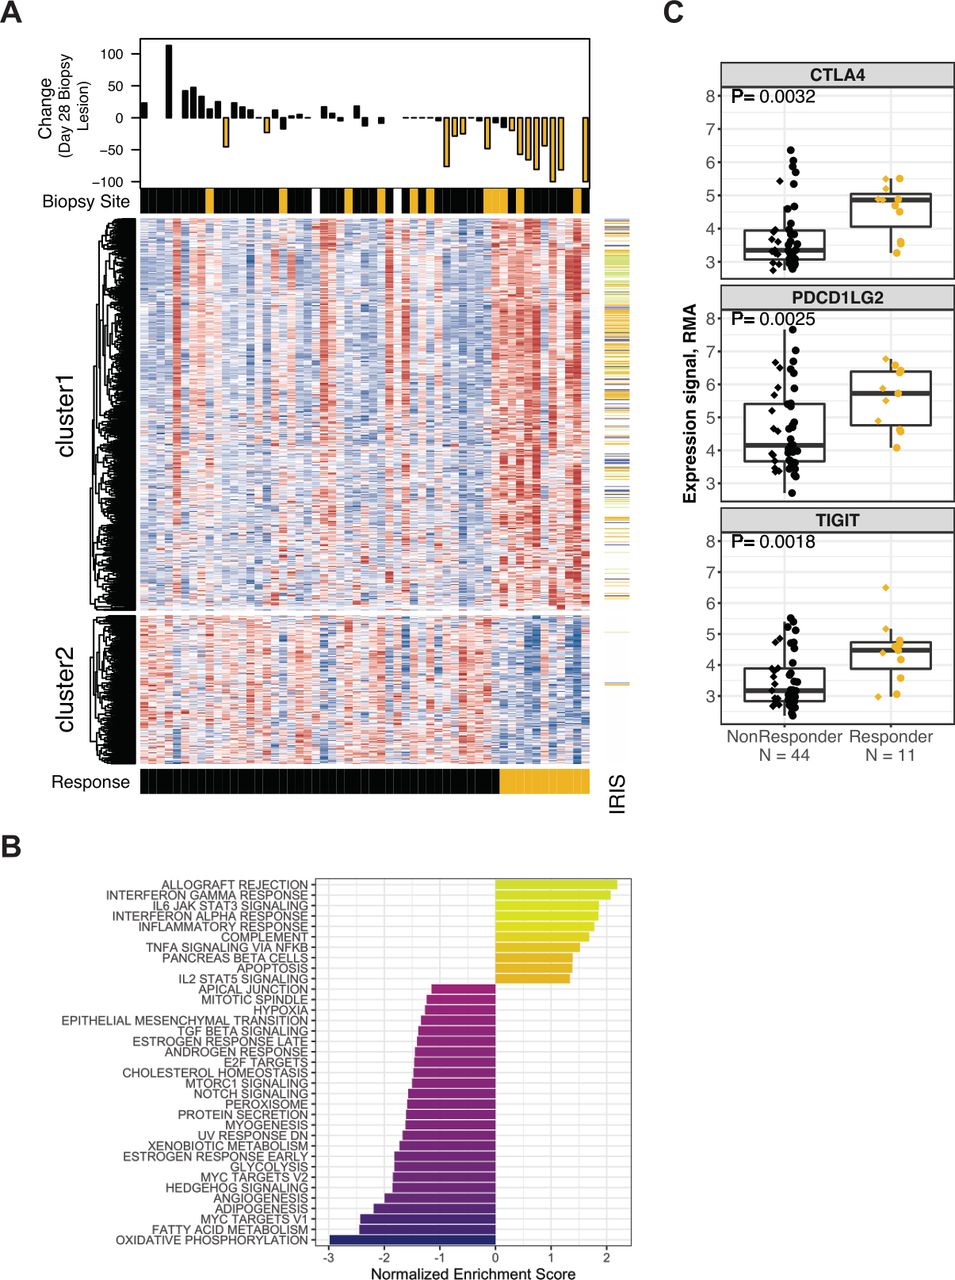
Differential gene expression between Response groups at day 28. (A) Heat map panel shows z-score expression data for 779 genes meeting p<0.01 and 1.25-fold expression difference at day 28 between Responders and non-Responders (n=55). Scale is −2 to 2 (blue to red). Waterfall plot shows maximal percentage reduction of the lesion that provided the expression data shown in the heat map (index lesions, n=45). Lesions with reduction of ≥20% are indicated in gold. Sample annotation track shows ‘Biopsy Site’ (lymph node metastatic site in gold, missing data in white). Patient annotation track shows ‘Response’ (Responders in gold). Gene annotation track to right of the heat map shows ‘IRIS’ immune-cell transcripts (lymphoid lineage in green, myeloid lineage in blue, expression in both lineages in gold). (B) Normalized enrichment scores for GSEA evaluating Hallmark gene sets in the results for differential gene expression analysis at day 28. (C) Expression values for the CTLA4, PDCD1LG2 (PDL-2) and TIGIT transcripts in 55 biopsies provided at day 28. Data are grouped by Response status. Prior TKI therapy is indicated by circles, Naïve by diamonds. P values were obtained by testing the appropriate contrast from the extended linear model. GSEA, gene set enrichment analysis; IRIS, immune response in silico; RMA, robust multiarray average; TIGIT, T cell immunoreceptor with Ig and ITIM domains; TKI, tyrosine kinase inhibitor.

Differential change from baseline expression associated with Response. (A) Heat map panel shows the fold change for 189 genes with an expression change from baseline that differed between Response groups and was >1.25-fold in the Responder group (n=42 patients). Scale is −2-fold to +2-fold (blue to red). Waterfall plot shows maximal percentage reduction of the lesion that provided the expression data (n=29 matched index lesions). Lesions with reduction of ≥20% are indicated in gold. Sample annotation tracks show ‘Response’ (Responders in gold) and ‘Matched Lesion’ (baseline and day 28 biopsies from the same lesion in gold, n=33). Gene annotation track to the right of the heat map shows ‘IRIS’ immune-cell transcripts (lymphoid lineage in green, myeloid lineage in blue, expression in both lineages in gold). (B) Normalized enrichment score for GSEA evaluating Hallmark gene sets in the results for differential gene expression analyses of change on treatment in Responders. (C) RMA-normalized expression values for the IL-18 transcript in biopsies provided at baseline (n=56) and day 28 of nivolumab therapy (n=55). Data are grouped by Response status. Prior TKI therapy is indicated by circles, Naïve by diamonds. P values from Student’s t-test. (D) Serum levels (pg/mL) for the IL-18 protein in 84 patients who provided samples at baseline and day 21 of nivolumab treatment. Data are grouped by Response status. Prior TKI therapy is indicated by circles, Naïve by diamonds. P values from Student’s t-test. GSEA, gene set enrichment analysis; IL, interleukin; IRIS, immune response in silico; RMA, robust multiarray average; TKI, tyrosine kinase inhibitor.
Differential expression between Response groups at baseline
At baseline, 311 genes were found to be differentially expressed (203 higher in Responders, and 108 lower, q<16%; online supplemental table S3) with 93 genes having >1.5-fold mean expression difference between Response groups (figure 2A and online supplemental figure S6A). The IRIS immune-cell transcripts were significantly over-represented (46/311, p<10−5) and were almost exclusively expressed at higher mean levels in Responders. These IRIS transcripts included representatives of myeloid (six including IL-1A) and lymphoid (10 including CD3E, GZMB) lineages, suggesting a pre-existing immunologically active tumor environment in Responders. Only three IRIS transcripts were expressed at higher levels in non-Responders, with no indication of an immunosuppressive population. Evaluation of the 311 baseline differentially expressed genes using clinical CPI datasets revealed associations with the pharmacodynamic effects of ipilimumab in melanoma21: the 203 genes with higher baseline expression in Responders are enriched for transcripts that are upregulated by ipilimumab (p<10−23), and the 108 transcripts with lower baseline expression in Responders are enriched for genes that are downregulated by ipilimumab (p<10−4). GSEA using the Hallmark gene sets (figure 2B; see the Methods section) identified immune-related processes including ‘Interferon Alpha Response’ and ‘Interferon Gamma Response’ as over-represented in Responders. Conversely, gene sets for metabolic and proliferative processes (‘Oxidative Phosphorylation’, ‘Myc targets V1’, ‘Angiogenesis’) were expressed at higher mean levels in non-Responders.
The gene most strongly differentially expressed between Response groups at baseline encodes the cytosolic DNA-sensor absent in melanoma 2 (AIM2) (figure 2C), a component of the inflammasome.22 To evaluate whether this finding can be generalized, we examined the AIM2 transcript level in the small set of archival formalin-fixed paraffin-embedded pretreatment biopsies from metastatic sites that are available from patients in the CheckMate 025 study.23 These biopsy samples also showed higher median levels of AIM2 transcript in nivolumab Responders (figure 2D).
We also examined our results at baseline for 224 genes previously identified as showing differential expression related to nivolumab response in baseline PD-L1+ biopsies from RCC (n=11).10 Of 204 genes evaluable for association with Response in our CheckMate 009 Affymetrix dataset, 173 agreed with the direction of differential expression, with 26 meeting a p<0.05 and ≥1.2-fold criteria, and 5 being among our final 311 genes (online supplemental table S4). The ‘Responder’ transcriptional profile of Ascierto et al10 is thus recapitulated in our dataset.
Differential expression between Response groups at day 28
At day 28, 779 genes were found to be differentially expressed (565 higher in Responders, 214 lower, with q<13%; online supplemental table S5). IRIS immune-cell transcripts were significantly over-represented (259 genes, p<10−100) and were almost exclusively expressed at higher levels in Responders (figure 3A and online supplemental figure S6B). The IRIS transcripts include representatives of myeloid (51 including CD68 and CD86) and lymphoid (61 including TCRα/β, CD3D, and CD8A) lineages, reflecting higher levels of immune infiltration associated with Response. GSEA using the Hallmark gene sets (figure 3B; see the Methods section) also identified higher immune activity; the most over-represented Hallmark gene sets were ‘Allograft Rejection’ and ‘Interferon Gamma Response’. Gene sets that were under-represented in Responders at day 28 included metabolic and oncogenic processes (‘Oxidative Phosphorylation’, ‘Hedgehog Signaling’ and ‘TGF-beta Signaling’). The 565 transcripts that were higher in nivolumab Responders include immune checkpoints such as T cell immunoreceptor with Ig and ITIM domains (TIGIT), CTLA-4, and PD-L2 (figure 3C and online supplemental table S5), suggesting that response may invoke feedback inhibition.
Differential change on treatment between Response groups
In the analysis for change on treatment that differed between Response groups, only the ADH1B and NDNF transcripts met the criteria in non-Responders (see the Methods section). In Responders, 189 genes met the criteria (figure 4A; 81 ‘up’, 108 ‘down’ in online supplemental table S6). The 108 transcripts that differentially decreased on treatment in Responders could reflect tumor shrinkage, and they include epidermal growth factor receptor (EGFR) and Wnt-pathway components such as FZD1 and DVL. The largest fold decrease in Responders on treatment was the transcript encoding MMP3, which activates canonical Wnt signaling.24 MMP3 was among the most strongly overexpressed genes in Responders at baseline (3.3-fold, p<5×10⁻⁷; online supplemental table S3), and the decrease in therapy suggests that the MMP3 transcript originates in tumor or tumor-specific stromal cells. GSEA using the Hallmark gene sets (figure 4B; see the Methods section) found that ‘Interferon Alpha Response’ and ‘Interferon Gamma Response’ are enriched in those transcripts increased on therapy, specifically in Responders, while transcripts from ‘Epithelial Mesenchymal Transition’ (EMT) and ‘Angiogenesis’ are among those decreased on treatment in Responders. The transcripts that differentially increased in Responders on treatment included only 13 IRIS immune-cell transcripts, and there was no indication of preferential infiltration by a specific immune cell type. However, we observed that the myeloid-produced proinflammatory cytokine IL-18 was among the 81 transcripts differentially upregulated in Responders (figure 4C). This differential effect may also be evaluable in the periphery, since we observed that the change in serum IL-18 level from baseline to day 21 was greater on average in Responders (figure 4D).
Association of T-cell metrics with Response
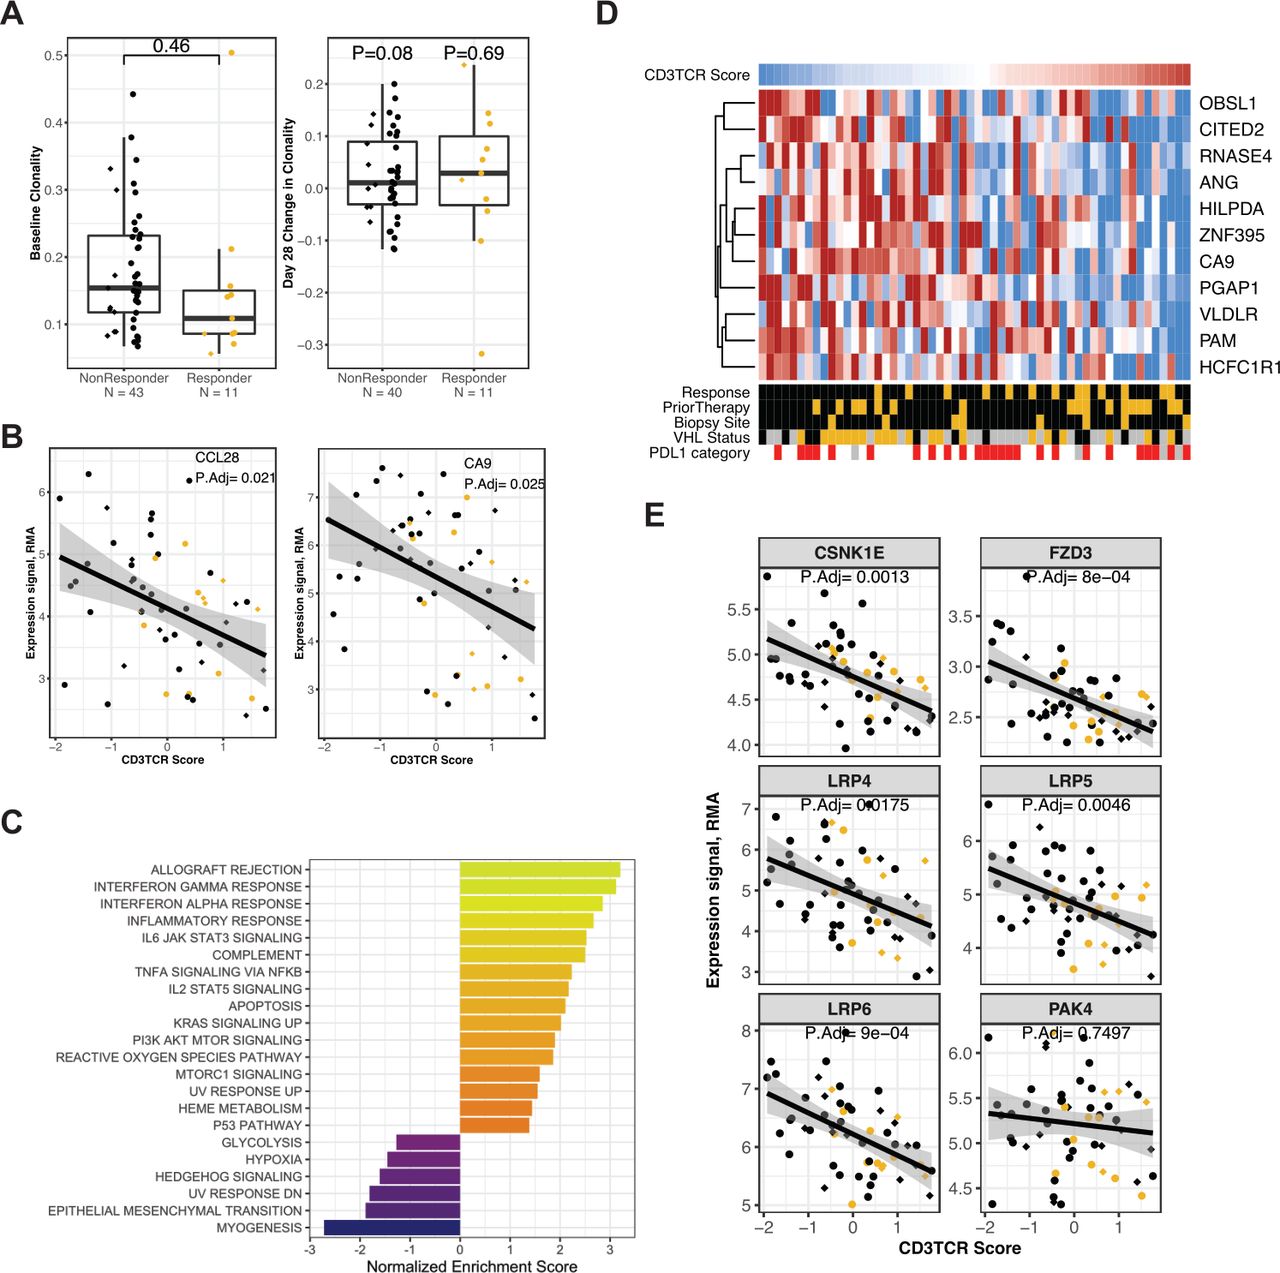
We investigated the association between several T-cell metrics in biopsies and Response. First, we evaluated clonality of T-cell populations. Baseline T-cell clonality was not significantly associated with Response, although lower median clonality (higher repertoire diversity) was observed in Responders for both the naïve and TKI-pretreated arms (figure 5A). Also, no association was observed between the change in clonality from baseline to day 28 and Response status (figures 5A and online supplemental figure S7). Second, we estimated the relative abundance of T cells in biopsies at baseline and at day 28 by a T-cell receptor ‘CD3TCR’ expression score using a gene set of the CD3-γ, CD3-δ, CD3-ε and CD3-ζ and TCR-α and TCR-β subunits,25 and performed the following analyses.

Association with T-cell metrics at baseline. ‘CD3TCR Score’ indicates the composite score for T-cell receptor transcripts, calculated in 56 biopsies obtained from patients at baseline. The Responder group is indicated by gold plotting symbols, and the non-Responder group by black plotting symbols. Prior TKI therapy is indicated by circles, Naïve by diamonds. (A) Left panel: clonality of the T-cell repertoire in tumor biopsies at baseline (n=54, p value from unpaired t-test). Right panel: change in clonality at day 28 relative to baseline (n=51, p values from paired t-test). Data are grouped by Response status. (B) Expression values for the CCL28 transcript (left panel) and CA9 transcript (right panel), compared with CD3TCR score, in 56 patients at baseline. Adjusted p values are from limma (online supplemental table S7). (C) Normalized enrichment score for GSEA evaluating Hallmark gene sets in the results for differential gene expression analysis against CD3TCR score at baseline. (D) Heat map panel shows z-score expression data for the 11 transcripts from the gene set ‘ELVIDGE_HIF1A_TARGETS_DN’ that were associated with CD3TCR score. Scale is −1 to 1 (blue to red). Data are from 56 patients at baseline, sorted from low to high CD3TCR score (left to right). Sample annotation tracks show CD3TCR Score (blue to red indicates lowest to highest score in the 56 baseline biopsies), Response (Responders in gold), Prior Therapy (Naïve in gold), Biopsy site (Lymph node metastatic site in gold), VHL1 status (Mutant in gold, unknown in gray), and tumor PD-L1 category (Negative in white, Positive at any level in red, Unknown in gray). (E) Expression values for the CSNK1E, FZD3, LRP4, LRP5, LRP6 and PAK4 transcripts, versus CD3TCR score, in 56 patients at baseline. Adjusted p values are from limma (online supplemental table S7). GSEA, gene set enrichment analysis; PD-L1, programmed death ligand-1; RMA, robust multiarray average; VHL, von Hippel-Lindau.
Association with baseline T-cell abundance
The CD3TCR score calculated on baseline samples (n=56) was compared with clinical and genomic factors (online supplemental figure S8). The CD3TCR score broadly agreed with IHC for CD4 and CD8 on adjacent sections and was not elevated in biopsies sourced from lymph node metastases. Samples with higher CD3TCR score generally rated lower on tumor purity metrics obtained from genomic analysis. The baseline CD3TCR score was positively associated with Response status (p=0.03), weakly associated with prior TKI therapy (p=0.07) and appeared unrelated to tumor PD-L1 status or VHL1 mutation status (p=0.20 and 0.53, respectively).
The baseline CD3TCR score was examined for association with baseline gene expression (n=56). We saw significant positive association with 509 IRIS immune-cell transcripts comprising myeloid and lymphoid lineages (multiple-test adjusted p<0.05; online supplemental table S7). No IRIS immune-cell genes showed significant negative association with CD3TCR score (online supplemental table S8). Thus, these results did not reveal an immune population specifically present in biopsies with lower T-cell abundance. (All negative associations with IRIS transcripts are presented in online supplemental table S9.) However, there were immune-related genes among the 325 transcripts that were significantly higher in biopsies with a low CD3TCR score. For example, we see higher transcript levels of Treg-attractant chemokine CCL2826 (adjusted p=0.021, figure 5B). We also observed a negative association between CD3TCR score and transcripts for Carbonic Anhydrase IX (CAIX or CA9), an enzyme enabling tumor adaptation to acidification of its extracellular environment (adjusted p=0.025, figure 5B). CCL28 and CAIX transcription are regulated by hypoxia,27 28 and GSEA using the Hallmark gene sets revealed that transcripts associated with low CD3TCR score were enriched for the ‘hypoxia’ gene set and further hypoxia-associated transcripts (figure 5C and online supplemental figure S9), including genes known to be directly regulated by HIF-1α and HIF-2α29 (figure 5D). Transcripts associated with low CD3TCR score were also enriched for the ‘Epithelial Mesenchymal Transition’ and ‘Hedgehog Signaling’ gene sets. In melanoma, low T-cell infiltration has been associated with high expression of the PAK4 kinase gene and elevated WNT/β-catenin signaling.30 Consistent with these observations, we noted significantly higher expression of components of Wnt receptor signaling (LRP4/5/6, CSNK1E and FZD3) in biopsies with lower CD3TCR score. However, we did not observe an association with PAK4 expression (adjusted p=0.75, figure 5E).
Association between gene expression and Response in patients with high T-cell abundance at day 28
The CD3TCR score calculated on biopsies from day 28 was associated with Response status (n=55, p<0.01). To investigate the phenomenon of patients who are non-Responders despite T-cell abundance comparable to that seen in Responders, the subset of patients with above-median CD3TCR score (n=27 comprising all 11 Responders and 16 non-Responders) were analyzed for association between day 28 gene expression and Response (online supplemental table S10). We found that immune checkpoints (such as those shown in figure 3C) were not differentially expressed. The 210 differentially expressed transcripts (fold change >1.2, p<0.05; online supplemental table S11) included only 13 IRIS immune-cell transcripts, such as CXCR4, a receptor for the lymphocyte chemoattractant SDF/CXCL12,31 which was expressed at higher levels in Responders, and the costimulatory receptor CD40, which was expressed at higher levels in non-Responders (figure 6A). GSEA using the Hallmark gene sets (figure 6B; see the Methods section) found that for these 27 patients with high T-cell abundance, lack of Response was associated with higher expression of transcripts from the ‘Interferon Alpha Response’ and ‘Interferon Gamma Response’ gene sets (figure 6B and online supplemental figure S10 and table S12). For ‘Interferon Gamma Response’, the leading-edge subset (the core of the gene set that accounts for the enrichment signal18) includes CD40 and several genes with direct roles in antiviral recognition, such as the dsDNA sensor IFIH1 (MDA5) and the RIG-I-MDA5 sentinel protein DDX6032 (figure 6C and online supplemental table S12).
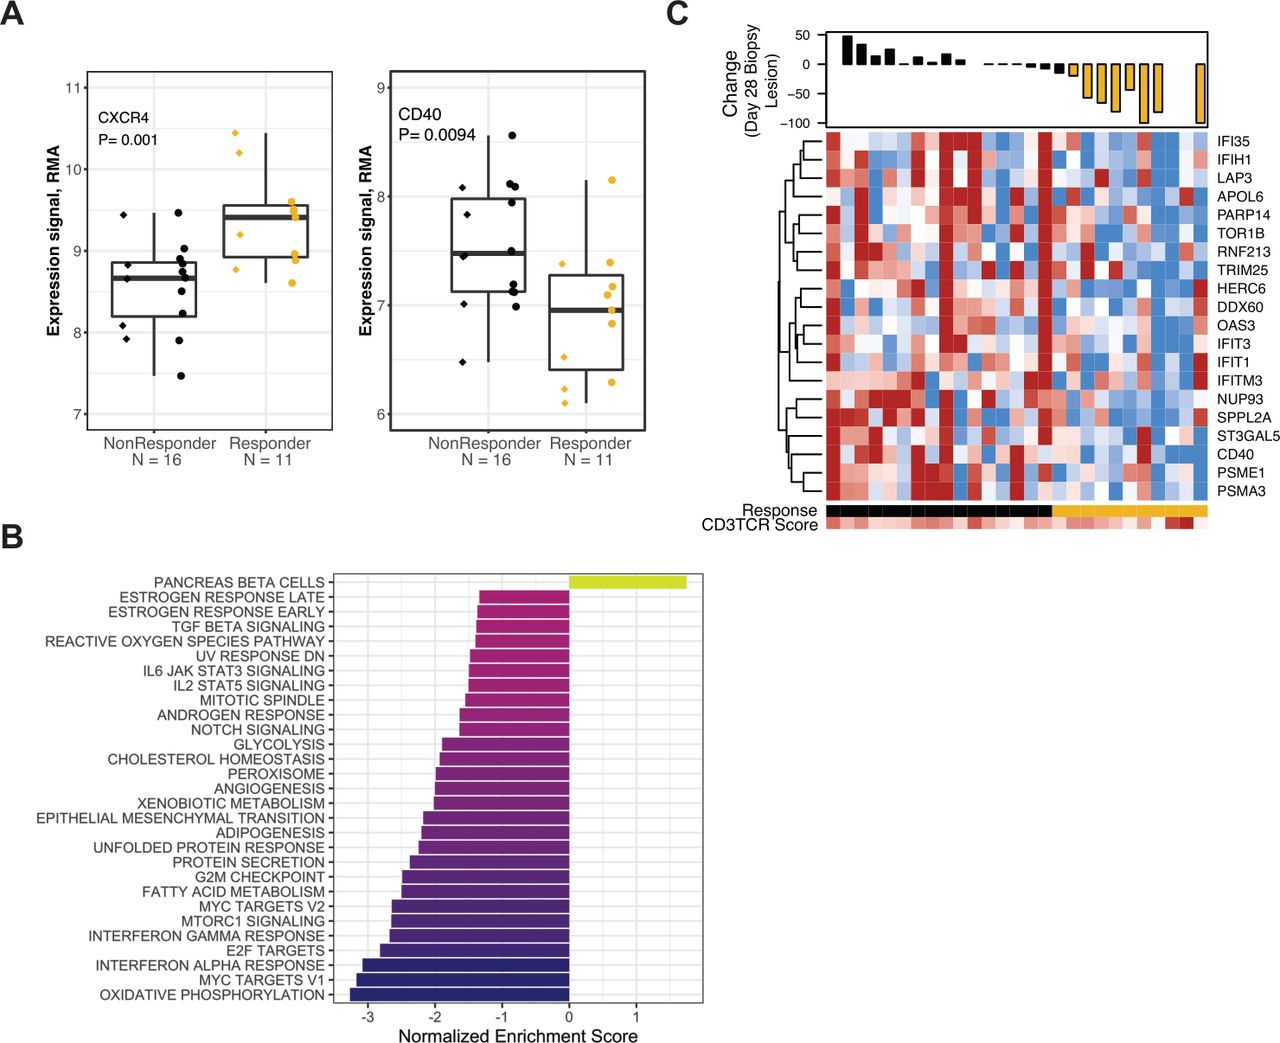
Association between gene expression and Response in patients with high T-cell abundance at day 28. All data shown are from the 27 patients with above-median CD3TCR score at day 28. (A) Expression values for the CXCR4 (left panel) or CD40 (right panel) transcripts, in biopsies provided at day 28 of nivolumab treatment. Data are grouped by response status. Prior TKI therapy is indicated by circles, Naïve by diamonds. (B) Normalized enrichment score for GSEA evaluating Hallmark gene sets in the result for differential gene expression analyses at day 28 comparing response status. (C) Heat map panel shows z-score expression data at day 28 for the 20 transcripts from the Hallmark gene set ‘Interferon Gamma Response’ that were negatively associated with Response status (p<0.1). Scale is −1 to 1 (blue to red). Waterfall plot shows percentage reduction of the lesion that provided the expression data (index lesions, n=23). Lesions with reduction of ≥20% are indicated in gold. Sample annotation tracks show Response (Responders in gold), and CD3TCR score on a scale from blue to red (lowest to highest score in the 55 biopsies analyzed at day 28). GSEA, gene set enrichment analysis; RMA, robust multiarray average; TKI, tyrosine kinase inhibitor.
Association of gene expression classifiers with Response
We assessed transcriptional classifiers previously related to the biological characteristics of ccRCC and/or therapeutic response to nivolumab. We assigned ‘ccrcc-like’ molecular subtypes for CheckMate 009 biopsies using the ccrcc groups (see Methods),6 which were established in the same sample type as CheckMate 009 (fresh-frozen biopsies of metastatic lesions). We also calculated scores for the ‘Angiogenesis’, ‘T-effector’, and ‘Myeloid Inflammation’ gene sets from the IMmotion150 trial,5 the Tumor Inflammation Signature (‘TIS’),33 the 26 genes evaluated in the JAVELIN Renal 101 trial (‘JAVELIN’),11 the ‘Adenosine’ gene set,34 a gene set related to Fuhrman grade,35 and an EMT/stromal gene set associated with T-cell exclusion.36
Clustering identified redundancy in the way ccrcc-like subtypes and gene set scores classified patients in CheckMate 009 (figure 7A). ‘Myeloid Inflammation’ and ‘Adenosine’ scores were very similar, as they share gene content (online supplemental table S1). Both resembled ‘Fuhrman grade’ and, to a lesser degree, the ‘EMT/stromal’ score. Our ‘CD3TCR’ score was highly correlated with ‘TIS’, ‘T-effector’, and ‘JAVELIN’ scores, and these four T-cell/inflammation-related scores were highest in the ccrcc4-like subtype, although CD274 (PD-L1) was their only shared transcript (online supplemental table S1). Finally, the ccrcc2-like molecular subtype was associated with high ‘Angiogenesis’ score, although they share no genes (online supplemental figure S11 and table S1).
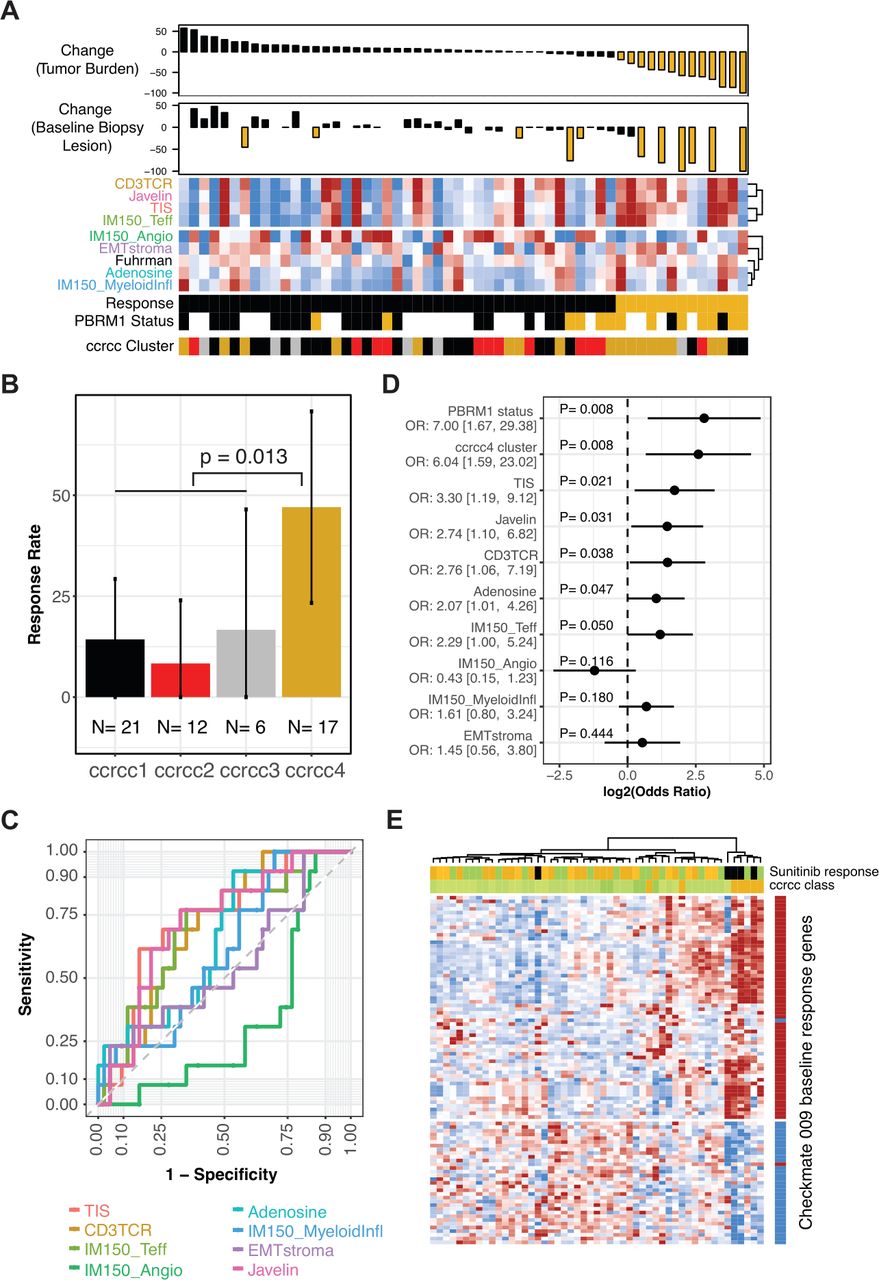
Association of gene expression classifiers with Response. (A) Heat map panel shows scores for the gene sets indicated, clustered by their similarity. Samples are ordered by maximal percentage tumor burden reduction for the 56 patients with baseline gene expression data, shown in the upper waterfall plot. Reduction of ≥20% is indicated in gold. Lower waterfall plot shows maximal percentage reduction of the lesion that provided the expression data (index lesions, n=42). Reduction of ≥20% is indicated in gold. Sample annotation tracks show Response (Responders in gold), PBRM1 status (truncating mutation in gold, wild type in black, unknown are blank), and predicted ccrcc-like subtype (ccrcc1-like as black, ccrcc2-like as red, ccrcc3-like as gray, and ccrcc4-like as gold). (B) Response rate in patient groups for each of the four ccrcc-like molecular subtypes. Error bars indicate 95% CI for the rate. P value is from Fisher’s exact test of ccrcc4-like versus ccrcc1/2/3-like. (C) Receiver operating characteristic curves summarizing predictive accuracy for gene set scores, ranging from TIS (AUC=72%) to IMmotion150 angiogenesis (AUC=33%). (D) ORs for Response given PBRM1 status, ccrcc4-like subtype, or gene set score. For the gene set scores, the OR compares the odds of response for the 25th versus the 75th percentile. For ccrcc4-like subtype and PBRM1 mutant status, the OR compares the odds of Response for ccrcc4-like versus ccrcc1/2/3-like and for mutant versus wild type, respectively. Panel displays log2 OR, centered on 0. OR and 95% CIs indicated to the left. (E) Data for 51 samples of ccRCC from public dataset E-MTAB-3267. Heat map panel shows z-score expression data for 93 genes for which baseline expression was associated with Response (p<0.01 and >1.5-fold difference) in CheckMate 009 (see figure 2A). Gene annotation track to the right of the heat map indicates the direction of differential expression in CheckMate 009, with red indicating transcripts that were higher at baseline in patients who then responded to nivolumab. Sample annotation tracks show the individual’s best response to subsequent therapy with sunitinib (PD indicated in black, SD in green, Clinical Benefit and PR in gold) and the ccrc subtype with ccrcc1, 2, and 3 in progressively darker shades of green and ccrcc4 in gold. Samples and transcripts are hierarchically clustered. AUC, area under the curve; ccrcc, clear cell renal cell carcinoma; OR, odds ratio; PD, progressive disease; PR, partial response; SD, stable disease; TIS, tumor inflammation signature.
We evaluated association between Response status and the classifiers. Among the molecular subtypes, members of ccrcc4-like subtype had a higher rate of Response to nivolumab (47% Response rate, p=0.013 relative to non-ccrcc4-like; figure 7B). The predictive accuracy of gene set scores was evaluated by ROC analysis (figure 7C and online supplemental figure S12). ‘Angiogenesis’ (which was positively associated with response to sunitinib therapy in IMmotion150) showed a negative association with nivolumab Response. The two related scores reflecting myeloid biology (‘Myeloid Inflammation and Adenosine’) had poor predictive accuracy, similar to the ‘Fuhrman grade’ score. The four scores related to T-cell/inflammation status (‘CD3TCR’, ‘TIS’, ‘T-effector’, and ‘JAVELIN’) had similar predictive accuracy, with AUCs around 70%.
The strength of association with Response, as measured by the OR, was estimated for each gene set score, for the ccrcc4-like subtype, and for PBRM1 mutation status (figure 7D and online supplemental table S13). The gene sets had OR estimates that were broadly similar to each other, except for ‘Angiogenesis’, for which the direction of association was opposite. The previously reported association of PBRM1 mutation status with response14 was recapitulated in this independent analysis of the CheckMate 009 dataset (50% Response rate in mutants, p=0.011; online supplemental figure S13A). The ccrcc4-like subtype and PBRM1 mutation status had ORs of similar magnitude. However, PBRM1 status was not associated with ccrcc-like subtype in the 33 patients where both were evaluable (p=0.91, online supplemental figure S13B).
Since the ccrcc4-like subtype was associated with Response in CheckMate 009, we evaluated the ability of the CheckMate 009 baseline Response genes (online supplemental table S3) to predict the ccrcc4 subtype, using a published dataset from 51 patients.6 Unsupervised clustering of the transcripts reproduced the directionality of coregulation seen in CheckMate 009, while unsupervised clustering of the samples identified a group that was entirely ccrcc4 subtype (n=5 of 7 ccrcc4 samples in the dataset) and sunitinib non-responsive (figure 7E and online supplemental figure S14). This association between expression of the CheckMate 009 Response genes and the ccrcc4 subtype was not due to gene content; the only shared transcript was for AIM2 (online supplemental table S1).
Discussion
We report here the first characterization of associations between nivolumab response and biological properties of tumor biopsies taken before and during treatment of metastatic ccRCC. We discuss below the implications of our findings for immune infiltrates, for potential biomarkers, for therapeutic targets, and for current combination therapies (nivolumab plus ipilimumab, TKI plus anti-programmed death-1 [PD-1]).
RCC tumors are generally highly inflamed and ‘exclusion’ of T cells is rare.23 At baseline, our differential gene expression and T-cell abundance analyses showed that the subset with highest immune content included subsequent Responders but also some non-Responders, explaining our observation that immune classifiers have low predictive accuracy. We have previously shown that increased immune infiltration in all patients is a pharmacodynamic effect of nivolumab treatment.12 Here, both differential expression and T-cell abundance analyses showed that, on treatment, this infiltration was highest in Responders and a subset of non-Responders. Our study design allowed us to exclude two possible explanations for the observation that some non-Responders had immune content very similar to Responders: it was not due to a lymph node site for the tumor biopsy or to a differential response for the lesion that provided expression data. Instead, the recent demonstration of interplay between infiltration and somatic alterations is likely to be relevant.23
Regarding potential pretreatment markers for response, our most strongly differentially expressed gene encodes the cytosolic DNA-sensor AIM2. This protein detects altered or mis-localized DNA molecules, triggering assembly of the inflammasome and activating inflammatory caspases and cytokines such as IL-1β.22 We saw elevated expression of AIM2 in pretreatment biopsies from nivolumab Responders in an independent clinical dataset, and higher AIM2 expression is also associated with the ccrcc4 subtype and poor response to sunitinib.6 Overall, our pretreatment markers for favorable response to nivolumab in CheckMate 009 agree with the previous findings of Ascierto et al10 and identify the ccrcc4 subtype in the dataset of Beuselinck et al,6 indicating a robust molecular grouping of ccRCC that is related to response. The single-gene predictive markers from this study also include viable candidates to be evaluated as biomarkers in the periphery. For example, MMP3, the second-most strongly differentially expressed gene, was independently identified as a baseline plasma protein marker associated with longer OS for the PD-L1 inhibitor atezolizumab.37
Regarding potential on-treatment markers for response, in this analysis, we looked for transcripts with a change over the 28-day treatment window that differed between the Response groups. We could not identify markers for non-Responders, but many such transcripts that changed in Responders included an increase in IL-18 mRNA that was also detectable in serum protein levels. A differential increase in serum IL-18 associated with longer OS was also reported for lenvatinib plus everolimus,38 but a decrease was reported for atezolizumab.37 IL-18 synergizes with IL-12 to increase transcript level for IFNG,39 and IFNG is among the 565 genes expressed at higher levels in the CheckMate 009 Responders at day 28 (online supplemental table S5). The conflicting observations for association between serum IL-18 levels and OS with nivolumab,25 lenvatinib plus everolimus,38 or atezolizumab37 may reflect the importance of assay timing relative to therapeutic response. In sum, IL-18 is a nivolumab mechanistic marker that potentially allows monitoring of response in the periphery.
Our findings include transcripts for proteins that are themselves potential therapeutic targets. One immune-associated transcript seen at higher levels at baseline in non-Responders was MAN2A1, encoding alpha-mannosidase II. Inhibitors of this enzyme profoundly affect the Th1/Th2 axis40 and have been clinically tested due to their ability to enhance cellular immune responses and reduce solid tumor growth in mice.41 Among transcripts at higher levels at baseline in Responders, we saw PVRIG, a coinhibitory receptor of the DNAM/TIGIT/CD96 nectin family. As with TIGIT, antagonism of PVRIG increases CD8+ T-cell cytokine production and cytotoxic activity,42 and inhibitors are in clinical development.43 We saw TBL1XR1 transcripts at higher baseline levels in non-Responders. The TBL1XR1 protein plays a role in Wnt signaling via interaction with N-CoR and β-catenin,44 and we found that transcripts for several other Wnt pathway components were associated with lack of response and/or low T-cell abundance at baseline. This suggests that RCC may be among the relevant cancers for harnessing currently available Wnt modulators for cancer immunotherapy.45 Finally, lower T-cell abundance at baseline was associated with non-Response and reflected enrichment for ‘Hedgehog Signaling’, which might prove therapeutically tractable, and increase of ‘Hypoxia’-associated transcripts, including CAIX and CCL28. Targeting hypoxia directly with HIF-2α inhibitors may be an effective treatment for patients with RCC.46 Recently completed trials with girentuximab, a monoclonal antibody against CAIX, showed a non-significant disease-free survival benefit in patients with RCC with high CAIX scores,47 while CCL28 has also been proposed as an oncology target based on its role in promoting tolerance and angiogenesis.26
Our study suggests several possible mechanisms for synergy between nivolumab and ipilimumab, an approved 1 L regimen with superior efficacy to monotherapy for RCC.4 First, we saw that our baseline predictors of Response to nivolumab included many transcripts that are regulated by treatment with ipilimumab,21 raising the possibility that treatment with ipilimumab promotes a tumor environment that predisposes to nivolumab response. Second, we saw elevated transcription of the Treg chemoattractant CCL28 in biopsies with low T-cell abundance, indicating that they may have an unfavorable ratio of CD4:CD8 that could be addressed by the antibody-dependent cell-mediated cytotoxic effect of ipilimumab on Tregs reported in animal models.48 Third, in the subset of patients lacking nivolumab Response despite high T-cell abundance on therapy, we saw higher levels of numerous transcripts related to IFN induction via RIG-I-MDA5 signaling. IFN signaling is of increasing interest as a mechanism of resistance to PD-1 blockade.49 High RIG-I transcriptional activity has recently been reported as a predictor of response to ipilimumab,50 implicating these patients as a favorable target group.
Our study also suggests a possible mechanism for the augmented response seen for the approved 1 L regimens that combine CPI therapy (pembrolizumab or avelumab) with the selective vascular endothelial growth factor receptor TKI axitinib.4 We observed higher Response rates for nivolumab in patients with biopsies of the ccrcc4-like molecular subtype and lower Response rates when biopsies were of the ccrcc2-like subtype. Higher response rates for the TKI sunitinib were previously observed in patients with biopsies of the ccrcc2 molecular subtype and lower response rates when biopsies were of the ccrcc4 subtype.6 7 We showed that the ccrcc2-like subtype had high expression of the ‘Angiogenesis’ gene set, which has been positively associated with response to sunitinib.5 It seems likely that the increase in efficacy with CPI in combination with TKI is due to broadening of the responsive population (ccrcc4 plus ccrcc2), instead of deeper efficacy in a common patient population. The ccrcc subtypes are being prospectively tested in the BIONIKK clinical trial (NCT02960906), with overall response rate evaluation according to molecular groups (ccrcc1–4) and assigned treatment (nivolumab monotherapy, nivolumab plus ipilimumab, or TKI monotherapy (sunitinib or pazopanib)). The outcome should further illuminate this matter.
Conclusion
Our characterization of nivolumab treatment using gene expression in lesion-paired biopsies before and during treatment informs on the relationship of immune infiltration to response. We have shed light on two phenomena related to primary resistance to CPI: low T-cell infiltrate at baseline and high T-cell infiltrate on therapy in the absence of response. We also identified an association between molecular subtypes of ccRCC and response to nivolumab, reflecting a biological state that is relevant to treatment decisions for both CPI and TKI therapy.
Acknowledgments
We appreciate the efforts of all study nurses and clinical staff which made this study feasible, and patients who generously provided their samples for this research. We are grateful to Maria Jure-Kunkel for exemplary clinical trial design and biomarker execution; Aiqing He, Amy Truong and Vishal Patel for performing Affymetrix array expression analysis; Isaac Neuhaus, Charles Tilford, Jansen Lim and Carlos Rios for bioinformatics support; and Benoit Beuselinck for providing ccrcc annotation of E-MTAB-3267. Editorial support was provided by Matthew Weddig of Spark Medica Inc and funded by Bristol Myers Squibb.
References
Supplementary materials
Supplementary Data
This web only file has been produced by the BMJ Publishing Group from an electronic file supplied by the author(s) and has not been edited for content.
Footnotes
Twitter @DrChoueiri
Contributors MS and TKC: conception and design, data acquisition. PR-M, SDC, SP-C, PMS, RA, and AMW: analysis of the data. PR-M, AMW and MW-R: interpretation of the data. PR-M: writing of the manuscript. AMW and PR-M: production of the figures. All authors read and approved the final manuscript.
Funding This research was funded by Bristol Myers Squibb.
Competing interests PR-M, SDC, SP-C, PMS, RA, AMW, and MW-R were employees of Bristol Myers Squibb at the time of their contribution. TKC has served as a consultant/advisor for Pfizer, GlaxoSmithKline, Novartis, Merck, Bristol Myers Squibb, Bayer, Eisai, Roche, and Prometheus Labs, Inc, and has received institutional research funding from Pfizer, Novartis, GlaxoSmithKline, Bristol Myers Squibb, Merck, Exelixis, Roche, AstraZeneca, Peloton, and Tracon. MS has served as a consultant/advisor for Genentech-Roche, Bristol Myers Squibb, AstraZeneca/MedImmune, Pfizer, Novartis, Kyowa-Kirin, Amgen, Merus, Seattle Genetics, Immune Design, Prometheus, Anaeropharma, Astellas-Agensys, Immunova, Nektar, Neostem, Pierre-Fabre, Eli Lilly, Symphogen, Lion Biotechnologies, Amphivena, and Adaptive Biotechnologies.
Patient consent for publication Not required.
Ethics approval Institutional review boards of participating institutions approved the protocol, and the study was conducted according to the Declaration of Helsinki and the International Conference on Harmonization. All patients gave written informed consent.
Provenance and peer review Not commissioned; externally peer reviewed.
Data availability statement Data are available in a public, open access repository. Gene expression data and annotation are available in Array Express as E-MTAB-3218. Analysis code is available online (https://github.com/rossmacp/CM9_response).
Supplemental material This content has been supplied by the author(s). It has not been vetted by BMJ Publishing Group Limited (BMJ) and may not have been peer-reviewed. Any opinions or recommendations discussed are solely those of the author(s) and are not endorsed by BMJ. BMJ disclaims all liability and responsibility arising from any reliance placed on the content. Where the content includes any translated material, BMJ does not warrant the accuracy and reliability of the translations (including but not limited to local regulations, clinical guidelines, terminology, drug names and drug dosages), and is not responsible for any error and/or omissions arising from translation and adaptation or otherwise.