Article Text

Abstract
Background An immune active cancer phenotype typified by a T helper 1 (Th-1) immune response has been associated with increased responsiveness to immunotherapy and favorable prognosis in some but not all cancer types. The reason of this differential prognostic connotation remains unknown.
Methods To explore the contextual prognostic value of cancer immune phenotypes, we applied a multimodal pan-cancer analysis among 31 different histologies (9282 patients), encompassing immune and oncogenic transcriptomic analysis, mutational and neoantigen load and copy number variations.
Results We demonstrated that the favorable prognostic connotation conferred by the presence of a Th-1 immune response was abolished in tumors displaying specific tumor-cell intrinsic attributes such as high transforming growth factor-beta (TGF-β) signaling and low proliferation capacity. This observation was independent of mutation rate. We validated this observation in the context of immune checkpoint inhibition. WNT-β catenin, barrier molecules, Notch, hedgehog, mismatch repair, telomerase activity and AMPK signaling were the pathways most coherently associated with an immune silent phenotype together with mutations of driver genes including IDH1/2, FOXA2, HDAC3, PSIP1, MAP3K1, KRAS, NRAS, EGFR, FGFR3, WNT5A and IRF7.
Conclusions This is the first systematic study demonstrating that the prognostic and predictive role of a bona fide favorable intratumoral immune response is dependent on the disposition of specific oncogenic pathways. This information could be used to refine stratification algorithms and prioritize hierarchically relevant targets for combination therapies.
- immunotherapy
- gene expression profiling
- genetic markers
- cytotoxicity, immunologic
- genome Instability
This is an open access article distributed in accordance with the Creative Commons Attribution Non Commercial (CC BY-NC 4.0) license, which permits others to distribute, remix, adapt, build upon this work non-commercially, and license their derivative works on different terms, provided the original work is properly cited, appropriate credit is given, any changes made indicated, and the use is non-commercial. See http://creativecommons.org/licenses/by-nc/4.0/.
Statistics from Altmetric.com
Background
Evidence of the effects of antitumoral immunity on cancer progression has accumulated over the last decades. The identification of tumor immune escape mechanisms, most importantly the characterization of immune checkpoints, led to major advances in immunotherapy. Immune checkpoint inhibitors have dramatically improved clinical outcome for a subset of patients across multiple cancer types. Despite this progress, the majority of tumors (60%–80%) still fail to respond.1 2 Understanding the relationship between tumor cell and the immune system is critical to develop more effective therapeutic strategies.
A pre-existing intratumoral antitumor immune response has been associated with favorable outcome and responsiveness to immunotherapy.3 However, multiple studies have reported differences in the association between measures of intratumoral immune activity and survival across different cancer types.4–8 In breast cancer, a positive association between survival and density of tumor infiltrating lymphocytes, as estimated by transcriptomic data, was restricted to tumors displaying a high mutational load or an aggressive/high proliferative phenotype.9–11 Proposed transcriptome-based immunological classifications range from a measure of cytolytic activity by mean expression of GZMA and PRF1 genes,12 to reflections of immune cell infiltration by cell-specific transcriptional profiles,10 13 or gene signatures reflecting molecular components of an active antitumor immune response, including major histocompatibility complex, costimulatory or immunomodulatory molecules.4 14 15 Reported prognostic and predictive signatures typically show overlapping genes or genes involved in conserved immunologic processes.3 16–19 We termed these mechanisms as the Immunologic Constant of Rejection (ICR).3 14 20–22 The ICR signature incorporates interferon-stimulated genes driven by transcription factors IRF1 and STAT1, CCR5 and CXCR3 ligands, immune effector molecules and counter-activated immune regulatory genes.14 16 22 23 Overall, the high expression of ICR genes typifies ‘hot’/immune active tumors characterized by the presence of a T helper 1 (Th-1)/cytotoxic immune response, as described in detail elsewhere.3 22–24
Previously, we observed a significantly prolonged survival of patients with tumors displaying a coordinated expression of ICR genes in breast cancer.22 24 ICR gene expression was also associated with responsiveness of breast cancer metastatic lesion to local immunotherapy.21 Moreover, we identified genetic determinants of different immune phenotypes.22 In particular, we reported that transcriptional dysregulation of the MAPK pathways sustained by genetic alterations (ie, MAP3K1 and MAP2K4 mutations) are enriched in immune silent tumors.22 We also observed that the ICR signature refines and improves the prognostic value of conventional prognostic signatures adopted in breast cancer.24 Here, we propose a systematic analysis of the entire The Cancer Genome Atlas (TCGA) cohort encompassing 31 different histologies. Using a pan-cancer approach, we identified novel relationships between tumor genetic programmes and immune orientation. After having demonstrated differential associations between ICR classification and overall survival (OS) across cancer types, we systemically analyzed in which (molecular) contexts the ICR has prognostic value and in which ones it does not. Combination of immune orientation with tumor intrinsic attributes that interact with its prognostic significance could refine tumor immunologic classifications. This approach was validated in the context of immune-checkpoint inhibition allowing better predictive precision.
Methods
Data acquisition and normalization
RNA-seq data from TCGA were downloaded and processed using TCGA Assembler (V.2.0.3). Gene symbols were converted to official HGNC gene symbols and genes without symbol or gene information were excluded. RNA-seq data from as wide as possible sample set of the total of 33 available cancer types of tissue types primary solid tumor (TP), recurrent solid tumor, additional-new primary, metastatic (TM), additional metastatic and solid tissue normal were used to generate a pan-cancer normalized dataset. Normalization was performed within lanes, to correct for gene-specific effects (including GC-content and gene length) and between lanes, to correct for sample-related differences (including sequencing depth) using R package EDASeq (Exploratory Data Analysis and Normalization for RNA-Seq) (V.2.12.0) and quantile normalized using preprocessCore (V.1.36.0). After normalization, samples were extracted to obtain a single primary tumor tissue (TP) sample per patient. For skin cutaneous melanoma (SKCM) patients without available TP sample, a metastatic sample (TM) was included. Finally, the pan-cancer normalized dataset was filtered to remove duplicate patients and samples that did not pass assay-specific QCs as defined previously,7 data were log2 transformed. Clinical data were sourced from the TCGA Pan-Cancer Clinical Data Resource.25 Mutation rate and predicted neoantigen load were obtained from the recent immunogenomic analysis by Thorsson et al.7 The dataset published by Ellrott et al was used for mutation data analysis.26 Hematological cancer types Acute Myeloid Leukemia (LAML) and Lymphoid Neoplasm Diffuse Large B-cell Lymphoma (DLBC) were excluded from the analysis.
Raw fastq files of datasets GSE7822027 and GSE7822028 were downloaded from National Center for Biotechnology Information (NCBI) storage replication adapter (SRA) servers, quality control and adapter trimming was performed using Trim_Galore (https://github.com/FelixKrueger/TrimGalore). Reads were aligned to hg19 using STAR.29 GenomicFeatures and GenomicAlignments Bioconductor packages were used to generate raw counts. The raw counts were normalized with EDASeq30 and log2 transformed. The dataset phs000452.v2.p131 was downloaded, already normalized, from Tumor Immune Dysfunction and Exclusion (TIDE) (http://tide.dfci.harvard.edu). TCGA segmented copy number variation (CNV) files were downloaded from Genomic Data Commons (GDC) (https://portal.gdc.cancer.gov) to run Genomic Identification of Significant Targets in Cancer (GISTIC).32
ICR classification
Consensus clustering based on the 20 ICR genes (figure 1A) was performed for each cancer type separately using the ConsensusClusterPlus (V.1.42.0) R package with the following parameters: 5000 repeats, a maximum of six clusters and agglomerative hierarchical clustering with ward criterion (Ward.D2) inner and complete outer linkage. The optimal number of clusters (≥3) for best segregation of samples based on the ICR signature was determined heuristically using the Calinski-Harabasz criterion33 (source function available on GitHub repository,34 see cancer datasheets (https://figshare.com/articles/Cancer_Datasheets/7937246) for plots with local maximum). As we were intending to compare cancer samples with a highly active immune phenotype with those that have not, the cluster with the highest expression of ICR genes was designated as ‘ICR High’, while the cluster with the lowest ICR gene expression was designated ‘ICR Low’. All samples in intermediate cluster(s) were defined as ‘ICR Medium’. Samples were annotated with an ICR score, defined as the mean of the normalized, log2 transformed expression values of the ICR genes. For generation of the ICR Heatmaps (figure 1A and the cancer datasheets), a modified version of heatmap.3 function was used.34

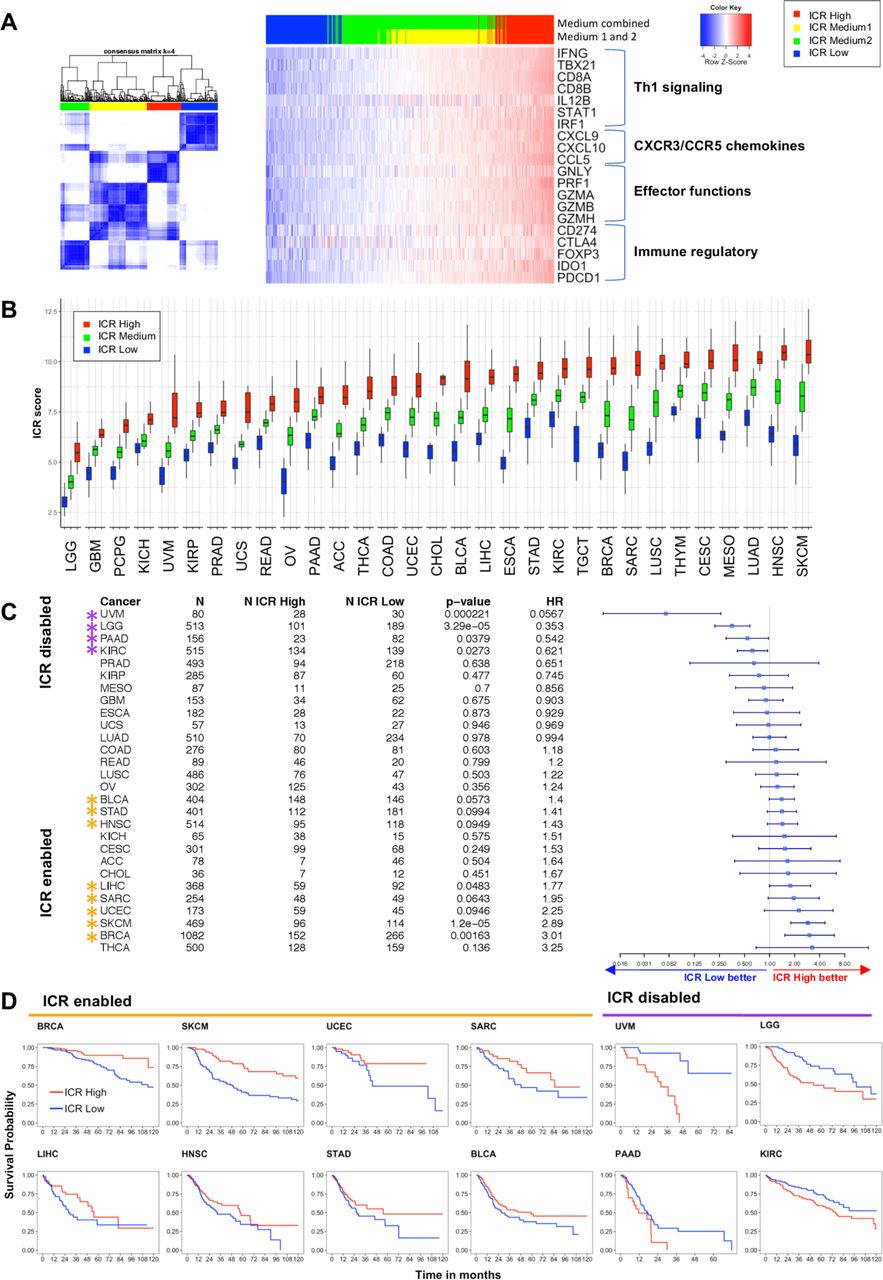
Immunological classification of 31 cancer types based on expression of ICR gene signature A. Consensus cluster matrix of SKCM samples based on RNA-seq expression values of ICR genes (left panel). RNA-seq expression heatmap of ICR genes annotated with ICR consensus clusters (n=469). Clusters with intermediate ICR gene expression levels (ICR Medium1 and ICR Medium2) were combined to obtain ICR high, medium and low groups (HML classification). ICR genes reflect four components of immune mediated tissue rejection: Th-1 signaling, CXCR3/CCR5 chemokines, immune effectors and immune regulatory functions (right panel). (B) Boxplot of ICR scores across ICR clusters in 31 cancer types. Cancer types are ordered by mean ICR score per cancer. (C) Forest plot showing Hrs (overall survival) of ICR low versus high, p value and number of patients (N) for each of the cancer types. ICR-enabled cancer types (HR >1; p<0.1) are indicated with orange asterisks and ICR-disabled cancer types (HR <1; p>0.1) are indicated with purple asterisks. Cancer types pCpG, THYM and TGCT are excluded from the plot, because CIs ranged from 0 to infinite due to low number of deaths in these cancer types. (D) Kaplan-Meier curves showing OS across ICR groups in ICR-enabled and ICR-disabled cancer types. ((A) Kaplan-Meier curves for each individual cancer type are available in the cancer datasheets). ICR, immunologic constant of rejection; OS, overall survival; Th-1, T helper 1. ACC: Adrenocortical Carcinoma; BLCA: Bladder Urothelial Carcinoma; BRCA: Breast Invasive Carcinoma; CESC: Cervical Squamous Cell Carcinoma and Endocervical Adenocarcinoma; CHOL: Cholangiocarcinoma; COAD: Colon Adenocarcinoma; ESCA: Esophageal Carcinoma; GBM: Glioblastoma; HNSC: Head and Neck Squamous Cell Carcinoma; KICH: Kidney Chromophobe; KIRC: Kidney Renal Clear Cell Carcinoma; KIRP: Kidney Renal Papillary Cell Carcinoma; LGG: Low Grade Glioma; LIHC: Liver Hepatocellular Carcinoma; LUAD: Lung Adenocarcinoma; LUSC: Lung Squamous Cell Carcinoma; MESO: Mesothelioma; OV: Ovarian Serous Cystadenocarcinoma; PAAD: Pancreatic Adenocarcinoma; PCPG: Pheochromocytoma and Paraganglioma; PRAD: Prostate Adenocarcinoma; READ: Rectum Adenocarcinoma; SARC: Sarcoma; SKCM: Skin Cutaneous Melanoma; STAD: Stomach Adenocarcinoma; TGCT: Testicular Germ Cell Tumors; THCA: Thyroid Carcinoma; THYM: Thymoma; UCEC: Uterine Corpus Endometrial Carcinoma; UCS: Uterine carcinosarcoma; UVM Uveal Melanoma.
For the landmark analyzes, we used a per-cancer clustering approach for ICR cluster assignment, as opposed to pan-cancer clustering, for two main reasons: (1) categorization pan cancer does not allow assessment of the prognostic value of ICR in tumor types with an overall low or high ICR expression; (2) using a pan-cancer clustering approach, the ICR assignment will change depending on the selection of tumor types included, as result of centroid shifting, making this classification inconsistent between analyzes. Pan-cancer clustering was performed as explorative/comparative analysis.
t-distributed stochastic neighbor embedding (t-SNE) plot t-SNE35 was used as dimension reduction technique on the complete RNA expression matrix using R package Rtsne (V.0.15) (settings perplexity=15, theta=0.5). t-SNE plot was annotated for SKCM primary, SKCM metastasis and uveal melanoma (UVM) samples.
Survival analysis
OS from the TCGA Pan-Cancer Clinical Data Resource25 was used to generate Kaplan-Meier curves using a modified version of the ggkm function.36 Patients with less than 1 day of follow-up were excluded and survival data were censored after a follow-up duration of 10 years. HRs between ICR low and ICR high groups, including corresponding p values based on X2 test, and CIs were calculated using the R package survival (V.2.41–3). The forest plot (figure 1C) was generated using the R package forestplot (V.1.7.2). Cancer types, Pheochromocytoma and Paraganglioma (PCPG), Thymoma (THYM), Testicular Germ cell tumors (TGCT), were excluded before generation of the plot, as the number of deaths in the comparison groups was too small for survival estimation.25 Cancer types with a HR >1 with a p<0.1 were termed ICR-enabled and cancer types with an HR <1 with a p<0.1 were termed ICR disabled. The forest plot was annotated manually with indicators for ICR-enabled and ICR-disabled cancer types. Cox proportional hazards regression analysis was performed with the R package survival with the AJCC pathological tumor stage as described in the TCGA Pan-Cancer Clinical Data Resource.25 Factors added in the multivariate analyzes (overall and stratified according to the ICR-enabling categories) include representative oncogenic pathways (proliferation and transforming growth factor beta (TGF-ß) signaling), mutation rate, aneuploidy, stage or histological grade.
For simplification, stage categories were reduced to ‘stage I”’, ‘stage II’, ‘stage III’ and ‘stage IV’ for subcategories (eg, stage IIA, stage IIB, stage IIC, etc). For lower grade glioma’s (LGG) and glioblastoma multiforme (GBM), histological grade was used instead of stage as this is not applicable to these tumors.
For the selection of variables to be included in the final (stratified) multivariate Cox models, a lenient interpretation of the violation of the proportional hazard assumption (PHA) was considered appropriate. Such an approach was undertaken in order to allow for a correct performance of the model and, at the same time, to avoid the unwarranted exclusion of biologically relevant variables with a statistically significant, although minimal, PHA violation due to the large sample size of the study cohorts. The Pearson product-moment correlation (rho) between the Schoenfeld residuals and the transformed (log) survival time was computed using the cox.zph R function. Using the same package, the tolerance of the PHA violation was assessed by taking into account the p value of rejecting the null hypothesis of the PHA and by graphically inspecting the slope of the line representing the smoothing-spline fit of the scaled Schoenfeld residuals plotted against the transformed survival time as a dependent variable. The variables were grouped into three categories: (A) p≥0.05 and minimally curved fit line=PHA true; (B) p<0.05 and minimally curved fit line=minimal PHA violation, tolerated; (C) p<0.05 and curved fit line=significant PHA violation (online supplementary figure 1). Cox proportional hazard models were stratified for variables with a significant violation (category C). For symmetry, stratification was applied for such variables across all multivariate models, although not technically required for all.
Supplemental material
Gene set enrichment analysis
To define the enrichment of specific gene sets, either reflecting immune cell types (figure 2A) or specific oncogenic pathways (figure 2B), single sample gene set enrichment analysis (ssGSEA)37 was performed on the log2 transformed, normalized expression data. Immune cell-specific signatures as described in Bindea et al 13 were used as gene sets using this method to deconvolute immune cell abundance. Gene sets to define enrichment of specific tumor-related pathways were obtained from the multiple sources. We started with a selection of 24 Hallmark pathways,38 which are regularly expressed in cancer. Subsequently, only non-redundant IPA pathways were added to this collection (http://www.ingenuity.com, Ingenuity System, Redwood City, California, USA), resulting to the inclusion of 21 IPA pathways with minimal gene overlap. Finally, several pathways were added that have previously been hypothesized to associate with cancer immune phenotypes, including Hypoxia/Adenosine Immune Cell Suppression, immunogenic cell death, NOS1 Signature, PI3Kgamma signature and SHC1/pSTAT3 signatures as described by Lu et al,39 barrier genes as described by Salerno et al,40 the proliferation metagene as described by Miller et al 9 and genes upregulated in MAPK mutated breast cancer.41

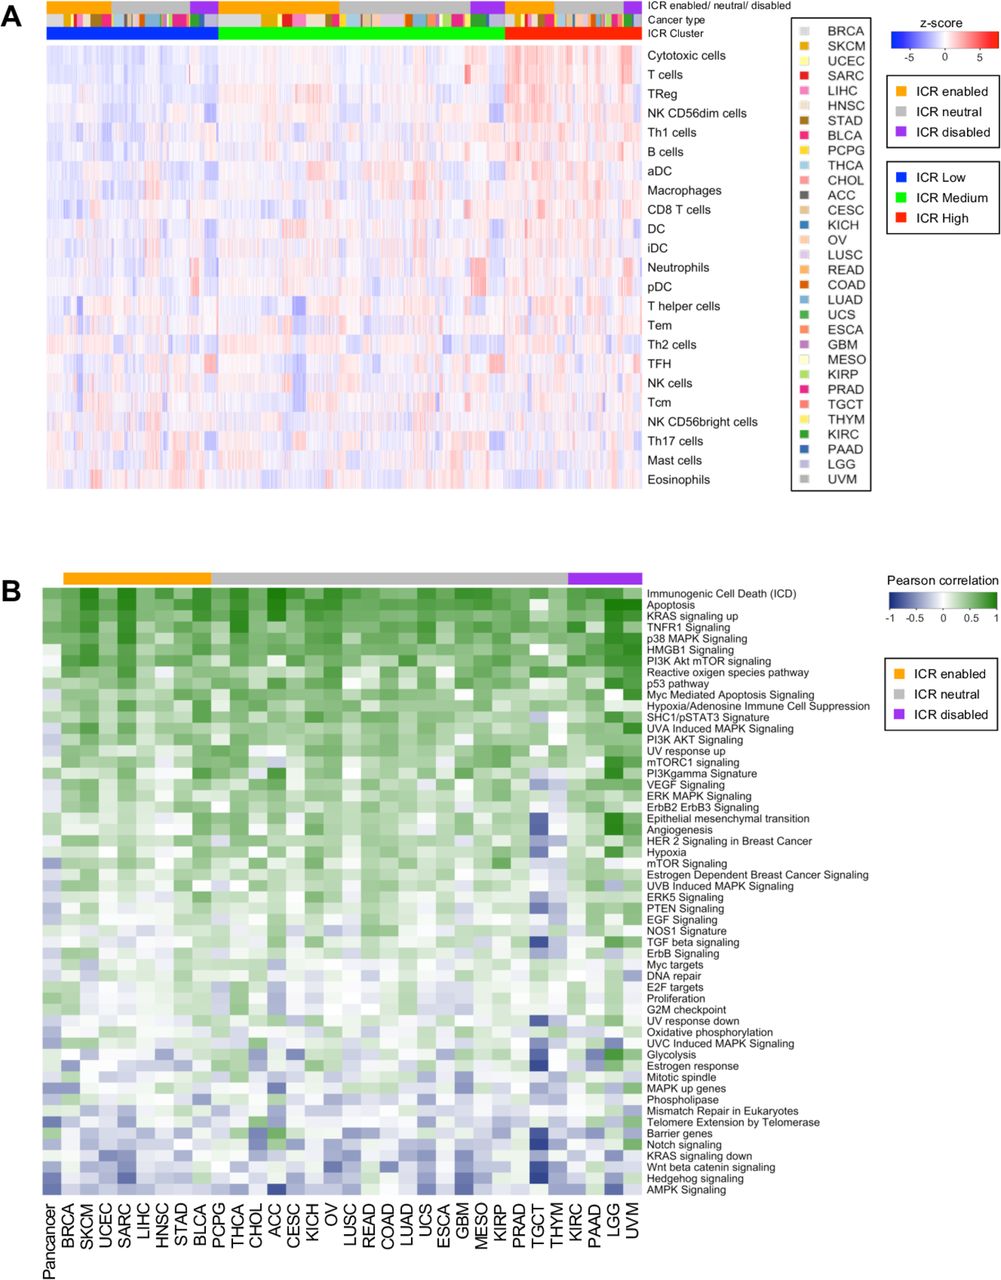
Deconvolution of immune cell populations and enrichment of oncogenic pathways through single sample GSEA. (A) Heatmap of enrichment values for cell-specific immune-signatures as described by Bindea et al.13 Samples are ordered by ICR cluster and ordered by cancer type within ICR clusters. (B) Pearson coefficient of correlation between ICR score and enrichment scores of oncogenic pathways per cancer. pathways that have a positive correlation with ICR are green and those with an inverse correlation are blue. GSEA, gene set enrichment analysis; ICR, immunologic constant of rejection.
Correlation matrix
The correlation matrices of ICR genes (online supplementary figure 2) and correlation between ICR score and enrichment score (ES) of selected pathways (figure 2B) were calculated using Pearson test and plotted using corrplot (V.0.84).
Somatic alteration analysis
Mutation rate and predicted neoantigen count data7 were log10-transformed and distribution across ICR clusters was plotted using R package ggplot2 (V.3.2.1). Differences between ICR high and low clusters were calculated through t-test, using a cut-off p<0.05. For specific mutation analysis, a set of 470 frequently mutated genes in cancer42 was selected. An elastic net regularized43 model was built to predict the ICR score as function of mutations in each sample and using the tumor-type as a covariate. The accuracy of the model was evaluated in a 10-fold cross-validation setting computing the correlation between the model prediction and the true ICR scores, finally obtaining a Spearman correlation of 0.669±0.012 (p<10-400).
The R package ComplexHeatmap (V.1.17.1) was used to plot ICR score ratios between mutated versus wild-type (WT) groups. For cancer type/gene combinations with a number of samples of <3 in the mutated group, ratios were not calculated (NA; gray color in plot). A ratio >1 implies that the ICR score is higher in the mutated group compared with WT, while a ratio <1 implies that the ICR score is higher in subset of tumors without mutation.
CNV analysis was performed for selected genes (PTEN and CTNNB1). For both genes, CNVs were categorized as deep deletions, hemideletions, WT, gain and amplification (GISTIC scores of -2,–1, 0, 1 and 2, respectively).32 For PTEN deletion, CNV-low versus CNV-high categories were also defined using a Log R ratio cut-off of −0.4, previously optimized in melanoma.44 Additionally, a focused CTNNB1 mutation analysis was performed by only selecting mutations in exon 3 (amino acids positions 29 to 49), for which strong functional data exists.45 Differences in ICR scores between PTEN/CTNNB1 somatic mutations and CNVs were assessed by t-test.
Aneuploidy
Aneuploidy scores for each individual cancer were taken from Taylor et al.46 Briefly, each tumor was scored for the presence of aneuploid chromosome arms after accounting for tumor ploidy. Tumor aneuploidy scores for each cohort were then compared with ICR scores via linear model with and without purity adjustment. Purity adjustment entailed correlating ICR score and tumor purity (as estimated via ABSOLUTE)47 and using the residuals to evaluate the postadjustment relationship between ICR score and tumor aneuploidy. In particular, we made use of the precomputed aneuploidy scores and ABSOLUTE tumor purity values. ICR and aneuploidy score associations were evaluated by linear model in R via the lm() function for each cohort independently. Purity adjusted ICR and aneuploidy score associations were evaluated by first modeling ICR score by tumor purity, then taking the ICR score residuals and assessing the association with aneuploidy score via linear model. Cohorts with model p values below 0.01 for adjusted or unadjusted ICR score and aneuploidy, regardless of the directionality of the association, were included in figure 3C.

Association of ICR with nonsilent mutation rate, predicted neoantigen load, and tumor aneuploidy. (A) Scatter plot of log transformed non-silent mutation count per ICR cluster for each cancer type. (B) Log transformed predicated neoantigen load per ICR cluster for each cancer type. (A, B) Red cross-bar represents the mean value per ICR cluster. Cancer types are ordered by mean nonsilent mutation count per cancer. Non-silent mutation rate and predicted neoantigen load were obtained from Thorsson et al.7 (C) Correlation between aneuploidy score and raw/purity adjusted ICR score for all cohorts with significant relationships between ICR and aneuploidy. ICR, immunological constant of rejection.
Differential GSEA and stratified survival analysis
Differential ES analysis between samples of ICR-enabled and those of ICR-disabled cancer types was performed using t-tests, with a cut-off of false discovery rate (FDR)-adjusted p value (ie, q-value)<0.05 (online supplementary table 1). Tumor intrinsic pathways that were differentially enriched between ICR-enabled and disabled cancer types were selected. The heatmap used for visualization of these differences was generated using the adapted heatmap.3 function.34 For each of these selected pathways, samples were categorized pan-cancer as pathway-High (ES >median ES) or pathway-low (ES <median ES). Associations between ICR and survival were defined for each pathway ‘high’ and pathway ‘low’ group separately using the survival analysis methodology as described above. Pathways for which a significant association between ICR and survival was present in one group, but not in the other one, were selected (online supplementary table 2). Similarly, these pathways were used to categorize samples per individual cancer type in pathway-high (ES >cancer specific median ES) and pathway-low (ES <cancer-specific median ES). Differences between HRs of groups in individual cancer types were calculated and plotted using ComplexHeatmap.
Supplemental material
Supplemental material
Predictive value ICR score in immune checkpoint datasets
ICR scores, or the mean expression of ICR genes, were compared between responders and non-responders to immune checkpoint therapy. For the Chen et al dataset, performed on Nanostring platform, ICR score was calculated using the 17 ICR genes available in the Nanostring panel. Difference in mean ICR score between groups was tested using two-side t-test (cut-off p<0.05). For datasets, GSE78220,28 GSE7822027 and Prat et al,48 the response category includes both partial and complete clinical responders according to respective publications. For the Chen et al dataset, clinical responders also included stable disease, as described by Chen et al.49 In the van Allen et al dataset, response was defined as patients with clinical response or long-term survival after treatment.31 Samples of the van Allen dataset were dichotomized based on median ES of (1) genes of the proliferation metagene and (2) TGF-ß signaling signature. Stratified analysis was performed in each of the categories. ICR high, medium and low groups were defined according to ICR score tertiles, to obtain groups of sufficient size. Stratified survival analysis was performed using the same approach as applied to the TCGA data.
Results
Prognostic impact of ICR classification is different between cancer types
RNA-seq data of samples from a total of 9282 patients across 31 distinct solid cancer types were obtained from TCGA. To classify cancer samples based on their immune orientation, we performed unsupervised consensus clustering for each cancer type separately based on the expression of the ICR immune gene signature. This signature consists of 20 genes that reflect activation of Th-1-signaling (IFNG, TXB21, CD8B, CD8A, IL12B, STAT1, and IRF1), CXCR3/CCR5 chemokine ligands (CXCL9, CXCL10, and CCL5), cytotoxic effector molecules (GNLY, PRF1, GZMA, GZMB, and GZMH) and compensatory immune regulators (CD274/PD-L1, PDCD1, CTLA4, FOXP3 and IDO1) (figure 1A).3 19 22 23 Expression of these genes showed a positive correlation with each other across all cancer types (online supplementary figure 2). The ICR signature highly correlates with other immune signatures that aim to reflect a highly active immune tumor microenvironment, including the tumor inflammation signatures (r=0.97)5 (online supplementary figure 3). As a representative example, consensus clustering and cluster assignment of SKCM is shown in figure 1A. Analogous figures for each of the 31 cancer types are available as cancer datasheets at Figshare (https://figshare.com/articles/Cancer_Datasheets/7937246).
As shown in figure 1B, the mean expression of ICR genes, or ICR score, varies between cancer types, reflecting general differences in tumor immunogenicity between cancers. While brain tumors (brain LGG and GBM) typically display low immunological signals,50 SKCM and head and neck squamous cell carcinoma (HNSC) display high levels of immune activation.7 51 52 In addition, the distribution of ICR scores among patients and the difference between the highest and lowest ICR scores varies between cancers. Accordingly, the proportions of patients assigned to specific ICR clusters are dependent on the cancer type. Even more clinically relevant, the relation of the different immune phenotypes to survival is dissimilar among cancer types (figure 1C,D). While the ICR high phenotype (hot) shows a significant survival benefit compared with the ICR low phenotype (cold) for various cancer types (Breast Invasive Carcinoma (BRCA), SKCM, Uterine Corpus Endometrial Carcinoma (UCEC), Sarcoma (SARC)), the ICR high cluster is associated with significantly reduced OS in other cancer types (UVM, LGG, Pancreatic Adenocarcinoma (PAAD), Kidney Renal Clear Cell Carcinoma (KIRC)) (figure 1C). Similar results were obtained when Cox regression analysis was performed on ICR score as a continuous variable (online supplementary table 3). To explore biological differences in cancer types in which a highly active immune phenotype is mostly associated with favorable survival, versus cancer types in which this phenotype is mostly associated with decreased survival, we categorized cancer types in ICR-enabled (BRCA, SKCM, UCEC, SARC, Liver Hepatocellular Carcinoma (LIHC), HNSC, Stomach Adenocarcinoma (STAD), Bladder Urothelial Carcinoma (BLCA)) and ICR-disabled (UVM, LGG, PAAD, KIRC) groups, respectively (figure 1C). All other cancer types in which ICR did not show an association or trend were categorized as ICR neutral. Of important note, this classification was used for explorative purposes, and a role for the immune-mediated tumor rejection cannot be precluded in ICR-neutral cancer types as their classification be the result of not-ideal survival follow-up or limited power.
Supplemental material
In case of SKCM, tSNE plots on the whole RNA-seq matrix showed that melanoma samples (either primary or metastatic) have a distinct transcriptional pattern as compared with other tumor types, confirming that cell-of-origin origin patterns drive the molecular classifications of solid tumors53 (online supplementary figure 4). However, a certain degree of segregation between metastatic and primary lesions was observed, and ICR score was significantly higher in metastatic lesions. When survival analysis was stratified according to SKCM status, similar results were obtained in primary and metastatic tumors, despite the low sample size of the SKCM-primary group. These findings justify the inclusion of both SKCM categories in the enabled tumors. Aggregate analysis for ICR-enabled and ICR-disabled tumor types using ICR categories defined by a pan-cancer clustering approach (see the Methods section) returned similar results as compared with the ones obtained using the per-cancer ICR clustering (online supplementary figure 5).
We explored whether the ICR scores and their distributions were different among these defined groups of cancer types. Mean ICR score is low for most ICR-disabled (ranging from 3.97 to 8.34) compared with ICR-enabled cancer types (ranging from 7.26 to 8.36) (online supplementary figure 6A). This observation is most noticeable for ICR-disabled cancer types LGG and UVM. Moreover, the difference (delta) between ICR scores in ICR high compared with ICR low groups is higher in ICR-enabled cancer types (range: 2.98–4.97) compared with ICR-neutral (range: 1.48–4.49) and ICR-disabled cancer types (range: 2.29–3.35) (online supplementary figure 6B). To evaluate whether the differences in the dynamic range of the ICR score in ICR-enabled versus ICR-disabled cancers, could negatively impact correlative analyzes and lead to spurious associations, the coefficient of variation (SD/mean) was calculated for each cancer type (online supplementary figure 6C,D) and plotted in relation to the ICR score. ICR distribution was simil-Gaussian in all cancer types, although in LGG was slightly skewed to the left. ICR score dispersion (represented by the coefficient of variation) was the highest in LGG and UVM, which had overall low values of ICR. It is possible that in these tumors the quantification of ICR score is less accurate compared with other tumors due to the scant leukocyte infiltration. Still, the acceptable data distribution of ICR score in each tumor type reassures validity of downstream analyzes.
To define whether tumor stage or grade (for LGG and GBM) might interact with the association between ICR and OS, we fitted a Cox proportional hazards model for each group of ICR-enabled, ICR-neutral and ICR-disabled cancer types (table 1). Overall, including ICR high and ICR low samples from all cancer types, ICR has significant prognostic value independent of AJCC pathologic stage/grade. For ICR-enabled cancer types, the ICR high group also remains significantly associated with improved survival after adjusting for tumor pathologic stage. For ICR-disabled cancer types, ICR high was associated with worse survival in univariate analysis (HR <1). However, in multivariate models, this negative prognostic value of ICR was mostly lost (HR 0.7702; 95% CI 0.591 to 1.005, p=0.054). Kaplan-Meier plots stratified by pathologic stage showed that within individual pathologic stages, ICR was not associated with OS for ICR-disabled cancers (online supplementary figure 7.1). In fact, in the ICR-disabled tumors (but not in the ICR-enabled ones), ICR was significantly higher (p=10 e-7) in advanced versus early stages (online supplementary figure 7.2). Similarly, a progressive enrichment of ICR high samples was observed with more advanced stages/grades in the ICR-disabled tumors UVM and KIRC, and in LGG with more advanced grades.
Univariate and multivariate overall survival Cox proportional hazards regression including ICR cluster and stage, in all samples, ICR-enabled, ICR-disabled and ICR-neutral samples
For ICR-neutral cancer types, while ICR was not associated with survival in univariate analysis, multivariate analysis indeed identified a positive prognostic value of the ICR classification, though less robust than observed for ICR-enabled cancer types.
Similar results were obtained by using Cox multivariate models stratified by stage/grade in consideration of the significant violation of the HPA for this variable in the models including the entire cohort or the enabled and neutral tumors.
ICR reflects antitumor immune activity and is inversely correlated with tumor-related pathways associated with immune escape
To further explore differences between cancer types, we aimed to compare the density of leucocyte subpopulations between ICR high and low samples across cancers. Gene expression signatures specific to 24 cell types13 were used to deconvolute the abundance of immune cells in tumor samples by performing ssGSEA.37 Cell-specific ESs for each patient demonstrated a clear enrichment of transcripts specific to T and B cells in ICR high patients (figure 2A). More specifically, ICR high samples showed increased expression of transcripts associated with cytotoxic T cells, T-regulatory (T-reg) cells, Th-1 cells, NK CD56dim cells, activated dendritic cells (DC) and macrophages, compared with ICR medium and ICR low samples. This observation is consistent across cancer types, in both ICR-enabled and ICR-disabled cancers. So, in addition to the immune functional molecular orientation, the ICR gene signature is a good reflection of overall antitumor immune cell infiltration.39 To quantitatively compare immune cell enrichment between individual cancer types, the mean ES was calculated for each cancer type (online supplementary figure 8). Overall, no single consistent difference in terms of immune cell enrichment can be observed that can discriminate ICR-enabled from ICR-disabled cancer types. Lower grade glioma (LGG) and UVM show an overall low immune infiltration, consistent with our reported low ICR scores.
We then proceeded to examine which tumor intrinsic attributes correlate with immune phenotype as reflected by ICR gene expression. We performed ssGSEA to identify enrichment of transcripts of common tumor-related pathways.22 39 40 Not surprisingly, immune-related pathways including TNFR1 Signaling and ICD showed a strong positive correlation with expression of ICR genes (figure 2B). This implies that our immune signature captures the antitumoral immunological processes well across a wide range of cancer types. Interestingly, a few pathways were identified that inversely correlated with ICR gene expression, potentially representing mechanisms by which immune silent tumors develop their phenotype. These pathways include WNT -β catenin,54 55 barrier genes,40 AMPK (5' AMP-activated protein kinase) signaling,56 mismatch repair, telomerase extension by telomerase, Notch signaling and Hedgehog signaling pathways. Of special note, genes that we previously found to be upregulated in MAP3K1/MAP2K4-mutated versus WT breast cancer which perfectly segregated ICR high versus low samples in the BRCA TCGA cohort (MAPK (mitogen-activated protein kinase)-up genes),22 were also inversely correlated with ICR in a significant proportion of cancers (ie, Adrenocortical carcinoma (ACC), THYM, glioblastoma multiforme (GBM), LGG and TGCT).
Characterization of tumor mutational load and aneuploidy in relation to ICR immune phenotypes
Next, we aimed to identify genomic attributes related to the ICR immune phenotypes.
As previously observed,7 mean neoantigen count of each cancer type strongly correlated with mean mutation rate (online supplementary figure 9A,B). While mean non-silent mutation rate was significantly higher in ICR high tumors for some cancer types, no clear association was observed in most of them. Results for predicted neoantigen load were similar (figure 3A,B and online supplementary figure 9C,D). Overall, mean non-silent mutation rate and mean neoantigen load were higher in ICR-enabled cancers compared with ICR-disabled cancers. However, these differences cannot fully explain the divergent association of ICR with survival, as values for ICR-enabled cancers SARC and BRCA are in the same range as ICR-disabled cancers LGG, PAAD and KIRC.
Similarly, we studied the association between genomic instabilities, or aneuploidy and ICR. Specifically, we compared the individual tumor aneuploidy score and the ICR score across cohorts. Aneuploidy score was calculated as in Taylor et al.46 As has been reported previously, we found a broad negative association between aneuploidy and unadjusted or tumor purity adjusted ICR score57 (figure 3C). Interestingly, this negative association was most strongly supported in ICR-enabled cancers, with six cancers out of eight showing a significant negative association between aneuploidy score and purity adjusted ICR (p<0.01). In ICR-neutral cancers, a small fraction of cancer types showed a negative association (4 of 18, with an additional 4 showing a non-significant but suggestive negative association). Three cohorts (GBM, Kidney Chromophobe (KICH) and Prostate adenocarcinoma (PRAD)) showed a suggestive positive association. Similarly, in the ICR-disabled cohorts only KIRC showed a significant negative association, while LGG showed a strongly significant positive association (p<10-8).
Specific mutations associate with ICR immune phenotypes
To define the association of specific oncogenic mutations with ICR immune phenotypes, we first selected a set of 470 frequently mutated genes in cancer,42 then trained an elastic net43 model to predict the ICR score as function of mutations in each sample and using the tumor type as covariate. The positive non-zero coefficients of the trained model were used to identify genes whose mutation are associated with an increase of the ICR and negative non-zero coefficients identify the genes whose mutations are associated to a decrease of the ICR score (figure 4A,B). The use of tumor type as covariate tends to limit the effect of the enrichment of mutations in specific cancer types and their correlation with ICR score. The coefficients of the tumor type were all different from zero, with the exception of BLCA, BRCA, Cholangiocarcinoma (CHOL), Colon Adenocarcinoma (COAD), Rectum adenocarcinoma (READ) and SARC and retained in the final model. We evaluated the accuracy of the model in a 10-fold cross-validation computing the correlation between the model prediction and the true ICR scores and obtaining a Spearman correlation of 0.669±0.012 (p<10-400). Genes associated with a decrease of ICR score include: FOXA2, NSD1, PSIP1, HDAC3, ZNF814, FRG1, SOX17, CARM1, GATA3, FKBP5, FGFR3, MAT2A, PPP2R5A, MECOM, SMAD2, MED17, WNT5A, KRAS, ADAM10, PRKAR1A, DIS3, PRRX1, MFNG, TNPO1, SPOP, KDM6A, EGFR, IRF7, NRAS, SUZ12, RPSAP58, SF3B1, THRAP3, SH2B3, APC, NTN4 and FOXA1.
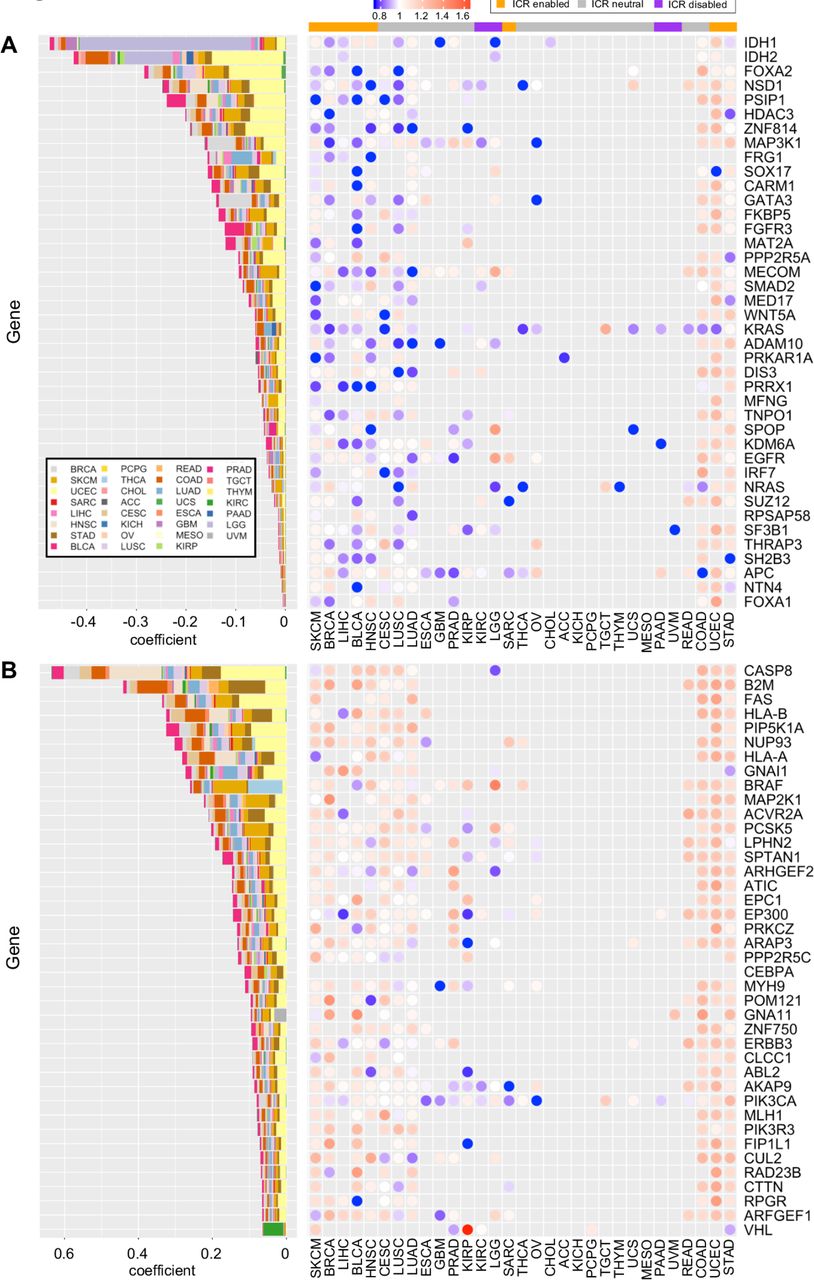
Relationship between ICR score and mutations in individual genes. Mutated genes with negative (A) and positive (B) non-zero coefficients identified by a trained elastic net model. Contributions of each individual cancer type to the coefficient in trained elastic net model are proportionally indicated by size of the bars. Ratio of mean ICR score in mutated samples and ICR score in WT samples (right panels). Cancer types are ordered manually based on patterns of calculated ratios. ICR, immunological constant of rejection; WT, wild type
Interestingly MAP3K1 mutations, whose effect on ICR low has been described in breast cancer,22 were also associated to ICR low tumors pan-cancer. The top genes of which mutations positively correlate with ICR reflect immune-evasion mechanisms that follow immunological pressure such as mutations of antigen-presenting machinery transcripts previously described (ie, B2M, HLA-A, HLA-B and CASP8).12
To better compare the association between specific mutations and ICR groups within individual cancer types, we calculated, for each of the identified genes, the mean ICR score in the mutated group divided by the mean ICR score in the WT within each individual cancer type. For most cancer types, the genes with a positive coefficient consistently showed a higher ICR score in mutated samples, supporting their association with an ICR high phenotype (figure 4A,B, right panels). On the other hand, genes with a negative coefficient (genes associated with an ICR low phenotype) as identified at the pan-cancer level, do show some clear deviations between cancer types. While for most cancer types, ICR score is indeed lower in the mutated group, results for cancer types COAD, UCEC and STAD show the reverse (figure 4A–B, right panels). Interestingly, a common characteristic of these three cancer types is frequent hypermutation as a consequence of microsatellite instability (MSI).58 This hypermutator phenotype could be responsible for the observed increased ICR score in the mutated group, as the genes with negative coefficient could be mutated in the context of hypermutation. We indeed observed an increased ICR score in the MSI-high group compared with MSI-low and microsatellite stable groups in COAD and STAD datasets for which sufficient data on MSI status were available58 (online supplementary figure 10A,B).
Mutated genes were frequently part of multiple pathways, suggesting impact on various tumor biological systems (online supplementary figure 11).
PTEN and CTNNB1 somatic alterations (either mutations or CNVs) have been associated with differential response to immunotherapy (PTEN)44 59–62 and intratumoral immune response (PTEN 44 and CTNNB1).45 63 As these genes were not selected by our model, we assessed them individually (online supplementary figures 12,13).
As for PTEN, a statistically significant association was found between low ICR score and decreased copy number in eight cancer types (including SKCM) and in the aggregate pan-cancer analysis by comparing PTEN CNV-low versus PTEN CNV-high samples (Log R ratio cut-off of −0.4, see the Methods section) (online supplementary figure 12). Less pronounced trends were observed using a classification based on five GISTIC CNV categories (deep deletion, hemideletion, WT, gain and amplification). PTEN mutations, however, were associated with higher ICR score in four individual cancer types (LGG, BRCA, COAD and Lung Adenocarcinoma (LUAD)) and in the pan-cancer analysis (online supplementary figure 12). As for CTNNB1, a significant association between higher copy number and lower ICR was found in five cancer types (KIRP, Ovarian Cancer (OV), BLCA STAD and TGCT). Such association was detected also in the pan-cancer analysis, but it was lost after normalizing ICR score within cancer type (online supplementary figure 13). CTNNB1 mutations (either in all positions or in exon 3) were associated with lower ICR in ACC, with a non-significant trend in SKCM, PRAD and LGG (online supplementary figure 13). No statistically significant associations between CTNNB1 and ICR scores were observed pan-cancer.
Prognostic impact of ICR classification is dependent on the expression of cancer-related pathways
Although we observed interesting differences between ICR high and ICR low immune phenotypes across different cancer types, these do not explain the divergent association between immune phenotype and survival as we observed in ICR-enabled versus ICR-disabled cancer types (figure 1C,D). As previously stated, an active immune phenotype has different impacts on survival depending on molecular subtype (eg, breast cancer9). To examine tumor intrinsic differences between ICR-enabled and ICR-disabled cancer types, we compared the enrichment of tumor intrinsic pathways between these two groups. Differentially enriched pathways (t-test; FDR<0.05; online supplementary table 1) between ICR-enabled and disabled cancer types were selected and used for pan-cancer hierarchical clustering. Interestingly, a wide variety of pathways were differentially enriched between both groups. Whereas enrichment for pathways involved in proliferation were mostly upregulated in ICR-enabled cancer types (proliferation metagene,9 E2F targets, G2M checkpoints and mismatch repair), a large number of tumor intrinsic pathways (n=43) were enriched in ICR-disabled cancer types. Visualization of ES for these pathways across different cancer types in a heatmap confirms these findings. Hierarchical clustering based on ES of tumor intrinsic pathways differentially dysregulated by ICR-enabled and ICR-disabled cancer types segregates specimens into two main clusters (figure 5A). As anticipated, pan-cancer survival analysis of all samples that formed a cluster along with samples of the ICR-disabled cancer types, named the ICR non-beneficial cluster, revealed no survival benefit of a high ICR expression. On the other hand, survival analysis of all samples in the other cluster, named the ICR beneficial cluster, showed a clear survival benefit for ICR high samples (figure 5B). Of note, the prognostic significance of ICR was higher in this ICR beneficial cluster (HR 1.82; p =4.13-9; 95% CI 1.49 to 2.23) compared with the prognostic significance of all samples of ICR-enabled cancer types combined (HR 1.63, p=2.26-8; 95% CI 0.88 to 1.14), suggesting that tumor intrinsic attributes beyond the tumor site of origin are important to determine the relevance of cancer immune phenotypes. Interestingly, samples from ICR-neutral cancers, in which no clear trend was observed between ICR and survival (figure 1C), and which were not used in calculation of differentially enriched pathways, were divided across the ICR beneficial and ICR non-beneficial clusters. To evaluate whether the prognostic impact of the ICR was relevant to a subset of samples from ICR-neutral cancer types, subgroup analysis was performed for samples of ICR-neutral cancer types. Indeed, for all samples from ICR-neutral cancer types that clustered to the ICR non-beneficial cluster, ICR was not associated with survival. On the other hand, for samples of ICR-neutral cancer types which clustered to the ICR beneficial cluster, ICR showed a significant positive association with survival (figure 5C), indicating that the ICR has prognostic relevance in this subgroup of cancer patients as well.
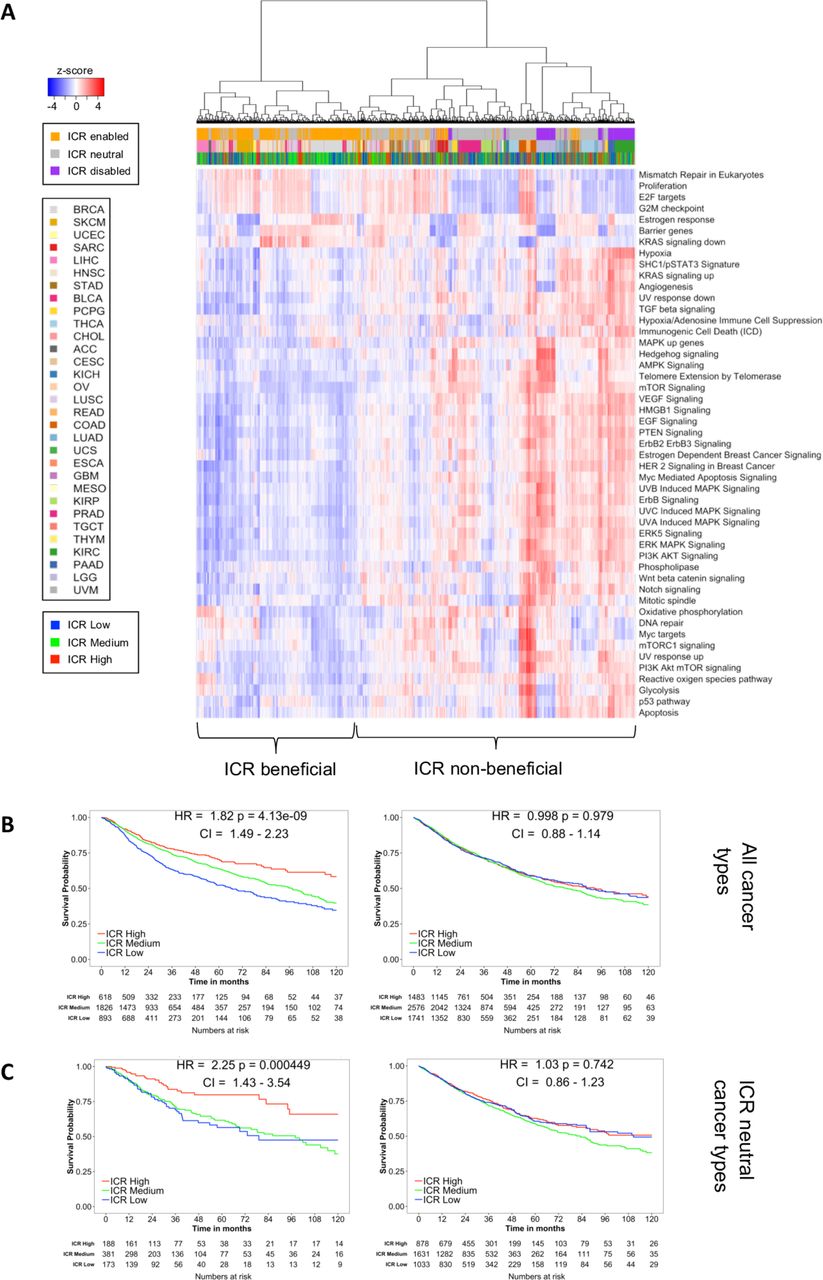
Pan-cancer clustering based on oncogenic pathway enrichment segregates ICR-enabled and ICR-disabled cancer types. (A) Heatmap of enrichment scores of selected oncogenic pathways, samples are hierarchically clustered in two main clusters: one cluster consists mostly of ICR-enabled cancer types (ICR beneficial cluster), while the second cluster contains all samples from ICR-disabled cancer types (ICR non-beneficial cluster). (B) Kaplan-Meier OS curves for ICR high, medium and low clusters for samples in the ICR beneficial and ICR non-beneficial cluster separately. (C) Subgroup survival analysis of all samples of ICR-neutral cancer types clustered in the ICR beneficial cluster and ICR non-beneficial cluster. ICR, immunological constant of rejection; OS, overall survival.
To better clarify this concept, we selected two of the differentially expressed pathways that were of special interest. First, the proliferation signature was used to classify all samples independent of tumor origin in proliferation-high and proliferation-low categories, defined as an ES value >median or <median of all samples, respectively. This 52-gene cluster described by Nagalla et al 10 has previously been associated with the prognostic value of immune gene signatures in breast cancer.9 As represented by a histogram, the proportion of samples with high proliferation signature enrichment was larger in ICR-enabled cancer types compared with ICR-disabled cancers (figure 6A). This very basic binary classification was already capable of segregating samples in a group in which ICR has a positive prognostic value from a group in which ICR is not associated with survival (figure 6B). As a second illustration, TGF-ß signaling was used to classify samples based on this pathway using the same approach. For this oncogenic pathway, ICR-enabled cancer types typically had a lower enrichment of this pathway compared with ICR-disabled cancer types (figure 6C). This classification could also divide samples in a group in which ICR has a positive association with survival and a group in which this association is absent (figure 6D).

Examples of pan-cancer binary classifications based on enrichment of individual tumor intrinsic gene signatures and corresponding stratified pan-cancer survival analysis. (A) Histogram showing pan-cancer classification based on median pan-cancer enrichment value of the proliferation signature as described by Miller et al 9 (Proliferation low: ES is lower than median ES observed pan-cancer; proliferation high: ES is higher or equal to median ES observed pan-cancer). (B) Pan-cancer Kaplan-Meier curves of ICR groups stratified by proliferation high (left panel) and proliferation low (right panel) groups corresponding to classification as shown in panel A. (C) Histogram showing pan-cancer classification based on pan-cancer enrichment values of the hallmark pathway TGF-ß signaling. (D) Pan-cancer Kaplan-Meier curves stratified by TGF-ß signaling-low (left panel) and TGF-ß signaling-high (right panel) groups corresponding to classification as shown in panel C. ES, enrichment score; ICR, immunological constant of rejection; TGF-ß, transforming growth factor beta.
As proliferation positively correlates with tumor mutational load (Pearson’s correlation coefficient=0.49) (online supplementary figure 14), we investigated whether tumor proliferation independently contributes to the prognostic value of ICR. Therefore, we segregated pan-cancer samples in four categories based on both mutation rate and proliferation (online supplementary figure 15). Interestingly, in the proliferation high group, ICR high was associated with significantly improved survival independent of mutation rate. A similar observation is made for the mutation rate high group, ICR high is associated with better survival independent of proliferation. These finding suggest that mutation rate and enrichment of proliferation-related transcripts provide additive information to define the prognostic value of ICR. Furthermore, in a multivariate Cox proportional hazards model including ICR classification, proliferation, TGF-ß signaling, tumor mutation rate, stage/grade and aneuploidy, all parameters but aneuploidy remain statistically significant (online supplementary table 4; ICR: p=1.73e-6, proliferation, p=4.44.e-12, TGF-ß signaling, p=1.64e-12, stage/grade <2e-16, mutational rate p=2.6e-03). Similar results were observed within the ICR-enabled tumors, where ICR, stage, proliferation and TGF-ß signaling remained significant while only proliferation, TGF-ß signaling and stage/grade were significant in ICR-disabled tumors. Superimposable results were obtained when the Cox multivariate models were stratified by ‘Stage/grade’, which was the only variable that demonstrated a significant violation of the HPA (stratified multivariate Cox models, online supplementary table 4). Moreover, similar results were returned by normalizing continuous covariates by cancer types (online supplementary table 4).
Supplemental material
This confirms the conditional prognostic role of ICR according to oncogenic pathway dispositions.
We then continued by verifying whether these tumor intrinsic attributes that interact with the prognostic impact of ICR when evaluated pan-cancer, could also translate to individual cancer types. For each individual cancer type, samples were divided by median ES for each of the selected pathways. ICR HRs (ICR low vs ICR high) were compared between each pathway-high and pathway-low group for each cancer type (online supplementary figure 16A,B). Overall, we indeed observed an increased HR for samples with a high enrichment of ICR enabling pathways for most cancer types. For samples with a high enrichment of ICR disabling pathways, the HR was indeed lower (online supplementary figure 16C).
These data confirm an association between the prognostic impact of ICR classification and enrichment of oncogenic pathways in individual cancer types as well as pan-cancer. Of note, these interactions between the prognostic significance of ICR and tumor intrinsic pathways were mostly present in enabled and neutral cancer types. Within disabled cancer types, with the exception of KIRC, similar associations were not found.
Predictive value of ICR score in immune checkpoint therapy is dependent on proliferation and TGF-ß signaling
To define the clinical relevance of classification of ICR immune phenotypes, in the setting of immune checkpoint treatment, we first evaluated the predictive value of ICR score across multiple public datasets of anti-CTLA4 and anti-PD1 treatment. A significantly increased expression of ICR in responders compared with non-responders was observed across most of the datasets (figure 7A).27 28 31 48 49 The conditional activation of the prognostic impact of the ICR was tested in the Van Allen dataset, which was the only one for which survival information was available. Strikingly, in the proliferation-high subgroup, ICR score was significantly higher in pretreatment samples of patients with long-survival or response (p=0.021), whereas this difference was not significant in proliferation low samples (figure 7B). Cohort dichotomization based on TGF-ß signaling, again demonstrated the reverse trend: a significant difference in ICR score was only observed in the TGF-ß-Low group (p=0.0044), not in the TGF-ß-high group. Stratified survival analysis in these categories confirmed that the prognostic impact of ICR depends on proliferation and TGF-ß signaling (figure 7C). These findings confirm a conditional prognostic and predictive impact of ICR-based immune infiltration estimates in the setting of immune checkpoint treatment and demonstrate that these findings might have important clinical implications.

Conditional predictive value of ICR for response to immune checkpoint treatment. (A) Predictive value of ICR across public datasets with response to immune checkpoint treatment indicated by p value of two-sided t-test comparing ICR score in samples of responding versus non-responding patients. ICR score was highest in response group for all significant comparisons. Response was defined as long-survival or response in the Van Allen dataset, stable disease, partial response (PR) and complete response (CR) in the Chen dataset, and as PRCR in Riaz, Hugo and Prat datasets. (B) Boxplot of ICR score in ‘non-response’ compared with ‘long-survival or response’ to anti-CTLA4 treatment in van Allen dataset (left). Boxplots of subgroup analysis of proliferation groups (middle) and TGF-ß signaling groups (right). P value of t-test comparing means are indicated in the plot. (C) Kaplan-Meier curves showing os across ICR tertiles in all samples (left), across proliferation (middle), and TGF-ß signaling subgroups (left). ICR, immunological constant of rejection; TGF-ß, Transforming growth factor beta.
Discussion
Understanding the relationship between cancer cells and the host bearing the disease is of paramount importance for developing more efficient therapeutic approaches and stratification systems.64 In our pan-cancer systematic analysis, we demonstrated, for the first time, that the prognostic impact of Th-1/cytotoxic transcripts used to characterize hot/immune active tumors is restricted to tumor characterized by distinct oncogenic dysregulations. Furthermore, we identified novel and robust relationships between cell-intrinsic and immunologic signaling pathways consistent across different cancer types.
Transcriptional signatures used to define the continuum of cancer immune surveillance and the functional orientation of a protective antitumor immunity typically reflect common immune processes and include largely overlapping genes.14 15 18 19 22 65–68 We termed this signature as the ICR.3 14 22–24
Across and within different tumors, the coordinated overexpression of ICR genes identifies a microenvironment polarized toward a Th-1/cytotoxic response, which was then used to define the hot/immune active tumors.
In tumor types with medium/high mutational burden, the mutational or neoantigenic load tended to be higher in hot (ICR high) versus cold (ICR low) tumors while this association was not observed within cancer types with overall low mutational burden. By adding granularity to previous observations that described an overall weak correlation between immunologic correlates of antitumor immune response and mutational load,5 7 12 69 70 we demonstrated here that the differences in term of mutational load was especially evident in tumors types known to be constituted by a significant proportion of microsatellite instable cases, such as COAD, STAD and UCEC. It is likely that, in hypermutated tumors, the excess of neoantigens plays a major role in the immune recognition, while in the other cases, additional mechanisms such as cell-intrinsic features, play a major role in shaping the anti-tumor immune response.22 Overall, a high mutational/neoantigen load was neither sufficient nor necessary for displaying an active immune microenvironment.
When the ICR score was intersected with the enrichment of oncogenic signals as predicted by the transcriptional data, interesting associations emerged. Although some differences in terms of the degree of the correlation were observed across cancers, few tumor-cell intrinsic pathways displayed a coherent progressive enrichment in the immune-silent tumors. The top pathways associated with the absence of the Th-1/hot immune phenotype included, barriers genes, WNT-ß catenin, mismatch repair, telomerase extension by telomerase, Notch, Hedgehog and AMPK signaling pathways. Barrier genes encode for molecules with mechanical barrier function in the skin and other tissues and include filaggrin, tumor-associated calcium signal transducer 2, desmosomal proteins (DST, DSC3, DSP, PPL, PKP3 and JUP).40 Their expression was associated with a T-cell excluded phenotype in melanoma and ovarian cancer,40 and here, we extended our previous observation across multiple tumors. The cell-intrinsic WNT-ß catenin activation impairs CCL4-mediated recruitment of BATF3-dependent DCs, followed by absence of CXCL10 mediated T-cell recruitment, and was described initially associated with T-cell exclusion in melanoma, and recently, in other tumor types.45 63 CTNNB1 somatic alterations leading to WNT-ß catenin activation (ie, amplifications and somatic mutations preventing proteolytic ß-catenin degradations) have been associated with a non-T cell inflamed immune phenotype in melanoma and across different tumor types.45 63 Interestingly, neither the elastic model nor the single-gene level analysis selected CTNNB1 mutations in relationship to ICR expression, while associations between CTNNB1 amplifications and low ICR score were observed across several cancer types. Similarly, no associations between CTNNB1 mutations and intratumoral immune response were detected by two pan-cancer studies assessing an immune signature closely related to ICR and the level of cytolytic activity (PRF1 and GZMA).12 70 Differences might be related to the approach selected for the analysis (ie, using continuous vs categorical variables and different metrics to quantify the immune response). Interestingly, in addition to a negative (although modest) correlation between ICR score and mutations of APC (an inhibitor of the WNT-ß catenin pathway),45 we detected a stronger correlation between WNT5A mutations and decreased ICR score. High expression of WNT5A has been associated with decreased response to immune checkpoint inhibition in melanoma.27 However, associations between the WNT5A mutations and decreased intratumoral immune response were not previously checked in WNT-ß catenin-focused analyzes.45 63 The correlation between WNT5A mutations and immune suppression might deserve mechanistic investigation considering the complexity of this pathway. In fact, tumor-cell-derived WNT5A has recently been described to induce immune suppression by activating ß-catenin pathway in DC resulting in IDO transcriptional expression and T-reg generation.71
Loss of PTEN (a negative regulator of the PI3K-AKT pathway), due to somatic mutations or deletions has been associated with decreased response to checkpoint blockade in melanoma, glioblastoma, lung cancer and uterine sarcoma.59–62 In melanoma, PTEN deletions have been associated with reduced T-cell infiltration.44 We extended this observation across different tumor types. Paradoxically, PTEN mutations have not been associated with decreased intratumoral immune infiltration12 70 but rather with an increased leukocyte fraction across tumors,7 and an increased expression of immune-suppressive signature in glioblastoma.59 Consistently, PTEN mutations were found to be associated with higher ICR score across cancers when PTEN mutational status was evaluated as a single variable. The lack of selection of PTEN mutations by the elastic model might be explained by the co-occurrence with mutations in other genes with higher coefficient selected by the model.59 Overall, these findings suggest a differential immune-regulatory role of PTEN mutations and deletions.
The efficiency of our approach in capturing previously described oncogenic pathways indicates the robustness of the analysis. At the same time, our integrative pipeline unveiled additional relevant pathways: telomere extension by telomerase and mismatch repair, Notch, Hedgehog and AMPK signaling. Our findings suggest that the lack of expression of transcripts involved with mismatch repair, in addition to their genetic integrity,72 might influence immunogenicity. Telomere dysfunctions result in various disease, including cancer and inflammatory disease.73 To our knowledge, this is the first time that telomerase activity has been linked to differential intratumor immune response. The Notch pathway can regulate several target genes controlled by the NFκB, TGF-β, mTORC2, PI3K and HIF1α pathways74 and is involved in the induction of cancer stem cells, but has not been described to be associated with differential intratumoral immune response so far. As for the Hedgehog pathway, in breast cancer models, inhibition of this signaling induces a marked reduction in immune-suppressive innate and adaptive cells paralleled with an enrichment of cytotoxic immune cells.75 Intriguingly, the AMPK pathway was the most coherently dysregulated pathway in relationship to the ICR score. In lung cancer mouse models, the deletion of Lkb1, an upstream modulator of AMPK pathway, was associated with decrease T-cell tumor infiltration, and impaired production of pro-inflammatory cytokines, which was mediated by induction of STAT3 and IL-6 secretion.76 77 The strength of the inverse association between the AMPK pathway and ICR score strongly calls for in-depth investigation of the immune-modulatory role of this pathway. Overall, we identified novel putative hierarchically relevant cancer-cell intrinsic pathways associated with immune evasion mechanisms in humans that might warrant further mechanistic investigations and that might be explored as targets for reprogramming the tumor microenvironment.
The biological relevance here is substantiated by the consistency of the associations across tumor types, in which each cohort can be seen as an independent validation. The coherence of the associations rules out the possibility of a spurious correlation.
As for somatic mutations, the top ten genes associated with the immune silent phenotype include IDH1, IDH2, FOXA2, NSD1, PSIP1, HDAC3, ZNF814, MAP3K1, FRG1 and SOX17. Findings of IDH1 and NSD1 are consistent with the report of Thorsson et al,7 in which these have been associated with decreased leukocyte infiltration, and are complemented here by additional identification of IDH2. Interestingly, MAP3K1 mutations were previously associated with low ICR in breast cancer in our previous work.22 41 Remarkably, mutations of other genes of the RAS/MAPK pathways such as FGFR3 (previously associated with T-cell exclusion in bladder cancer78 and diminished leukocyte infiltration pan-cancer7), EGFR, NRAS and KRAS were associated with a low ICR score, substantiating their potential role in mediating immune exclusion. FOXA2 is involved in both neoplastic transformation and epithelial-mesenchymal transition79 and Th differentiation80 but its role in modulating antitumor immune response is unknown. Similarly, no data exist on the effect of HDAC3, PSIP1 and ZNF814 on tumor immunogenicity. Considering the strength of the association, further investigations should mechanistically address the role of these signaling pathways in mediating immune evasion mechanisms. Other mutations associated with the immune silent phenotype include WNT5A, corroborating the immune-suppressive role of the WNT ß catenin pathway 45 and GATA3, which was also previously associated with low leukocyte infiltration.7 Mutations of FKBP5, MAT2A, PPP2R5A, MECOM, SMAD2, MED17, ADAM10, PRKAR1A, DIS3, PRRX1, MFNG, TNPO1, KDM6A, IRF7, SUZ12, RPSAP58 and SF3B1 represent additional novel findings. Similar to previous observations, we found HLA-A, HLA-B, B2M, CASP8 and FAS to be associated with an ICR High immune phenotype.7 12 70 81 82 These mutations are probably the result of immune escape mechanisms triggered by immunologic pressure.
B2M mutations have been associated with disease progression following immune checkpoint therapy.83–86 In immune-active tumors (ICR high), the immunological pressure might have limited the chance of seeding metastases in distant organs. The occurrence of B2M mutations might indicate an early phase of immune editing, which however did not completely compromise the protective effect of the immunological pressure at this early phase of tumor evolution. This is consistent with recent observations in colon cancer,87 in which immune-edited metastases have a decrease risk of relapse as compared with the non-immune edited ones.
As for genomic instability, tumors with high aneuploidy are associated with decreased ICR score in a major subset of cancer types.57 This observation is also in agreement with negative association of a chromosome-instable type with an immune signature that predicts response to immunotherapy with MAGE-A3 antigen as well as response to anti-CTLA-4 treatment in melanoma.70 The only exceptions we found were brain tumors LGG and GBM in which a positive association between aneuploidy and ICR score was detected. In LGG tumors, however, ICR scores positively correlate with tumor grade (online supplementary figure 7), and it is possible that the observed positive correlation between aneuploidy and ICR is actually driven by the higher genomic instability characterizing the more advanced tumors.
To compare cancer types based on the prognostic value of ICR, we categorized them into two groups: one for which ICR high was associated with increased OS and one for which ICR was associated with worse OS. For the first group, multivariate analysis confirmed a positive prognostic value of ICR independent of pathologic tumor stage. SKCM, BRCA, UCEC, LIHC, SARC, HNSC, STAD and BLCA are consequently referred to as ICR-enabled cancer types. For the second group, including UVM, LGG, PAAD and KIRC (ICR-disabled tumors), survival analysis showed a detrimental (univariate analysis) or neutral (multivariate analysis with stage) role for ICR. In case of ICR-neutral tumors, it is possible that the lack of correlation between ICR and survival is due to the limited power of analysis as consequence of the scant number of events in some tumor types. This is especially true for KICH, PRAD, READ and THCA (Thyroid Carcinoma), in which the use of OS has been cautioned.25 The use of OS has been cautioned also for BRCA. However, in this tumor type, the conditional prognostic value of ICR and/or immune signatures reflecting lymphocyte infiltration according to the status of proliferation/TGF-ß and has been validated in several thousands of samples beyond TCGA.9 10 24
The discrepancies in term of prognostic connotation of intratumoral immune response across different cancer types have been observed in independent investigations based on transcriptomic analysis7 88 89 or immunohistochemistry90 but never explained.
The first notable difference we observed between ICR-enabled and disabled cancer types was the overall lower ICR value in the disabled cancer cohorts. In particular for UVM and LGG, this low ICR could be a partial explanation for the lack of positive prognostic value of the ICR. On the other hand, mean ICR score of PAAD and KIRC was not different compared with the other cancer types. Therefore, other factors must have an effect on the prognostic value of the ICR. When we compared enrichment of tumor-cell intrinsic pathways in ICR-enabled and disabled cancer types, as much as 43 of 54 analyzed pathways showed differential enrichment between the two groups. While ICR-enabled cancer types are typically more enriched in proliferation-related signatures, ICR-disabled cancer types have high enrichment of pathways generally attributed to tumor signaling including pathways known to be associated with immune suppression such as TGF-ß.91 In fact, when samples of the entire cohort were segregated according to representative enabling and disabling pathways (ie, proliferation and TGF-ß signaling, respectively), the prognostic role of ICR was restricted to proliferation-High/TGF-ß-low tumors (figure 6). Hierarchical clustering based on the enrichment of transcripts of these differentially enriched pathways segregated most samples of ICR-enabled cancer types from samples of ICR-disabled cancer types. Interestingly, this clustering was even relevant to samples of ICR-neutral cancer types. The pan-cancer survival analysis of samples of ICR-neutral cancer types showed that for samples that coclustered with samples of ICR-enabled cancer types (the ICR beneficial cluster), ICR high was associated with significant prolonged survival. Adding the mutational load component further refined this stratification. In fact, the positive prognostic role of ICR was present also in a subset of samples with low proliferation and high mutational load but absent only in tumors with both low proliferation and low mutational load. Multivariate analyzes confirmed these observations. In particular by adding stage, proliferation, TGF-ß, mutational rate and aneuploidy to the ICR survival model (table 1 and online supplementary table 4), the ICR status in ICR-disabled tumors resulted to be neutral rather than detrimental, being the negative correlation observed between ICR and survival in univariate analysis the result of the association between stage/grade, ICR and oncogenic pathways.
We hypothesize that, in tumor with high mutational burden and/or high proliferative capacity, the high level of ICR captures a true protective antitumoral immune response, while in the other cases, such as in tumors dominated by cancer signaling, the high ICR captures a bystander, or heavily suppressed, lymphocyte infiltration with no protective effect.
Therefore, it is possible to speculate that a proportion of transcriptionally immune active tumors are functionally immune silent. Single cell RNA sequencing, spatial transcriptional analysis and T-cell receptor sequencing might be employed to characterize with higher fidelity the true functional orientation of human tumors.87 92–94 The first two of these approaches could also define the source (eg, stroma vs tumor cells) of immune suppressive signaling such as TGF-ß.
The clinical relevance of the observed conditional impact of ICR was confirmed in the setting of anti-CTLA4 treatment, in which the predictive value of ICR was demonstrated to be dependent on tumor intrinsic pathways, such as TGF-ß and proliferation. To the best of our knowledge, we are the first to report an interaction between tumor intrinsic pathways and the prognostic value of the immune phenotype in a pan-cancer analysis. An association between proliferation and the prognostic value of the immune phenotype has previously been identified in breast cancer.9 In non-small-cell lung cancer, proliferation was shown to improve prediction of immune checkpoint inhibitors response in PD-L1 positive samples (data recently presented at SITC annual meeting 201895). Our study clearly demonstrates that such interactions between tumor intrinsic attributes and prognostic and potentially predictive value of immune phenotypes are also relevant in a pan-cancer context. Moreover, we defined additional tumor intrinsic attributes beyond tumor proliferation to correlate with the prognostic significance of immune signatures reflecting a Th-1 immune response. Prognostication algorithms should be refined by inclusion of tumor intrinsic attributes in order to define the prognostic impact of the immune signatures.
In conclusion, we observed a clear relationship between enrichment of tumor intrinsic pathways and the prognostic and predictive significance of immune signatures and identified novel cell-intrinsic features associated with immune exclusion. These findings can be used to prioritize candidates for immunogenic conversion41 and to refine stratification algorithms.
Supplemental material
Acknowledgments
DB and GZ would like to thank Pietro Blandini, for his invaluable scientific insights regarding multidimensional analysis.
References
Footnotes
Twitter @wouterRLH
JR and WH contributed equally.
Correction notice Since the online publication of this article, several errors were noticed. These errors occurred during the production process and were not made by the authors. 1) Affiliations for authors Julie Decock, Lotfi Chouchane, Ena Wang, Pascal Finetti, Francois Bertucci, Lance D Miller, Jerome Galon and Francesco M Marincola were missing. 2) The supplementary figure and table legends were missing, and a supplementary txt file was incorrectly converted to a pdf file. 3) In Table 1 second row, ‘ICR cluster (ICR low vs high)’ was incorrectly spelt as ‘CR cluster (ICR low vs high)’. These errors have now been updated in the article.
Funding This research has been supported by Qatar Foundation, Qatar National Research Fund (grant numbers: JSREP07-010-3-005 and NPRP-10-0126-170262 awarded to WH and DB, respectively) and by the AIRC IG 2018-ID 21846 grant awarded to MC.
Competing interests TT, KH, and JS are employees of AbbVie Biotherapeutics. MC was an employee of AbbVie Biotherapeutics at the time the research was conducted and has currently a consulting relationship with AbbVie. FMM is an employee of Refuge Biotechnologies. EW is an employee of Allogene Therapeutics
Patient consent for publication Not required.
Provenance and peer review Not commissioned; externally peer reviewed.
Data availability statement Data are available in a public, open access repository. All data relevant to the study are included in the article or uploaded as online supplementary information. Scripts for analysis are shared on https://github.com/Sidra-TBI-FCO/ISPC.git (34). Data generated or analyzed during this study are included in this article. Data sheets for results of individual cancer types are available as cancer data sheets at figshare (https://figshare.com/articles/Cancer_Datasheets/7937246).