Article Text

Abstract
Background Children residing in neighbourhoods of high deprivation are more likely to have poorer health, including excess body size. While the availability of unhealthy food outlets are increasingly considered important for excess child body size, less is known about how neighbourhood deprivation, unhealthy food outlets and unhealthy dietary behaviours are interlinked.
Methods This study involves children aged 8–13 years (n=1029) and resided in Auckland, New Zealand. Unhealthy dietary behaviours (frequency of consumption of unhealthy snacks and drinks) and food purchasing behaviour on the route to and from school were self-reported. Height and waist circumference were measured to calculate waist-to-height ratio (WtHR). Geographic Information Systems mapped neighbourhood deprivation and unhealthy food outlets within individual, child-specific neighbourhood buffer boundaries (800 m around the home and school). Associations between neighbourhood deprivation (calculated using the New Zealand Index of Deprivation 2013), unhealthy food outlets, unhealthy dietary behaviours and WtHR were investigated using structural equation modelling in Mplus V.8.0. Age, sex and ethnicity were included as covariates, and clustering was accounted for at the school level.
Results Structural equation models showed that unhealthy food outlets were unrelated to unhealthy dietary behaviours (estimate 0.029, p=0.416) and excess body size (estimate −0.038, p=0.400). However, greater neighbourhood deprivation and poorer dietary behaviours (estimate −0.134, p=0.001) were associated with greater WtHR (estimate 0.169, p<0.001).
Conclusion Excess child body size is associated with neighbourhood deprivation and unhealthy dietary behaviours but not unhealthy outlet density or location of these outlets near home and school.
- deprivation
- child health
- nutrition
This is an open access article distributed in accordance with the Creative Commons Attribution Non Commercial (CC BY-NC 4.0) license, which permits others to distribute, remix, adapt, build upon this work non-commercially, and license their derivative works on different terms, provided the original work is properly cited, appropriate credit is given, any changes made indicated, and the use is non-commercial. See: http://creativecommons.org/licenses/by-nc/4.0/.
Statistics from Altmetric.com
Introduction
Individuals residing in deprived areas experience poorer health and worse social outcomes than their counterparts in less deprived areas1 and children are disproportionately and negatively affected by deprivation.2 Every child is entitled to a high standard of living for physical, mental, spiritual, moral and social development3; 30 years ago, New Zealand/Aotearoa (NZ) was one of the first to ratify the United Nations (UN) Convention on the Rights of the Child. NZ, alongside 193 other countries, is also a signatory to the UN Sustainable Development Goals (SDGs). Goal one of the SDGs is to eradicate poverty.4 Worldwide children are more likely than adults to live in neighbourhoods of high deprivation and come from income poor households.5 In NZ, estimates show around 27% of children live in income poor households, many of which cluster together in deprived areas.6 7
Businesses selling unhealthy food and drinks target children,8 population groups on low incomes and those living and working in deprived neighbourhoods.9 In NZ and other high-income countries, unhealthy food outlets such as fast-food or takeaway restaurants and convenience stores that sell predominately energy dense, nutrient poor foods and beverages10 are more likely to be found in highly deprived neighbourhoods.11–13 Moreover, food purchasing behaviour is important to consider as systematic reviews show associations between eating out of home and higher overall energy intake14 and poorer overall diet quality.15 Globally, and in NZ, excess body size in children is a public health concern.16 However, the links between deprivation, food purchasing behaviours, unhealthy food environments and excess body size are complex and are seldom considered together.
This research seeks to understand the associations between neighbourhood deprivation, unhealthy food outlets, unhealthy dietary behaviours and excess body size in children. As there is research showing harm caused to children from ubiquitous use of the terms overweight and obesity,17 excess body size will be used to refer to greater risk of central adiposity. This research builds on previous cross-sectional studies showing small but significant associations between such food outlets, unhealthy dietary behaviours and increased child and adolescent body size,15 18 19 and on recent studies in adults20 where there was a greater focus on area deprivation in the analysis. Typically, previous studies account for deprivation, independent of potential sociodemographic confounders such as age, ethnicity and sex in regression analyses. Given the complexity of possible associations between deprivation and sociodemographic confounders, we extend the framework proposed (for the adult population) by Hobbs et al20 and use structural equation modelling (SEM) to quantitatively examine these relationships (see figure 1).
Conceptual model.
Methods
Study location
This research was conducted in Auckland, NZ. Approximately one-third of all New Zealanders live in Auckland; it is NZ’s largest city with a geographically, ethnically and socioeconomically diverse population of over 1.5 million people (approximately 37.5% of the total NZ population).21 The results from the 2013 Census show that Auckland contains the wealthiest areas in NZ and the poorest,22 often juxtaposed in close proximity to each other.23 This makes Auckland an ideal location to study possible associations between neighbourhood deprivation, food outlets, unhealthy dietary behaviours and body size.
Participants
Children in this study were involved in the cross-sectional Neighbourhoods for Active Kids (NfAK) study which has been described previously.24 Briefly, children aged 8–13 years were recruited from 9 intermediate schools (middle/junior high, school years 7–8: approximate ages 10–13 years) and 10 primary schools (elementary schools, school years 5–6: approximate ages 8–10 years). A matrix was used to select schools maximising variation in socioeconomic and neighbourhood built environment characteristics, specifically walkability,25 school decile and destination accessibility.26 Participants were invited following consent from a school representative. Students from classes of appropriate school years (as selected by the school) were subsequently visited at the school by researchers during class time, provided with verbal and written information about the study and invited to participate.24
Protocol
This study recognises the rights of the child3 and uses a child-centred approach to undertaking research with children.27 The survey was piloted prior to data collection28 and data were collected between February (the start of the school year) 2015 and September 2016. Trained researchers visited participating schools during school hours, and following standard operating procedures they provided child participants one-on-one assistance to complete an online survey and measured participant height (using a stadiometer) and waist circumference (using a Lufkin tape measure). Information on child ethnicity and school decile were obtained from the school and New Zealand Ministry of Education, respectively.
Measures
Defining and measuring neighbourhoods is fraught with challenges, as neighbourhoods are not constant across all people, places and time.29 Globally, food environment researchers have used a wide range of buffer distances from 100 m to 3.2 km.30 Mavoa31 tested associations between built environment factors and child physical activity in NZ using different road network buffers around the home and found that the 500 or 800 m road network buffer was most aligned with child physical activity and gave the greatest likelihood of significant findings. Research from NZ also suggests that schools are important central components of children’s neighbourhoods32 33 and important to consider alongside homes in determining children’s activity spaces and neighbourhood food environments.30 34 35 In this study, neighbourhoods were calculated by the combination of an 800 m road network buffer around the child’s home and an 800 m road network buffer around all entrances to the child’s school less any area of overlap. Neighbourhood calculations were made in ArcGIS V.10.5.1 (ESRI, Redlands, California, USA).31 36 An example neighbourhood can be seen figure 2.

An example neighbourhood.
All GIS data sources are reported in online supplementary material file 1.
Supplemental material
Neighbourhood deprivation was calculated using the New Zealand Index of Deprivation (NZDep2013), a composite measure that comprises nine variables (personal and household income, home ownership, employment, qualifications, family structure, housing, access to transport and communications) derived from the 2013 Census in New Zealand.37 Each meshblock was assigned a decile of deprivation, in which decile 1 represents the least deprived 10% of meshblocks across NZ and decile 10 represents the most deprived 10% of meshblocks. For this study, an average neighbourhood level area deprivation score for participants was calculated. Specifically, all NZDep2013 scores of meshblocks that intersected the neighbourhood buffer were summed and divided by the number of meshblocks within each neighbourhood. The neighbourhood average was then categorised into tertiles in which ‘low deprivation’ comprised deciles 1–3; ‘medium deprivation’ included deciles 4–7 and ‘high deprivation’ comprised deciles 8–10.
Body size was measured by research assistants in order to calculate waist-to-height ratio (WtHR; waist circumference/height). Waist circumference was taken with a Lufkin tape measure recorded correct to nearest 0.1 cm. Height in centimetres was assessed using a stadiometer to the nearest 0.1 cm. Each measure was recorded twice, and a third measurement was taken when the two previous measures differed by more than 0.5 cm. A WtHR threshold of 0.5 was used to determine increased health risk associated with central adiposity and the outcome variable was dichotomised accordingly: 1≤0.5, 2 ≥0.51.38 Age was recorded in years. Ethnicity was classified according to the Ministry of Education New Zealand, level 1 prioritisation.39
The latent variable, ‘unhealthy food outlets’ included three items. Item A measured the density of unhealthy food outlets and was calculated using data from a national database of food outlets, consistent with other studies of food environments in NZ.35 In NZ, all food outlets must be registered with a national database for regular checking of food safety.35 We defined unhealthy food outlets as fast-food, convenience or takeaway stores. Specifically, density was calculated as the count of unhealthy food outlets divided by the area of the combined neighbourhood buffer. Item B measured the shortest distance in metres along the road network from each participant’s home address to their nearest unhealthy food outlet. Item C measured the shortest distance in metres along the road network from the participant’s school to the nearest unhealthy food outlet.
The latent variable, ‘unhealthy diet behaviours’ had four items that captured food purchasing behaviour en-route to and from school as well as the frequency of consumption of unhealthy snacks (eg, biscuits, chocolate, lollies, chips) and/or sugar-sweetened beverages (eg, juice, cola, flavoured milks). Each question was coded 1–5 initially, but for this study we dichotomised each question as 0=frequent consumption (every day or every week) or 1=infrequent consumption (every month, hardly ever/never). For specific questions and response options, please see online supplementary material file 2.
Supplemental material
Analysis
A confirmatory factor analysis was completed on the observed variables for each latent construct. Some observed variables within latent constructs were measured on different scales, therefore z scores were created to standardise items to have a mean of 0 and SD of 1. The conceptual model is presented in figure 1. Clustering was accounted for at the level of the school using the ‘complex samples analysis’ approach.
Results
A total of 2534 participants were invited to participate in this study and 1102 provided assent and parental consent (43.5%). Cases with missing (n=42) or out-of-range WtHR values (n=1) were removed, leaving 1029 participants in the analytic sample. Descriptive statistics of participant characteristics are detailed in table 1. In brief, there were fairly even distributions by gender, and between primary and intermediate school students. Table 2 shows that most children had a WtHR <0.5. When analysed as a continuous variable, the overall mean WtHR was 0.456 (SD 0.062). The mean WtHR was 0.44 for children residing in the least deprived (tertile 1) and 0.49 for children living in middle and high deprived neighbourhoods (tertiles 2 and 3). Descriptive statistics stratified by WtHR can be seen in table 2.
Descriptive statistics of participants
Descriptive statistics for observed variables by waist-to-height ratio
The SEM indicated good model fit; the root mean square error of approximation was 0.012 (90% CI 0.000–0.023); the Comparative Fit Index (CFI) was 0.950 and Tucker–Lewis index (TLI) was 0.920. All model results are presented in table 3. The estimates and standard errors were derived from a series of models, estimated simultaneously, for which both the independent and dependent variables were standardised.
Results from structural equation model
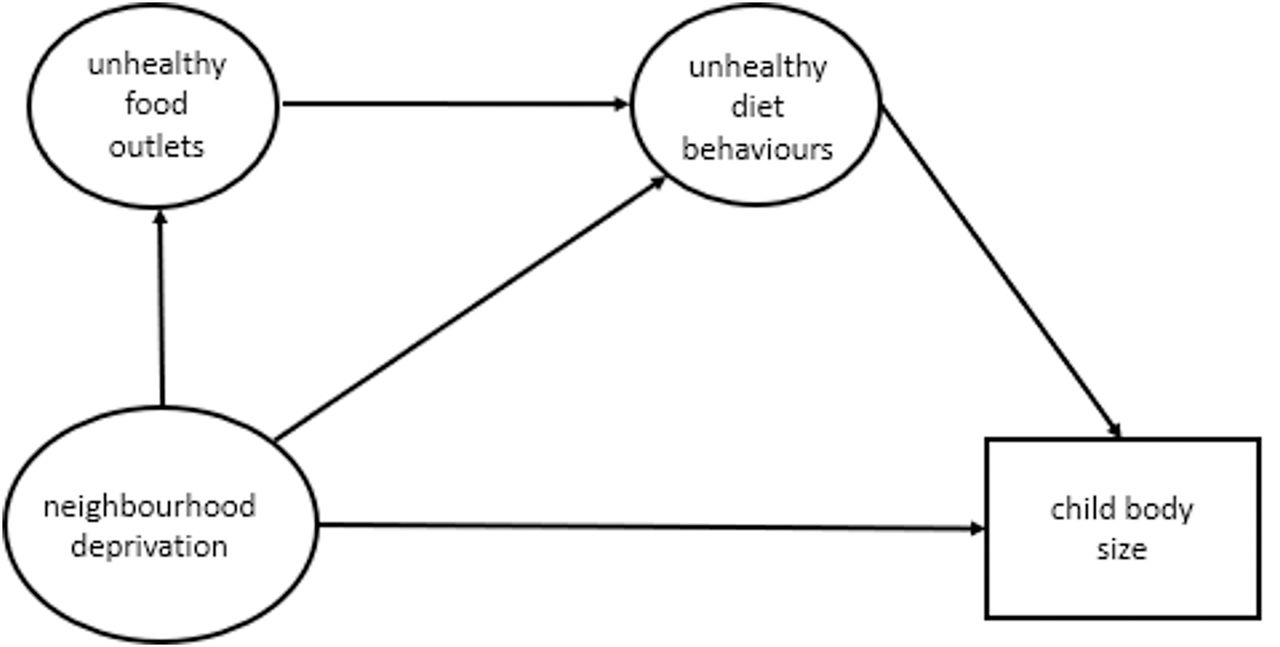
A summary of significant associations between neighbourhood deprivation and child body size and the latent variables unhealthy food outlets and unhealthy dietary behaviours are presented in figure 3. Greater neighbourhood deprivation (estimate 0.169, p<0.001) and unhealthy dietary behaviours (estimate −0.134, p<0.001) were independently related to greater WtHR. There was no association between area level deprivation and unhealthy food outlets (estimate 0.044, p=0.880), or neighbourhood deprivation and unhealthy dietary behaviours (estimate 0.053, p=0.590). There was also no significant association between unhealthy food outlets and unhealthy dietary behaviours (estimate 0.029, p=0.146). Pacific children were more likely to have a greater WtHR (estimate 0.191, p=0.017). No significant associations were found between the covariates and age or sex.

A summary of significant associations.
Discussion
This study adds new knowledge by using SEM to investigate associations between neighbourhood deprivation, unhealthy food outlets, unhealthy dietary behaviours and excess body size in a large sample of children with measured WtHR. The effect size of the association between neighbourhood deprivation and unhealthy dietary behaviours on excess body size was approximately equal. This supports emerging evidence on the negative impact of inequality on child health outcomes2 6 and calls to increase action to reduce neighbourhood deprivation from two perspectives: (1) child’s rights and (2) to prevent excess body size and the associated negative health impacts across the life course. This research reinforces the importance of neighbourhood deprivation as a correlate in the analysis of environmental impacts on child body size outcomes, despite a finding of lack of association between unhealthy food outlets and unhealthy dietary behaviours.
Neighbourhood deprivation and unhealthy dietary behaviours had the strongest relationship with excess body size among children in our study. The effect sizes were approximately equal. This finding differs to the work of Hobbs et al20 on which the theoretical framework of this study was modelled. Hobbs et al found greater effect sizes for deprivation than unhealthy food outlets on the excess body size of adults. Nonetheless, the extent to which the difference between these statistically significant effect sizes matters in practice is unclear40 and requires further investigation.
Contrary to previous research,19 our study found no association between the location and density of unhealthy food outlets and child body size which mirrors internationally inconsistent evidence.41 This finding could be due to the local context in Auckland, NZ where there appears to be increased accessibility to all food outlets in neighbourhoods of high deprivation.13 Future modelling could consider using all food outlets, rather than only those offering predominantly unhealthy food items, as opportunities exist to purchase unhealthy food and drink in outlets selling predominantly as ‘healthy’ food or drink.
It is also possible that no relationship exists between the location and/or density of unhealthy food outlets and child body size and that is why it was not detected. Furthermore, other factors related to child body size such as epigenetics, sleep, food habits and physical activity should also be more comprehensively included in future modelling. Research using more complex/multidimensional picture of person and place42 may be required to detect such associations.
This study uses a novel approach to defining individualised neighbourhood buffers that include the area around both the child’s home and school using an 800 m road network boundary. A more precise method of capturing children’s actual movement in their neighbourhood and determining neighbourhood boundaries could be achieved through GPS logging and should be considered in future research studies of children’s food environments. This method was not used in NfAK due to a lack of feasibility. It is also possible that loss of precision may have occurred through the transformation of neighbourhood deprivation from a continuous variable into the categorical variable deprivation tertiles. However, low, medium and high categories of deprivation are commonly used in the food environment literature43 44 and are particularly useful to make relative comparisons for policymakers and practitioners. While we build toward greater complexity, a better understanding of connections between neighbourhood deprivation and child poverty and body size are warranted in future research.
Food purchasing behaviour was included alongside the frequency of consumption of energy dense, nutrient poor snacks and sugar-sweetened beverages as the location of unhealthy food outlets near schools has been linked to lunchtime food purchasing behaviour and consumption45 and the within school food environment.46 Our analysis found no association between these food outlets and food purchasing behaviour, however unhealthy dietary behaviours was significantly associated with likelihood of excess body size. Further research into the food purchasing behaviour of children, including the level of independence children have when purchasing food, would yield important insights into contemporary dietary health behaviours and help identify areas for prevention efforts.
The findings of this study have important implications for future research, but policymakers in public health, land use planners and others interested in creating healthy environments should interpret the results of this study with caution. First, children attending schools in neighbourhoods of deprivation in Australia and NZ are significantly more likely than their peers in more privileged neighbourhoods to be exposed to unhealthy food outlets.11 35 However, the direct connection between increased exposure to these food outlets and unhealthy dietary behaviours of children has not yet been shown. This study used count densities of unhealthy food outlets in children’s neighbourhoods and assessing relative densities of unhealthy food outlets to all food outlets may provide additional insight. Public health practitioners, schools and community groups have long advocated for greater restrictions around the location and density of unhealthy food outlets near places regularly frequented by children16 and more research is needed to determine the mechanisms through which exposure to such outlets and marketing of unhealthy food directly or indirectly influences dietary behaviour. In depth, qualitative and observational studies could provide unique insights and could be both culturally appropriate and child-centred. Furthermore, given the known bidirectional influences children and parents have on household and out-of-home food purchases,47 greater attention should be given to the food purchasing behaviour of children and parents from food outlets within children’s neighbourhoods and from food outlets outside of children’s neighbourhoods.
This research showed a significant association between neighbourhood deprivation and excess child body size. There is a clear need to reduce rates of children experiencing deprivation in NZ. It may be that interventions targeting overall reductions in child deprivation have a number of follow-on benefits to child health, including but not limited to body size. Investigations into social inequality, as well as household income and food insecurity on child body size, also warrant further research, particularly given the high numbers of children who currently reside in areas of deprivation and live in income poor households in NZ.6
Conclusion
This study uses SEM to investigate associations between neighbourhood deprivation, unhealthy food outlets, unhealthy dietary behaviours and excess body size in a large sample of children, aged 8–13 years, residing in geographically varied neighbourhoods in Auckland, NZ. Neighbourhood deprivation and unhealthy dietary behaviours were associated with excess body size but not with density and location of unhealthy food outlets. This research reinforces the importance of neighbourhood deprivation alongside unhealthy dietary behaviours as a correlate of environmental impacts on child body size outcomes.
What is already known on this subject
Unhealthy neighbourhood food environments are increasingly considered linked with excess child body size.
Few studies consider the pathways linking neighbourhood deprivation, unhealthy food outlets, unhealthy dietary behaviours and excess body size.
What this study adds
This study reinforces the importance of neighbourhood deprivation for excess child body size when considered alongside other neighbourhood influences such as unhealthy food outlets.
This is the first study to use individualised (home and school) neighbourhood buffer boundaries in the assessment of unhealthy food outlets and measured child body size outcomes in a structural equation model.
Results confirm the important influence of neighbourhood deprivation and unhealthy dietary behaviours with excess child body size.
References
Supplementary materials
Supplementary Data
This web only file has been produced by the BMJ Publishing Group from an electronic file supplied by the author(s) and has not been edited for content.
Footnotes
Correction notice The images for figure 1 and figure 3 were published the wrong way around. This has been corrected in the current version online. However, the print version is incorrect.
Twitter Victoria Egli @EgliVictoria and Matthew Hobbs @hobbs_PA
Contributors VE, MS, LM, CZ and KV contributed to the initial study design. VE, LM and ND contributed to preliminary data analysis and VE, JC, DE, MS and MH contributed to the modelling. All authors contributed to the manuscript and approved the final version prior to submission.
Funding This study was supported by a Health Research Council of New Zealand grant (grant number 14/436). MS is supported by a Health Research Council of New Zealand Sir Charles Hercus Research Fellowship (grant number 17/013).
Competing interests None declared.
Patient consent for publication Not required.
Ethics approval Ethical approval to conduct the study was provided by the host institution ethics committees (AUT Ethics Committee 14/263, 3 September 2014; Massey University Human Ethics Committee, 3 September 2014; University of Auckland Human Participant Ethnics Committee, 9 September 2014).
Provenance and peer review Not commissioned; externally peer reviewed.
Data availability statement No data are available. We do not have permission from the participants to share this data in whole or in part.