Article Text

Abstract
Objective Amid the COVID-19 pandemic, social stigma towards COVID-19 infection has become a major component of public discourse and social phenomena. As such, we aimed to develop and validate the COVID-19 Public Stigma Scale (COVID-PSS).
Design and setting National-based survey cross-sectional study during the lockdown in Thailand.
Participants We invited the 4004 adult public to complete a set of measurement tools, including the COVID-PSS, global fear of COVID-19, perceived risk of COVID-19 infection, Bogardus Social Distance Scale, Pain Intensity Scale and Insomnia Severity Index.
Methods Factor structure dimensionality was constructed and reaffirmed with model fit by exploratory and confirmatory factor analyses and non-parametric item response theory (IRT) analysis. Psychometric properties for validity and reliability were tested. An anchor-based approach was performed for classifying the proper cut-off scores.
Results After factor analysis, IRT analysis and test for model fit, we created the final 10-item COVID-PSS with a three-factor structure: stereotype, prejudice and fear. Face and content validity were established through the public and experts’ perspectives. The COVID-PSS was significantly correlated (Spearman rank, 95% CI) with the global fear of COVID-19 (0.68, 95% CI 0.66 to 0.70), perceived risk of COVID-19 infection (0.79, 95% CI 0.77 to 0.80) and the Bogardus Social Distance Scale (0.50, 95% CI 0.48 to 0.53), indicating good convergent validity. The correlation statistics between the COVID-PSS and the Pain Intensity Scale and Insomnia Severity Index were <0.2, supporting the discriminant validity. The reliability of the COVID-PSS was satisfactory, with good internal consistency (Cronbach’s α of 0.85, 95% CI 0.84 to 0.86) and test–retest reproducibility (intraclass correlation of 0.94, 95% CI 0.86 to 0.96). The proposed cut-off scores were as follows: no/minimal (≤18), moderate (19–25) and high (≥26) public stigma towards COVID-19 infection.
Conclusions The COVID-PSS is practical and suitable for measuring stigma towards COVID-19 in a public health survey. However, cross-cultural adaptation may be needed.
- COVID-19
- epidemiology
- mental health
- psychiatry
- public health
Data availability statement
Data are available upon reasonable request. Data will be shared upon reasonable request and with permission according to the Health Outcomes and Mental Health Care Evaluation Survey Research Group (HOME-Survey) data release policy.
This is an open access article distributed in accordance with the Creative Commons Attribution Non Commercial (CC BY-NC 4.0) license, which permits others to distribute, remix, adapt, build upon this work non-commercially, and license their derivative works on different terms, provided the original work is properly cited, appropriate credit is given, any changes made indicated, and the use is non-commercial. See: http://creativecommons.org/licenses/by-nc/4.0/.
Statistics from Altmetric.com
Strengths and limitations of this study
The COVID-19 Public Stigma Scale (COVID-PSS) was generated based on a qualitative and quantitative approach via a multistage survey design.
Sophisticated and comprehensive methods verified the dimensionality of the final COVID-PSS.
However, cross-cultural adaptation and longitudinal studies are needed.
Introduction
Since the wide spread of the COVID-19 worldwide, scholars have reported its social impacts and psychological consequences.1 2 With the COVID-19 outbreak, social stigma, xenophobia and discrimination have become major components of the public discourse and social phenomena, as the so-called COVID-19 effects.3 4 Social reactions, including negative emotion, feeling of fear, perception of danger, social sanctions and antagonism, towards specific high-risk groups have been noted at both national and international levels.5 6 However, reports addressing the psychological impact of and responses to COVID-19 in terms of public stigma have been limited.
Amid the COVID-19 pandemic, there is a need for a validated instrument for measuring public stigma towards COVID-19 infection that encompasses these unique reactions. The development and use of a standardised scale will provide a better understanding of the stigmas towards COVID-19 and track the public responses to the COVID-19 pandemic. Thus, we aimed to develop and validate the COVID-19 Public Stigma Scale (COVID-PSS), a simple and practicable measurement tool that can be incorporated into research and public health surveys. To maximise the appropriate interventions and minimise stigma, we aimed to establish the validity, reliability and interpretation of the COVID-PSS by classifying severity cut-off scores corresponding to the psychosocial impact of the COVID-19 pandemic on the daily lives of people; the scores reflected the participants’ values and perspectives.
Methods
Study design and participants
For the national-based public survey—the Health Outcomes and Mental Health Care Evaluation Survey: Under the Pandemic Situation of COVID-19 (HOME-COVID-19),7 adult respondents were invited to complete a set of measurement tools for mental and psychosocial problems, including public stigma towards COVID-19 infection during the lockdown in Thailand. Details of the survey protocol are described elsewhere. In brief, an online questionnaire survey via the SurveyMonkey (https://www.surveymonkey.com) that limits one-time participation per unique internet protocol address was adopted to minimise face-to-face interaction, per the physical distancing strategy. Convenience and snowball sampling strategies were employed for participant recruitment through social media networks via linked QR codes, including public websites, Twitter, Facebook, Instagram and LINE applications.
Participants were eligible for this study if they were Thai who were older than 18 years on the date of the survey, could read and communicate in the Thai language and gave their online informed consent, which was embedded on the first page of the questionnaire.
Procedures
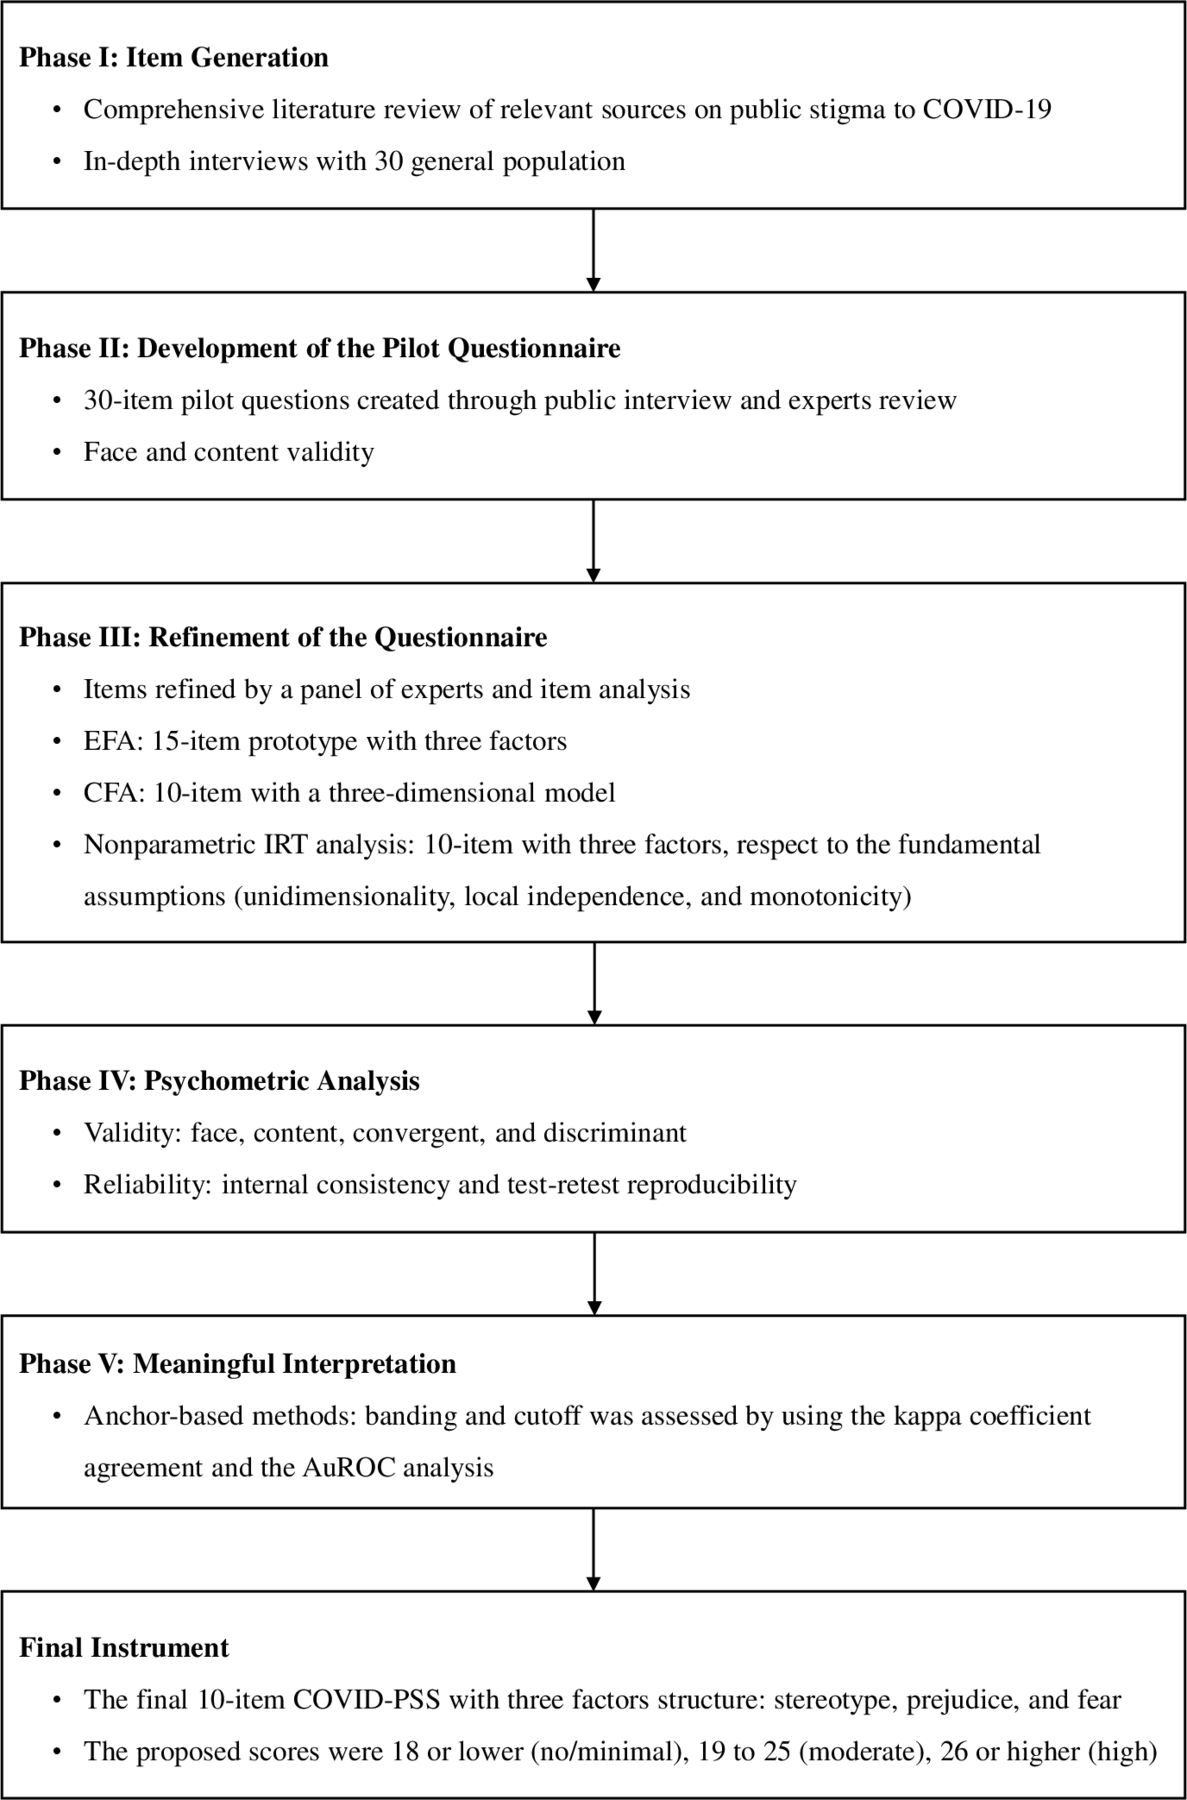
Figure 1 presents the series of phases and methods used in the study. Details of the methodology used for this study are described in online supplemental text S1 (eMethods). Briefly, phase I involved item generation. We conducted a comprehensive literature review of relevant sources on public stigma to COVID-19, including the various paradigms of perceived public stigma towards persons with mental illness,8–12 infectious diseases (HIV, Ebola virus, leprosy, severe acute respiratory syndrome),13–17 indigenous identity (minority groups),18 disability (intellectual disabilities)19 and addictive behaviours (gambling, alcohol use disorder).20 21 With a sample of the 30 general population, we used a combination of structured and non-structured in-depth interviews to explore the perceived public stigma to COVID-19 infection. The candidate items were selected based on cultural norms and relevance to the COVID-19 pandemic, focusing on the public’s experience. The initial item bank was identified to yield the 42-item predefined questionnaire.
Supplemental material
Methods for the development, validation, psychometric analysis and interpretation of the COVID-PSS. AuROC, area under the receiver operating characteristic; CFA, confirmatory factor analysis; COVID-PSS, COVID-19 Public Stigma Scale; EFA, exploratory factor analysis; IRT, item response theory.
Phase II was the development of the pilot questionnaire. We asked a panel of experts to comment on the 42-item predefined questionnaire to determine the importance of the items and subsequently reduced it to the 30-item pilot questionnaire. The items were rated on a five-point Likert scale, which allowed for greater variation in response; a higher score indicated higher social stigma. Another sample of 30 respondents was invited to complete the 30-item pilot COVID-PSS to evaluate such dimensions as face and content validity. Based on public and expert views, the 30-item pilot COVID-PSS was reworded/substituted (online supplemental appendix S1).
In phase III, involving the refinement of the questionnaire, we recruited a sample from the public through various social media platforms. During wave I of the HOME-COVID-19 survey in Thailand (21 April to 4 May 2020),7 a total of 4004 participants completed the 30-item pilot COVID-PSS. We used a 1:1 ratio of participants to enable a random analysis of instrument dimensionality using exploratory factor analysis (EFA) and test for scale structure using confirmatory factor analysis (CFA). In addition, non-parametric item response theory (IRT) was performed to analyse the unidimensional set of items of the subscales of the COVID-PSS.
In phase IV, psychometric analysis, validity and reliability were tested to verify the psychometric properties of the final COVID-PSS. Participants were asked to complete the items on global fear of COVID-19 using a numerical rating scale (NRS) of 0–10 points, perceived risk of COVID-19 infection using an NRS of 0–10 points, the Bogardus Social Distance Scale using a rank order system of 1–7 points,22 Pain Intensity Scale using an NRS of 0–10 points9 and items on the Insomnia Severity Index.23 Test–retest reliability was then analysed based on a convenience subset of 409 participants who completed the final COVID-PSS a second time, approximately 3–5 days after their first survey.
Finally, for phase V, meaningful interpretation, we used an anchor-based approach to establish an interpretation of the final COVID-PSS by classifying severity cut-off scores such that they directly reflected the participants’ values and perspectives.24 25
Statistical analyses
Per the rule of thumb, 10–15 cases per candidate item are required.26 Thus, the required number of participants in this study ranged from 300 to 450. To obtain a stable factor structure, enable non-parametric IRT and psychometric analyses and compensate for missing responses of 30%, we calculated a minimum target of 585 as required per subcohort (EFA and CFA cohorts), for a total of at least 1170 participants needed in this study.
All statistical analyses were analysed using STATA V.14.0 (StataCorp). The CIs of the correlation statistics were calculated by the bootstrap resampling method to address the level of significance. P values <0.05 were considered statistically significant using two-tailed tests. Missing values were imputed with a multiple imputation method. However, items or participants with high levels of missing data (>20%) were excluded from the analyses. To describe the study population and results of all test assessments, we analysed the standard descriptive statistics using measures of central tendency and variability for the continuous variables, and frequency and percentage for the categorical variables. Item scores were summarised descriptively, with the normality of score distribution assessed by skewness and kurtosis tests. Items that demonstrated a floor or ceiling effect of >80% were removed.
The Kaiser-Meyer-Olkin measure and Bartlett test of sphericity were performed to ensure the appropriate use of factor analysis. For the EFA cohort, we performed an EFA by a principal factor extraction method, with the factor obliquely rotated using the promax criterion. Eigenvalues >1.0 and the scree plot with the number of factors that explained >5% of the variance were used to define the number of factors retained.27 28 The parallel analysis was also performed to confirm the optimal threshold for the number of factors or subscale components. To develop a practical and concise measurement tool, we considered items as acceptable, and thus retained items, if the loading coefficient was >0.6. The item characteristics were reviewed by a panel of experts designated by the search team to determine item inclusion or exclusion. We then analysed scale structure using CFA (CFA cohort) with the maximum likelihood estimation. A CFA was conducted to confirm how correctly a hypothesised model matched the factor structure by EFA, as described above. To determine the appropriateness of the tested model, we tested the fit indices, including the root mean square error of approximation, standardised root mean square residual, comparative fit index and Tucker-Lewis Index.29–32 Moreover, the coefficient of determination (R2) and item–scale correlations (standardised factor loading) were estimated to establish the acceptability of the final structure of the COVID-PSS. The unidimensional set of items of the COVID-PSS was identified and model fit assessed via EFA and CFA, respectively. Subsequently, we implemented the non-parametric IRT analysis to establish the unidimensionality of the set of items with respect to the relation between latent traits and responses to the items.33 Taken together, the final decision for the final COVID-PSS items was theoretically based on all psychometric performances.
Face and content validity were ensured through the comprehensive development of the questionnaire by literature review, public interviews and expert review. Convergent validity was evaluated using Spearman’s correlation coefficients between the final COVID-PSS and other instruments, including the global fear of COVID-19, perceived risk of COVID-19 infection and Bogardus Social Distance Scale. Convergent validity was recognised if the correlation value was >0.4. Multiple linear regression was also performed to confirm the linearity of these findings. To establish the discriminant validity, we estimated the bivariate correlation between the final COVID-PSS and the Pain Intensity Scale and Insomnia Severity Index. We hypothesised a non-significant to fair correlation for the COVID-PSS scores and the specific tools (correlation statistic, 0.0–0.2). Cronbach’s α coefficient was calculated to determine the internal consistency reliability, with a value of ≥0.70 indicating acceptable reliability.34 Test–retest reliability was assessed by the intraclass correlation coefficients (ICCs) between the first and second surveys (3–5 days later), with a value of ≥0.8 or higher indicating acceptable reproducibility.
The final COVID-PSS was used to measure the degree of social stigma towards COVID-19 infection against three sets of anchor questions, including the global fear of COVID-19, perceived risk of COVID-19 infection and Bogardus Social Distance Scale. The proposed banding for the final COVID-PSS scores was divided using the mean, median and mode of the anchor-based questions. The kappa (κ) coefficient of the agreement and area under the receiver operating characteristic (AuROC) curve were calculated to assess optimal COVID-PSS cut-off scores. Effects of covariates on the AuROC values based on the proposed COVID-PSS cut-off scores were explored using the participant characteristics. Sensitivity and specificity with the corresponding 95% CIs were also estimated.35
Patient and public involvement
The public was engaged in the expert group during the in-depth interview that performed an item generation process of the COVID-PSS, and they also participated in the pilot testing and refinement of the questionnaire. However, the public was not involved in the study design and conceptualisation of the present study.
Results
Among the 4322 participants screened in the first wave of the HOME-COVID-19 survey, 318 (7.4%) with non-completed questionnaires were excluded (online supplemental figure S1). However, no significant difference was found between those who completed the survey and those with partial responses (online supplemental table S1). As such, only the complete cases were accepted and considered in our analysis. A total of 4004 participants who completed the instrument test were eligible for this study. We found no difference in characteristics after we randomly split the study population into a 1:1 ratio for the EFA (n=2002) and CFA (n=2002) cohorts. Overall, the participants had a mean age ±SD of 29.1±10.8 years. Among the participants, 65.4% were women. The participants’ characteristics are described in table 1.
Participant characteristics
According to the item analysis, three items of the 30-item pilot questionnaire (Q16, Q29, Q30) were removed owing to floor effects exceeding 80% (online supplemental table S2). Based on the statistical criterion and clinical judgement of the panel experts, the factor analysis of the EFA cohort identified 15 candidate items (Q1, Q2, Q4, Q5, Q6, Q7, Q8, Q9, Q10, Q11, Q12, Q13, Q14, Q15, Q27) with factor loading more than 0.6, and parallel analysis that encompassed the three potential factors (online supplemental figure S2). The 15-item prototype of the COVID-PSS explained 82.0% of the variance (online supplemental table S3). For the CFA cohort, the unidimensionality of each factor (subscale) and the overall three-dimensional model were then evaluated and re-evaluated by examining the modification indices. The CFA affirmed three unidimensional sets of items (subscale) with acceptable fit indices. Results of the CFAs of evaluated and re-evaluated models are illustrated in online supplemental table S4. The information criteria indices favoured reducing the sets of 15 candidate items to a 10-item refinement, supporting the three-dimensional model. The first factor had three items (Q2, Q4, Q5); factor 2 had three items (Q6, Q9, Q10); and factor 3 had four items (Q8, Q13, Q14, Q27). The correlated factors model of the 10-item COVID-PSS is presented in online supplemental figure S3. A non-parametric IRT analysis also supported the 10-item tool with a three-factor structure in terms of unidimensionality, local independence and monotonicity (online supplemental table S5). The final decision of the 10-item COVID-PSS captured three retained factors, namely stereotype, prejudice and fear (table 2). The final validated Thai and non-validated English versions of the 10-item COVID-PSS are provided in online supplemental appendices S2 and S3, respectively.
The final 10-item COVID-PSS (n=4004)*
The face and content validity of the final 10-item COVID-PSS were established through comprehensive item bank generation, public and expert review, as well as factor analysis. The correlation among the final 10-item COVID-PSS subscales ranged from 0.35 to 0.53 (online supplemental table S6). The psychometric properties of the final 10-item COVID-PSS are presented in table 3. As expected, the final 10-item PSS and its subscales were all markedly positively correlated with the sets of the psychosocial impact of COVID-19 on daily life, including global fear, perceived risk and social distance (p<0.001 for all). Furthermore, multiple linear regression also demonstrated these findings in terms of linearity; a one-unit increase in the sets of the psychosocial impact of COVID-19 scores substantially predicted an increase in the final 10-item COVID-PSS and its subscales (adjusted R2 range of 0.06–0.84, p<0.001 for all, online supplemental table S7 and figure S4). With respect to the correlation statistics, the pattern of correlations between the final 10-item COVID-PSS and the specific tools (Pain Intensity Scale and Insomnia Severity Index) was in line with the aforementioned hypothesis (Spearman’s correlation <0.2, table 3), which indicated appropriate discriminant validity. The reliability of the final 10-item COVID-PSS was satisfactory, with Cronbach’s α of the subscales and the summary score ranging from 0.76 to 0.85, and the test−retest of subsample with the ICCs ranging from 0.90 to 0.94 (table 3).
Psychometric properties of the final 10-Item COVID-PSS (n=4004)
The distribution of the final 10-item COVID-PSS scores characterised by the anchor-based questions (global fear of COVID-19, perceived risk of COVID-19 infection and the Bogardus Social Distance Scale) is provided in online supplemental table S8. The proposed sets of the 10-item COVID-PSS severity bands were classified into no/minimal, moderate and high stigma towards COVID-19 infection. The set U of the possible banding was preferred as the optimal 10-item COVID-PSS cut-off scores based on the κ coefficient (online supplemental table S9) and AuROC (online supplemental table S10). The categorised scores were proposed as no/minimal (≤18), moderate (19–25) and high (≥26), reflecting public values and perspectives on the anchor-based questions. The AuROC demonstrated the following ranges: no/minimal (0.65–0.82), moderate (0.50–0.65) and high (0.75–0.80). With respect to the discrimination, however, the anchor-based questions on the social distance scale provided the lowest AuROC, sensitivity and specificity compared with the others (table 4). Moreover, the AuROC values based on the proposed severity banding seem to have significant effects both positive and negative by the participant characteristics, particularly age of participants, sexual identity, marital status, religion and quarantine status (p<0.05; online supplemental table S11).
Public meaningful interpretation of the 10-Item COVID-PSS using participant-based anchors
Discussion
During the early months of the COVID-19 pandemic, there was no validated measurement tool for evaluating and tracking the social stigma towards the COVID-19 infection among the public. In response to this unprecedented occurrence, we developed, validated and investigated the psychometric properties of the COVID-PSS in the Thai public. To verify public significance and utility, we also established a banding system for the COVID-PSS (no/minimal, moderate or high) through assigning meaning to the public’s values and perspectives in terms of psychosocial responses to the COVID-19 pandemic.
The COVID-PSS was developed under a comprehensive and multidimensional approach that held a conceptual model of measurement using EFA and CFA. Non-parametric IRT also reaffirmed the fundamental assumptions (unidimensionality, local independence and monotonicity) of the dimensional model. The final 10-item COVID-PSS consisted of three dimensions of public stigma towards the COVID-19 infection, namely stereotype, prejudice and fear. Factor 1 had three items related to the general public stereotype towards COVID-19 infection; factor 2 had three items related to the prejudice for people infected with COVID-19; and factor 3 had four items related to the fear of the COVID-19 outbreak.
Considering the absence of a reference standard, it is theoretically coherent that more participants with greater COVID-PSS scores will yield a higher degree on the psychosocial responses to the COVID-19 pandemic—feeling of fear, perceived risk and social distance (online supplemental table S7). Theoretically, feeling of fear and perceived dangerousness of the pandemics are directly associated with transmission rate, widespread infodemic (rapidly and invisibly) and mortality rate.17 We postulated that individuals with high levels of fear or perceived dangerousness of the COVID-19 pandemic could respond irrationally, created and perpetuated stigma-related COVID-19 infection in the community. However, the Bogardus Social Distance Scale revealed the lowest correlation (0.50, 95% CI 0.48 to 0.53, table 3) among the set of convergent validity testing. As the COVID-19 pandemic is an emerging and acute infectious disease, resulting in the degree of affective social distance may differ from the previous report among chronic infectious diseases.
Moreover, all positively and substantially correlated subscales of the 10-item COVID-PSS and the sets of the psychosocial impact of the COVID-19 scores also reflected the conceptualisation of the measurement tool. The 10-item COVID-PSS showed acceptable reliability with respect to internal consistency and test–retest reliability (reproducibility). Removal of any item did not change our findings in terms of the Cronbach’s α coefficient, indicating the robustness of the internal consistency and cohesion of the scale.
In establishing the optimal cut-off scores, our findings revealed that the cut-off scores by the AuROC methods were acceptable in terms of the theoretical and practical merits of the external anchor-based questions, particularly with the perceived risk of COVID-19 infection scale. The proposed cut-off scores were ideal for dividing participants who experienced no/minimal or high stigma towards COVID-19 infection. However, discrimination among the moderate groups was poor. Taken together with validity, reliability and public utility, we hypothesised that the COVID-PSS will be suitable to capture the social stigma towards the COVID-19 pandemic and the impact on psychosocial responses in the Thai public.
Our study was performed with a comprehensive method. An initial item bank was generated via a qualitative approach to obtain the public’s values and perspectives, which reflect the cultural norms. This approach is recognised as a cornerstone to developing psychometric measurement tools.34 Meanwhile, a sophisticated quantitative approach verified a conceptual factorial structure (construct validity) via EFA. CFA and non-parametric IRT also reaffirmed the three-dimensionality of the final 10-item COVID-PSS.
However, the limitations of this study must be noted. Although the conceptual factorial structure and psychometric properties, along with the adequate sample size, give an acceptable performance scale, external validation studies including the appropriateness of the 10-item COVID-PSS scores in different countries and settings are warranted to establish the generalisability of the measurement tool. Moreover, the 10-item COVID-PSS was developed and validated only in the general population; validation in other specific groups, such as healthcare workers, minorities and vulnerable groups, would be needed. This measurement tool, nonetheless, is intended to be broadly used in all aspects of the general population to quantify the social stigma towards the COVID-19 pandemic. Lastly, this study was conducted among the social media network communities as per the physical distancing strategy during the pandemic, selection bias owing to limit participants who can access the internet and non-response effects must be stated.
To our knowledge, the COVID-PSS is the first tool that aimed to quantify the public stigma towards the COVID-19 infection in a nationwide community. The 10-item COVID-PSS could be incorporated into public health surveys as a part of clinical and intervention research. In terms of practicability and feasibility, this scale is easy to use by the general population; it can be answered in 5–10 min. Furthermore, the proposed cut-off scores for severity banding of the COVID-PSS can help in targeted population interventions, as well as inform the decision-making process for the government and public health officials to minimise stigma. Indeed, the scale can be used to determine and maximise the effectiveness of interventions. Nonetheless, the confirmed cases in a community, cultural norms, degree of public fear, degree of media-related consumption regarding the COVID-19 outbreak, government management strategies and public resilient coping towards the disaster or infectious outbreak may not be uniform across countries and over time. As such, cross-cultural adaptation and longitudinal studies are needed to evaluate and track the public stigma towards COVID-19 with respect to long-term effects. Further studies should enhance the translation of the scale, and the responsiveness validity should be investigated to assess the long-term consequences of the public stigma towards the COVID-19 pandemic.
Conclusion
The final COVID-PSS consisted of 10 items and captured a three-dimensional structure: stereotype, prejudice and fear. The 10-item COVID-PSS for evaluating and tracking public social stigma towards the COVID-19 infection is a practical scale and illustrates satisfactory psychometric properties for validity, reliability and public utility. This scale could be used and incorporated into public health surveys alongside clinical and intervention research.
Data availability statement
Data are available upon reasonable request. Data will be shared upon reasonable request and with permission according to the Health Outcomes and Mental Health Care Evaluation Survey Research Group (HOME-Survey) data release policy.
Ethics statements
Patient consent for publication
Ethics approval
The study was approved by the Committee of Research Ethics of the Faculty of Public Health (ET010/2020) and Faculty of Pharmacy (23/2563), Chiang Mai University.
Acknowledgments
The authors thank the research assistants and all the staff of Pharmacoepidemiology and Statistics Research Center (PESRC), Chiang Mai, Thailand. Particular thanks are given to the study participants for their contribution to the project.
References
Supplementary materials
Supplementary Data
This web only file has been produced by the BMJ Publishing Group from an electronic file supplied by the author(s) and has not been edited for content.
Footnotes
Contributors RA, YR, CP, WB, SNa and WC helped finalise the study protocol and recruit study participants. PK helped translate the questionnaire from the Thai version to a non-validated English version of the instrument. KT, NW and TW helped design the study, interpret the study results and commented on the previous version of the manuscript. SNo and CR were responsible for the statistical analyses and approved the final manuscript. SNo designed the study, and was responsible for the conduct of the study, and drafted the first version of the manuscript. All authors approved the final draft of the manuscript. SNo is the supervisor of the study.
Funding The work reported in this manuscript was partially supported by a grant from the Chiang Mai University Thailand.
Disclaimer The funder of the study had no role in the study design, data collection, analysis and data interpretation, nor in the writing of the report.
Competing interests None declared.
Provenance and peer review Not commissioned; externally peer reviewed.
Supplemental material This content has been supplied by the author(s). It has not been vetted by BMJ Publishing Group Limited (BMJ) and may not have been peer-reviewed. Any opinions or recommendations discussed are solely those of the author(s) and are not endorsed by BMJ. BMJ disclaims all liability and responsibility arising from any reliance placed on the content. Where the content includes any translated material, BMJ does not warrant the accuracy and reliability of the translations (including but not limited to local regulations, clinical guidelines, terminology, drug names and drug dosages), and is not responsible for any error and/or omissions arising from translation and adaptation or otherwise.