Article Text

Abstract
Objectives Work-related stress is a major concern. One of the best performing models is the Job Content Questionnaire (JCQ) of Karasek, assessing job demand and job control using 18 items. However, the JCQ is long and complex. Visual Analogue Scales (VASs) are easy to use and quick to implement. VASs have been validated to assess pain and occupational stress; however, VASs demand and control have not been evaluated. Therefore, we aimed to validate the use of VAS demand and control compared with the 18 items of the JCQ.
Design We implemented a cross-sectional observational study, by administering a self-reported questionnaire to the users of Wittyfit software, with a second test (retest) proposed 1 week later. In addition to JCQ, VAS demand and control, we measured sociodemographic outcomes, as well as characteristics of work, sleep, well-being, stress, depression and anxiety.
Participants 190 volunteers French workers using WittyFit software participated in the study, and 129 completed the test–retest.
Results VAS demand and VAS control correlated with the two Karasek domains from the JCQ, respectively, at 0.59 and 0.57 (p<0.001). Test–retest reliability highlighted concordance coefficients higher than 0.70. Sensitivity was higher than 70% for each VAS. External validity was acceptable. For both demand and control, VAS cut-offs were 75/100. Compared with other workers, senior executives and individuals with master’s degrees had higher levels of job control but did not differ in job demand using the VAS and JCQ.
Conclusions VAS demand and VAS control are valid, quick, easy to use, and reliable tools for the assessment of job demand and job control. They can be used in daily clinical practice for primary prevention and diagnosis. However, when results are over 75 mm on VAS, we promote the use of JCQ to be more discriminant and specific to initiate action plans to help workers.
Trial registration number NCT02596737.
- validation
- psychometrics
- psychology
- work
- stress
- health
Data availability statement
All data relevant to the study are included in the article or uploaded as online supplemental information. All relevant data are within the paper.
This is an open access article distributed in accordance with the Creative Commons Attribution Non Commercial (CC BY-NC 4.0) license, which permits others to distribute, remix, adapt, build upon this work non-commercially, and license their derivative works on different terms, provided the original work is properly cited, appropriate credit is given, any changes made indicated, and the use is non-commercial. See: http://creativecommons.org/licenses/by-nc/4.0/.
Statistics from Altmetric.com
Strengths and limitations of this study
The use of Visual Analogue Scales (VASs) for job demand and job control are valid, quick, easy to use and reliable tools compared with the Job Content Questionnaire (JCQ) of Karasek, considered as the historical model to assess job demand and job control.
The findings are based on a test–retest completed by 129 participants. The number of participants who responded to both the test and retest was higher than commonly reported in the literature.
Despite the widespread use and relevance of VAS, VAS provide global first-line evaluations that do not accurately assess putative explanations of stress factors such as those provided using the JCQ of Karasek.
We promote the use of VAS for both demand and control domains as an easy tool to detect abnormal situations. If abnormal situations are detected; occupational physicians should further assess workplace stress with the use of the JCQ.
Introduction
Stress refers to the consequences of the failure of a living organism to respond appropriately to emotional or physical threats whether actual or imagined.1 Stress can be defined as any threat to an organism’s homoeostasis.2 Stress is a condition that affects people daily and is influenced by multiple environmental factors, especially factors related to job such as deleterious working conditions.3 Indeed, work-related stress is now a major concern.4 Workplace stress encompasses a range of psychological and physical perturbations that negatively affect health, relationships, quality of life and well-being.5 Stress at work is a risk factor for chronic diseases such as cardiovascular or mental events.6–8 However, with most adults spending half of their waking hours at work, the workplace is an important setting to promote health and well-being.9 Over the past decades, the concept of occupational stress has increased in popularity and several questionnaires, scales, measurements or evaluation tools have been developed and validated.
Despite further evolution and other models,10–12 one of the historical concepts of occupational stress is the job demand-control model (JDC) created and validated by Karasek et al.13 This model recognises the importance of daily environmental stressors on the long-term experience of stress.14 It is based on two main hypotheses: the strain hypothesis predicts that job demands, aredefined as a high workload, time pressures and increased employee’s stress. The buffer hypothesis predicts that increasing control (autonomy and skill use) can alleviate the negatives effects of high demands. The active job quadrant is defined by high demands and high control, and the strain high stress quadrant is defined by high demands with low control.13 15 The Job Content Questionnaire (JCQ) derived from Karasek’s model16 has been developed and validated in several languages. Studies have highlighted its psychometric properties, especially in a French population of 24 486 workers.17 18 However, this tool is difficult to use in daily medical consultations because of its length (18 items) and complexity. Limits of self-reported questionnaires include their low level of completion and participation,19 20 and their low level of representativeness21 inducing a high level of missing data.22 Participation rate decreases with the length of the questionnaire, in addition to a decrease in attention and concentration.23
Occupational physicians have limited time because of the number of workers and worksites.24 As stress at work is a major public health concern,25 occupational physicians have to include consequences of psychosocial risks in their clinical diagnosis. They need a simple and fast instrument to use daily. The Visual Analogue Scale (VAS) is well known and valid in the clinical assessment of pain,26 for occupational stress27 28 and satisfaction at work.29 The VAS is a suitable tool for clinical activity and has good psychometric characteristics.26–28 Therefore, we hypothesised that VAS for job demand and job control would be appropriate tools to distinguish workers at risk of workplace-related stress versus the job-demand control questionnaire of Karasek.
The main purpose of the present work was to validate VAS demand and VAS control replacing the 18 items of the two domains of Karasek’s model (demand and control). We evaluated the external validity of the two VAS (control and demand) by highlighting their relationships with various parameters such as sociodemographics, professionals (VAS stress at work or working hours) or well-being (sleep).
Methods
Participants
We implemented a cross-sectional observational study. Self-reported questionnaires were proposed to voluntary French workers using WittyFit software (https://wittyfit.com/). Users of WittyFit were disseminated through several national French companies, mostly from the service sector (tertiary sector). WittyFit is software that aims to improve well-being at work with an epidemiological design, and a collaborative partnership with researchers (public–private partnership between WittyFit and the University Hospital of Clermont-Ferrand).30 Workers using WittyFit were proposed to answer validated self-questionnaires on behavioural data for personalised evaluation. Workers can answer WittyFit questionnaires using a dedicated application, available for computers or smartphones, at any time. The concept of WittyFit is to provide health profiling with an individualised feedback based on evidence-based medicine. It aims to support behavioural change over time, and to assess the relationships between changes in knowledge, practices, and health outcomes. Exclusion criteria of participants were the inability to read, understand or answer on-line questionnaires. Answering Wittyfit questionnaires implied consent. The study was conducted on workers using WittyFit software between 1 June 2016 and 30 June 2016. All data were anonymous. The name of the employee was never revealed. The database was implemented from a human resource generated number, automatically converted in another number into the WittyFit database.30 Data provided by employers (eg, occupation, department, sick leave) were automatically associated with the human resource-generated number.
Patient and public involvement
This was an exploratory study in an ecological situation. The WittyFit users were informed of a forthcoming questionnaire on the platform, explaining the purpose of the study (validation study) and the need to complete the questionnaire twice (test, and retest 1 week later). Workers were not involved in the design, conduct, reporting or dissemination plans of this research.
Primary outcome
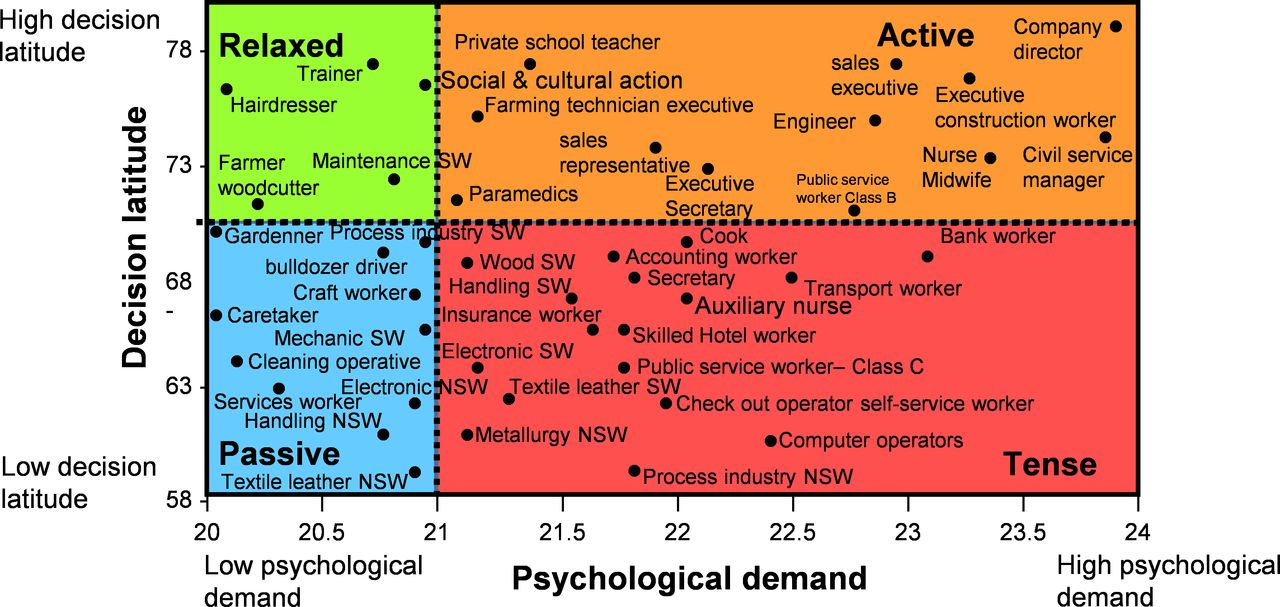
The primary objective was to validate the two VAS (demand, control) in replacement of Karasek’s questionnaire. Job demand and latitude decision making was evaluated by the 18 items of the Karasek’s questionnaire (JCQ)16 and by VAS control and VAS demand. The JCQ measures nine items of job control (questions Q1–Q9), nine items of job demand (Q10–18). Items of JCQ were scored on a four-point Likert-type scale, ranging from one (strongly disagree) to four (strongly agree). As suggested by the authors, the score for each dimension was calculated using the following equations: Q10 +Q11+Q12 + (5-Q13)+Q14+Q15+Q16+Q17+Q18 for job demand, and 4*Q4 +4*(5-Q6)+4*(Q8) +2*(5-Q2)+2*(Q5) +2*(Q7) +2*(Q1) +2*(Q3) +2*(Q9) for job control. According to Karasek,13 14 combining scores of job demand and job control allowed to define four situations at work (active, passive, relaxed, tense/job strain) corresponding to four quadrants, with an allocation between various socioprofessional groups (figure 1). From French data,18 the job strain threshold was set for a demand score higher than 21 and a control score less than 70. VAS assessed the perceived control and demand of individuals at work, on a horizontal, non-calibrated line of 100 mm, ranging from very low (0) to very high (100).

The job demand-control model of Karasek and its four quadrants: active, passive, relaxed and tense (job strain). NSW, non-skilled worker; SW, skilled worker.17 18
Secondary outcomes
We retrieved sociodemographic data such as age, gender, education level and marital status. We also collected characteristics of work: occupation, number of hours at work per week, and seniority within the company. Sleep quantity was assessed by the number of hours of sleep per night.31 Sleep quality, well-being, stress at work and stress at home were evaluated using VAS ranging from very low (0) to very high (100).24 28 We evaluated depression (D) and anxiety (A) with the use of the Hospital and Anxiety Depression Scale (HAD).32 The HAD is a 14-item self-reported measure with two subscales of seven items, one assessing anxiety (HAD-A) and the other assessing depression (HAD-D), rated from zero to three. As suggested by the authors, the HAD-A score is calculated by adding the scores for questions 1, 3, 5, 7, 9, 11 and 13; and the HAD-D score with questions 2, 4, 6, 8, 10, 12 and 14. The scores for each subscale range from 0 to 21. A score less than seven means the absence of disease; between eight and ten a doubtful disease; a score higher than 11 is a confirmed disease.
Time of measurements
Participants completed the questionnaires when time was convenient to them. They were automatically asked to complete the two VAS (VAS demand and VAS control) and the JCQ 1 week after the first completion of questionnaires, to perform test–retest. Total completion time was approximately 30 min (20 min first session and 10 minutes second session).
Statistics
Sample size was determined according to COSMIN (COnsensus-based Standards for the selection of health status Measurement INstruments) recommendations32 33: (1) ‘Rules-of-thumb vary from four to ten subjects per variable, with a minimum number of 100 subjects to ensure stability of the variance-covariance matrix’ and (2) ‘Often 0.70 is recommended as a minimum standard for reliability. We gave a positive rating for reliability when the ICC (Intraclass correlation coefficients) or weighted Kappa was at least 0.70 in a sample size of at least 50 patients.’
All analyses were performed using Stata software (V.13, StataCorp) for a two-sided type I error of α=5%. Participant’s characteristics were expressed as means±SD or median (IQR) for continuous data (assumption of normality assessed using the Shapiro-Wilk test) and as numbers (percentages) for categorical parameters. We followed the usual steps of validation of a new questionnaire.33 Internal validity allows verification that the independent variable (Karasek score) and is responsible for variation of the dependent variable (VAS control and VAS demand). The internal validity of the two VAS was assessed according tointernal consistency based on correlation coefficient (Pearson or Spearman) and Cronbach alpha coefficient (adequate expected values higher than 0.64)34—we also explored more deeply the relationship between each VAS and items of Karasek questionnaire using correlation coefficients and principal component analysis.33 Test–retest reproducibility was assessed using Lin concordance coefficient and Bland and Altman plots.35 External validity takes into account generalisability of the new scales, that is, relation with other variables or groups. External validity was assessed using correlation coefficients (Pearson or Spearman) between VAS and sociodemographic or other psychological measures, such as sleep, well-being, stress, anxiety or depression scores. Then, a receiver operating characteristic (ROC) curve analysis was proposed to determine the best thresholds of VAS to predict a gold-standard Karasek, according to clinical relevance and usual indexes reported in the literature (Youden, Lin and efficiency). Sensitivity, specificity, positive and negative predictive values were calculated and presented with 95% CIs. The concordance between Karasek quadrants and their equivalents from VAS, according to cut-offs determined by ROC curve analysis, was evaluated using agreement rate and Kappa concordance coefficient. Finally, quantitative variables were compared between independent groups by analysis of variance (ANOVA) or Kruskal-Wallis test if ANOVA conditions were not met (normality and homoscedasticity analysed using the Bartlett test). When appropriate, post hoc tests were performed considering multiple comparisons (Tukey-Kramer post ANOVA and Dunn after Kruskal-Wallis). The comparisons between groups were carried out using the χ2 or Fisher's exact test for categorical variables. When appropriate, a post hoc test was used (Marascuillo procedure).
Results
Participants
Among the 1580 workers using WittyFit, 190 (12.0%) agreed to participate. We had no missing data (n=190; 100%) for primary outcomes that is, Karasek questionnaire, VAS demand and VAS control. Secondary outcomes were fulfilled by 163 (85.8%)of respondents. Among them, 89 (54.1%) were women. The test–retest approach was performed on the 129 participants who answered twice to the Karasek questionnaire and the two VAS (demand and control) (figure 2). At baseline, the 190 and 163 workers did not differ according to sensibility analysis. Mean age was 41.9±11.7 years. Seniority within the company was 11.0±10.8 years. Most of the workers were senior managers (68.1%) and had a master’s degree (74.9%) (table 1).

Flow chart and study design. JCQ, Job Content Questionnaire; VAS, Visual analogue scale.
Characteristics of participants
JCQ of Karasek
According to Karasek’s Model, 53.2% of participants were ‘active’ (demand score ≥21 and control score ≥70) with a mean demand score of 25.0±4.0 and a mean control score of 83.8±35.0; 30.0% were ‘relaxed’ (demand score <21 and control score ≥70) with a mean demand score of 22.0±5.0 and a control score higher of 83.8±35.0; 14.7% were ‘tense/job strain’ (demand score ≥21 and control score <70) with a demand score of 25.0±4.0 and a control score of 61.9±5.6; 10.5% were ‘passive’ (demand score <21 and control score <70) with a demand score of 22.0±5.0 and a control score of 61.9±5.6 (table 2). There were no statistical differences regarding age, sex and marital status, at the dimensions evaluated by the JCQ of Karasek (demand and control) or between quadrants (active, passive, tense/job strain, relaxed). Workers with longer seniority/experience within the company tended to have higher job control (p=0.09). Compared with other workers, senior executives and master’s degree staff had higher levels of job control (p<0.05) but did not differ in job demand (online supplemental appendix 1).
Supplemental material
Job-demand and job-control assessed with the use of Visual Analogue Scale (VAS) or the Job Content Questionnaire of Karasek
VAS demand and VAS control
Mean VAS demand was 75.2±20.6 and mean VAS control was 81.9±21.9. Using the retrieved cut-off of 75 (see below), 56.3% of workers had a VAS demand ≥75% and 72.6% a VAS control ≥75 (table 2). As for JCQ, there were also no influence of age and sex on both VAS demand and VAS control. Married workers perceived a higher job demand (p=0.03). Workers with a higher seniority in the company had a higher VAS control (p=0.02). Workers with a seniority within the company above 15 years had a higher VAS control than workers with a seniority below 2 years (90.0±5.3 vs 10.0±5.2, p<0.001). Similarly, to JCQ, senior executives and master’s degree holders had or tended to have higher levels of job control (p<0.10) but did not differ in job demand (online supplemental appendix 1).
Validation of VAS demand and VAS control: internal validity
Internal consistency
Significant correlations were emphasised: 0.59 (p<0.001) between the demand score from the JDC of Karasek and the VAS demand and 0.57 (p<0.001) between the control (latitude decision) score from the JDC of Karasek and the VAS control. The Cronbach alpha coefficient was 0.68. The relationships between each VAS and items of Karasek questionnaire are presented in online supplemental appendix 2. Briefly, for each dimension (control and demand), all items of the Karasek questionnaire were correlated with the corresponding VAS, except item 14, and the highest correlations were found between items 4, 6 and 8 and VAS control, and between items 11 and 15 and VAS demand.
Supplemental material
Test–retest reproducibility
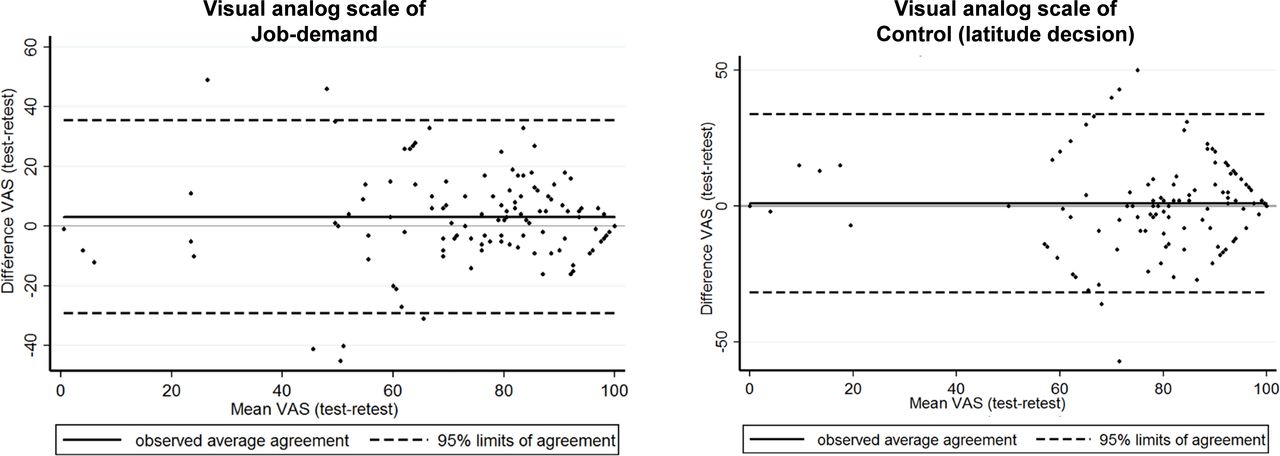
Lin concordance coefficient was 0.73 (95% CI 0.64 to 0.81) for job demand between the demand score from the JDC of Karasek and the VAS demand and 0.71 (95% CI 0.63 to 0.80) for job control the control score from the JDC of Karasek and the VAS control (figure 3).

Bland and Altman plot or representation of agreement between both series of Visual Analogue Scales (VAS) of job demand and job control.
Cut-off’s determination and concordance
For both VAS demand and VAS control, we emphasised a significant cut-off set at 75, with a good sensitivity and specificity. For VAS demand, the retrieved cut-off (p<0.001) of 75 had a sensitivity of 71%, a specificity of 74%, an area under ROC curve of 0.79±0.04 (95% CI 0.72 to 0.85), a positive predictive value of 70.5% (95% CI 61.9% to 78.2%) and a negative predictive value of 73.8% (95% CI 60.9% to 84.2%). For VAS control, the retrieved cut-off (p<0.001) of 75 had a sensitivity of 81%, specificity of 56%, an area under ROC curve of 0.76±0.04 (95% CI 0.68 to 0.84), a positive predictive value of 91% (95%CI 73.6% to 87.1%) and a negative predictive value of 54.2% (95% CI 39.2% to 68.6%).
The concordance between Karasek quadrants and their equivalents from VAS was relatively low (k=0.37) with percentages of agreement of 54.9% between Karasek quadrants and their equivalents. Groups according to VAS emphasised more ‘actives’ and ‘strain’ workers than JCQ. However, ‘relaxed’ and ‘passives’ workers were overall more highlighted with JCQ (table 3).
Concordance between quadrants retrieved from Job-Content Questionnaire (JCQ) of Karasek and their equivalents retrieved from Visual Analogue Scales (VAS) of demand and control
Validation of VAS demand and VAS control: external validity
VAS demand
According to cut-offs for VAS, a high job demand was linked with a higher stress at work (p<0.001) and at home (p=0.03), and a higher time spent at work (p<0.001). The higher job control, the higher VAS well-being (p=0.04). Relationships were similar using the JCQ, as well as for other quantitative or qualitative secondary outcomes (age, sex, education level, seniority within the company, occupation, HAD-D, HAD-A, number of hours at work per week, duration of sleep) that were non-significant according to cut-offs both for VAS demand and JCQ, except the relationship between quality of sleep and job demand that was retrieved mainly using the JCQ and between marital status and job demand that was retrieved mainly using the VAS demand (table 4 and online supplemental appendix 1).
Agreements between Visual Analogue Scales (VAS) and Job Content Questionnaire (JCQ) of Karasek and differences in outcomes according to cut-offs for the two dimensions of the job-demand control model of Karasek
VAS control
According to cut-offs for VAS, the higher job control is linked to the higher VAS well-being (p=0.04) and the higher education level (p=0.009). Using the JCQ, the same relationship was shown (p<0.02). Relationships were similar—non-significant—for other quantitative secondary outcomes (age, sex, marital status, HAD-D, HAD-A, number of hours of work per week, duration of sleep, VAS stress at work, VAS stress at home) both for VAS control and JCQ, except the relationship between quality of sleep, occupation and job control who was only retrieved using the JCQ and between seniority and job control that was retrieved mainly using the VAS control (table 4, online supplemental appendix 1).
VAS quadrant
Using quadrants from our retrieved cut-offs for VAS, job strain (tense) workers had higher job stress and time spent at work, and lower well-being compared with relaxed workers (p<0.001, p<0.001 and p=0.05, respectively). Relationships were also similar using the JCQ, except the relationship between quality of sleep, stress at home, education level, occupation and job demand that were more pronounced using the JCQ and between marital status and job demand that was retrieved mainly using the VAS demand (table 5 and online supplemental appendix 1). Comparisons between other quadrants also retrieved similar findings.
Agreements between Visual Analogue Scales (VAS) and Job Content Questionnaire of Karasek and differences in outcomes according to quadrants (active, passive, tense, relaxed)
Discussion
This study allowed the validation of VASs of job demand and job control at the workplace and focused on its acceptability, internal validity, reproducibility and external validity.
Acceptability
Workplace stress—that is, jobstrain—is a concern for both employers and workers because it can be the cause of absenteeism36 and various pathologies.37 38 Directives stated that occupational physicians needed to assess psychosocial risks to fight against work-related stress, and improve occupational health and safety concerns.39 Although the JDC model of Karasek is the gold standard13 to assess psychosocial risks at work, its length makes it difficult to use routinely in daily clinical practice by occupational practitioners.24 However, the fact that VAS are easy to implement, time-efficient in execution and easy to understand by the patient, offers a unique possibility for a consistent standardised use in common practice. Moreover, the VAS is already a common tool used by occupational physicians to assess other conditions such as stress.24 Occupational physicians have limited time to deal with considerable numbers of workers and worksites, and considerable numbers of occupational risks such as physical, chemical, biological and psychosocial risks.40 Even if a questionnaire is implemented before the consultation, a limited number of questions are necessary to be able to assess all occupational risks factors.41 Therefore, VAS of job demand and job control should be used frequently in common routine clinical practice of occupational physicians.42 Physicians do not have time to go to the workplaces of every stressed worker to investigate working conditions, to individually clarify the situation with managers, and to find solutions.43 44 Identifying workers under the highest pressure with improved accuracy would assist by reducing the numbers in this group to a manageable sample size. Moreover, from a statistical point of view, data ranged from minimal to maximal values, with a reasonable SD, as suggested by variation coefficients around 0.25–0.30.
Internal consistency and reproducibility
According to this study, VAS developments to assess psychosocial job characteristics based on the Karasek model appeared to be valid, reliable and precise instruments for the assessment of job demand and job control. Lin concordance coefficients were greater than 0.70 for both VAS of job demand and job control.35 VAS demand and control detection had acceptable sensitivity and specificity factors of job strain. Positive and negative predictive values are acceptable. The thresholds are determined to be 75/100 for both VAS demand and control. SUMER (SUrveillance Médicale des Expositions aux Risques professionnels) study demonstrated satisfactory psychometric properties of Karasek’s JCQ scales for the French working population.18 Internal consistency was satisfactory as Cronbach’s alpha coefficients were observed as being higher than 0.64. Convergent validity tests confirmed the expected association with key variables such as age, occupation, well-being, stress, depression or anxiety. In line with the literature,45 46 we demonstrated that workers with a master’s degree had greater job control both using VAS and JCQ, as well as for workers with higher seniority. However, the relationship between seniority and job control was found significant only using the VAS. Even if there was no relevant literature on senior executives, it seems logical that they would have higher job control as they are often more educated and qualified, with greater seniority within the company. Although no difference was apparent using the JCQ and was similar to findings reported in the literature,47 we showed that married workers had higher levels of job demand than single workers using the VAS, which may also favour the discriminant use of VAS. Family obligations may increase a perception of overload at work.48
External validity
We reported a prevalence of job strain of 15%. We did not show relationships between VAS scores and quadrants and age, sex, education level, family situation, concerning Karasek domains, Karasek groups or VAS. However, the SUMER study, based on a larger sample of 24, 486 workers, reported a higher prevalence of job strain than our results (24% vs 15%) with a predominance of women (30% vs 21%).18 The SUMER study emphasised a sharp gradient in socio-professional levels. Job control increased with high socioprofessional level as well as job demand. Consequently, job strain increased for low socioprofessional level. In addition, the SUMER study demonstrated a higher job control among men and a higher job demand among women.17 18 We hypothesise that our lower sample size and the representativity of all socioprofessional level in our sample may have precluded some significant statistical results. Nonetheless, we demonstrated that job control and job demand had acceptable external validity. According to the literature,12 18 we showed that stress at work and time spent at work were correlated with a strong job demand, for both VAS and JCQ. VAS well-being increased with high job control. Job strain was linked with low VAS well-being, a high job stress and a high time spending at work.
Limitations
The study has some limitations. The response rate may seem low compared with other studies using questionnaires in French populations.16 39 The majority of participants were high seniority precluding generalisability of our results.45 However, we included a substantial sample size of workers allowing us to carry out statistical analyses with the number of subjects required, determined a priori. Moreover, we had a few missing data points and the number of respondents followed recommendations for the validation of questionnaires.33 40 Despite the literature reports that a high drop-out rate is inherent to this type of study with several questionnaires,49 the number of participants who responded to both the test and retest was higher than commonly reported in the literature.42 43 However, VAS for job demand and job control have some limits concerning discrimination of at-risk workers. Despite its use for screening at-risk workers, JCQ was not initially conceived as a discriminative tool for clinical practice,16 such as other questionnaires, that is, burn-out, for example.50 The validation of a single cut-off point for both job demand and job control, by using easy, quick, and reliable VAS, may improve the decision-making process of occupational health practitioners. Even if clinical examination and occupational physicians’ observations remain essential for assessing job stressors and their repercussions, the two validated VAS demand and VAS control tools will help mass screening—especially considering that an occupational physician may have >10 000 workers to follow. We did not assess social support because of an informatics issue regarding this item; however, the JCQ does not include the social support and is still widely used.13 45–47 Sensibility, specificity, and Lin concordance coefficients were only moderate. Correlations between VAS and the Karasek groups was low. Moreover, we did not have many precisions regarding each domain using VAS. Despite the widespread use and relevance of VAS, VAS are global first-line evaluations that do not accurately assess putative explaining stress factors that are possible with the use of the JCQ of Karasek. We used some other non-validated VAS to evaluate well-being and quality of sleep, previously used in literature.33 51 52 The selective use of VAS demand and VAS control may limit occupational physicians in their capacity to understand work-related stress, and thus to give easy counselling to workers. Therefore, we promote the use of VAS demand and control as an easy tool to detect abnormal situations, and if detected, occupational physicians should further assess workplace stress with the use of the JCQ. Moreover, VAS for job demand and job control could also be easily used thereafter to follow workers at regular intervals, possibly using dedicated software.24 Further studies should encompass the subsequent modifications of the JCQ, specifically, adding social support—job-demand-control-support (JDCS) model; as well as the forthcoming effort–reward imbalance (ERI) model of Siegrist10–12; and finally, the Job Demands-Resources model that is, a sort of umbrella model including both JDCS and ERI concept.53 54
Conclusion
Although it performs less than JCQ, VAS demand and control are simple and rapid tools for screening patients with putative work-related stress. VAS demand and control can be used by the occupational practitioner in daily clinical practice for primary prevention and diagnosis. We determined a cut-off of 75 mm for both VAS job demand and job control to discriminate at-risk workers. However, when difficulties are highlighted by overreaching cut-offs of 75 mm, we promote the use of JCQ to be more discriminant and specific because greater accuracy is needed to establish action plans and help workers
Data availability statement
All data relevant to the study are included in the article or uploaded as online supplemental information. All relevant data are within the paper.
Ethics statements
Patient consent for publication
Ethics approval
This exploratory study was undertaken in an ecological situation and received approval from the Ethics Committee of the University Hospital of Clermont-Ferrand, France and from the National Commission for Information Technology and Civil Liberties (CNIL).
Acknowledgments
We express our sincere gratitude to Marie-Anne Cousseau who established the public-private partnership between WittyFit and the University Hospital of Clermont-Ferrand, France
References
Supplementary materials
Supplementary Data
This web only file has been produced by the BMJ Publishing Group from an electronic file supplied by the author(s) and has not been edited for content.
Footnotes
Contributors FD conceptualised and designed this study and developed the primary aims and hypotheses. FD was responsible for the submission of the protocol to the ethics committee. FD and BP primarily conceptualised the data analysis strategy to respond to objectives. CL was responsible for the clinical trial. SD and TC was responsible of the data collection and extraction. BP was responsible for the statistical analysis. CL and FD interpreted the data and wrote the first draft of this manuscript which was critically revised and upgraded by BP, JB-BM, MC, GB, SD, TC, MM, LM, JSB, JS and FM. All authors were actively involved in the planning and conduct of the study described and all were involved in interpretation and reporting the findings of this study. They all approved the final manuscript. FD is responsible for the overall content as the guarantor
Funding The study is integrally funded by WittyFit, Paris, France
Competing interests SD and TC are founders of WittyFit. Other authors have declared that no competing interests exist.
Patient and public involvement Patients and/or the public were involved in the design, or conduct, or reporting, or dissemination plans of this research. Refer to the Methods section for further details.
Provenance and peer review Not commissioned; externally peer reviewed.
Supplemental material This content has been supplied by the author(s). It has not been vetted by BMJ Publishing Group Limited (BMJ) and may not have been peer-reviewed. Any opinions or recommendations discussed are solely those of the author(s) and are not endorsed by BMJ. BMJ disclaims all liability and responsibility arising from any reliance placed on the content. Where the content includes any translated material, BMJ does not warrant the accuracy and reliability of the translations (including but not limited to local regulations, clinical guidelines, terminology, drug names and drug dosages), and is not responsible for any error and/or omissions arising from translation and adaptation or otherwise.