Article Text

Abstract
Objective We aimed to identify the country-level determinants of the severity of the first wave of the COVID-19 pandemic.
Design Ecological study of publicly available data. Countries reporting >25 COVID-19 related deaths until 8 June 2020 were included. The outcome was log mean mortality rate from COVID-19, an estimate of the country-level daily increase in reported deaths during the ascending phase of the epidemic curve. Potential determinants assessed were most recently published demographic parameters (population and population density, percentage population living in urban areas, population >65 years, average body mass index and smoking prevalence); economic parameters (gross domestic product per capita); environmental parameters (pollution levels and mean temperature (January–May); comorbidities (prevalence of diabetes, hypertension and cancer); health system parameters (WHO Health Index and hospital beds per 10 000 population); international arrivals; the stringency index, as a measure of country-level response to COVID-19; BCG vaccination coverage; UV radiation exposure; and testing capacity. Multivariable linear regression was used to analyse the data.
Primary outcome Country-level mean mortality rate: the mean slope of the COVID-19 mortality curve during its ascending phase.
Participants Thirty-seven countries were included: Algeria, Argentina, Austria, Belgium, Brazil, Canada, Chile, Colombia, the Dominican Republic, Ecuador, Egypt, Finland, France, Germany, Hungary, India, Indonesia, Ireland, Italy, Japan, Mexico, the Netherlands, Peru, the Philippines, Poland, Portugal, Romania, the Russian Federation, Saudi Arabia, South Africa, Spain, Sweden, Switzerland, Turkey, Ukraine, the UK and the USA.
Results Of all country-level determinants included in the multivariable model, total number of international arrivals (beta 0.033 (95% CI 0.012 to 0.054)) and BCG vaccination coverage (−0.018 (95% CI −0.034 to –0.002)), were significantly associated with the natural logarithm of the mean death rate.
Conclusions International travel was directly associated with the mortality slope and thus potentially the spread of COVID-19. Very early restrictions on international travel should be considered to control COVID-19 outbreaks and prevent related deaths.
- infectious diseases
- public health
- epidemiology
This is an open access article distributed in accordance with the Creative Commons Attribution Non Commercial (CC BY-NC 4.0) license, which permits others to distribute, remix, adapt, build upon this work non-commercially, and license their derivative works on different terms, provided the original work is properly cited, appropriate credit is given, any changes made indicated, and the use is non-commercial. See: http://creativecommons.org/licenses/by-nc/4.0/.
Statistics from Altmetric.com
Strengths and limitations of this study
A relevant outcome variable quantifying country-level increases in the COVID-19 death rate was derived, which is largely independent of different testing policies adopted by each country.
Our multivariable regression models accounted for public health and economic measures, which were adopted by each country in response to the COVID-19 pandemic by adjusting for the stringency index.
The main limitation of the study stems from the ecological study design, which does not allow for conclusions to be drawn for individual patients with COVID-19.
Only countries that had reported at least 25 daily deaths over the analysed period were included, which reduced our sample and consequently the power.
Introduction
The atypical pneumonia caused by SARS-CoV-2 has spread rapidly. As of the 8 June 2020, there have been over 400 857 deaths related to COVID-19 infection worldwide.1 The estimated overall case fatality rate is ~7%, with country-level estimates ranging between 0.5% and 14%.2 Nevertheless, there is wide variation in the reported country-specific death rates which may be attributed to variation in testing rates, under-reporting or real differences in environmental, sociodemographic and health system parameters.
Country-level determinants of the pandemic severity are largely unknown. The only previous ecological study to date assessing country-level determinants of the severity of the COVID-19 pandemic including data on 65 countries3 has found that the cumulative number of infected patients in each country was directly associated with the case fatality rate, while testing intensity was inversely associated with case fatality rate. This study found no association between health expenditure and case fatality rate. However, other important country-level determinants were not evaluated, and thus, their relationship with pandemic severity remains unknown.
Several risk factors for COVID-19 related mortality have been proposed, including older population,4 higher population comorbid burden,5 smoking,6 obesity,7 pollution levels8 and healthcare system performance.9 Furthermore, countries outside China most severely hit by the first wave of the pandemic were those with a high income, high gross domestic product (GDP) per capita and well-established healthcare systems, such as Italy, Spain, France, the UK and the USA.10 In contrast, lower-income and middle-income countries reported much lower COVID-19 incidence and mortality rates.10 While these differences may be attributable to case under-reporting and infrequent testing in these countries, other factors may also be involved.
In this study, we aimed to assess the country-level determinants of the severity of the first wave of the COVID-19 pandemic based on currently available evidence using publicly available data and an ecological study design.
Methods
Patient and public involvement
There was no patient or public involvement in designing the study given the urgent nature of the COVID-19 pandemic and the usage of publicly available data.
Study design
An ecological study design was used. The outcome was the steepness of the ascending curve of country-specific daily reports of COVID-19 related deaths between 31 December 2019 and 8 June 2020. The following determinants were assessed: demographic determinants (population and population density, percentage population living in urban areas, proportion of population aged 65 years and over, average body mass index (BMI) and smoking prevalence); economic determinants (GDP per capita); environmental determinants (pollution levels and mean temperature (January–May) (2010–2016)); prevalent comorbidities (diabetes, hypertension and cancer); health systems determinants (WHO Health Index and hospital beds per 10 000 population); international arrivals (as a proxy measure of the globalisation status of each country); the stringency index (SI) (as measure of country level response to the pandemic)11; exposure to UV radiation (as a proxy for sunlight exposure); BCG vaccination coverage; and testing capacity.
Ethics committee approval
Given the study design and the use of publicly available data, no ethical approval was considered necessary.
Selection criteria
Countries reporting at least 25 daily deaths up to 8 June 2020 with available data for all chosen determinants were included. A total of 37 countries from four continents were included in the analysis: Africa (Algeria, Egypt and South Africa), America (Argentina, Brazil, Canada, Chile, Colombia, the Dominican Republic, Ecuador, Mexico, Peru and the USA), Asia (India, Indonesia, Japan, the Philippines, Saudi Arabia and Turkey) and Europe (Austria, Belgium, Finland, France, Germany, Hungary, Ireland, Italy, the Netherlands, Poland, Portugal, Romania, the Russian Federation, Spain, Sweden, Switzerland, Ukraine and the UK). China was not included in the analysis due to potential inaccuracies in the number of daily reported deaths that may have occurred subsequent to 1290 deaths, which were retrospectively reported on 17 April.12
Data sources
Country-level parameters were obtained from freely accessible data sources. The daily reported number of COVID-19 cases and deaths between 31 December 2019 and 8 June 2020 as well as the 2018 population data were extracted from the European Centre for Disease Control.13
The data regarding the median population age and population density were extracted from the United Nations World Population Prospects14 and United Nations Statistics Division, respectively.15 The data regarding the percentage of the population living in urban areas were extracted from the World Urbanisation Prospects, issued by the United Nations Population Division.16 Temperature data were extracted from the Climate Change Knowledge Portal from the World Bank Group.17 Prevalent diabetes, GDP, international arrivals in 2018 and current health expenditure data were extracted from the World Development Indicators database, provided by the World Bank Group.18 Data regarding prevalent cancers, proportion of population aged 65 years and over and the total number of COVID-19 tests performed were extracted from the Our World in Data and the Sustainable Development Goals tracker,19 20 an open-access publication tracking global progress to the United Nations Sustainable Development Goals for global development, adopted in September 2015. Prevalent hypertension, BMI, cigarette smoking, ambient air pollution, ultraviolet (UV) radiation and BCG vaccination data were obtained from the Global Health Observatory data repository of the WHO.21 The WHO health index was extracted from the WHO Global Partnership for Education paper series published in 2000.22 Country-level total hospital beds per 10 000 population data were extracted from the World Bank Dataset ‘World Bank Indicators of Interest to the COVID-19 Outbreak’.23 Daily SI measurements between 31 January 2019 and 8 June 2020 were extracted from the Oxford COVID-19 Government Response Tacker.11
Definition of outcome and determinants
Outcome
While previous ecological studies of other epidemics have used case or death counts as outcome,24 this may be prone to bias due to variations in country-level testing strategies,25 variations in population movement controls and differences in secondary attack rates within community cohorts.26 The mean mortality rate was thus chosen as outcome instead, since it is independent of these parameters and may thus represent a more reliable indicator of the country-level severity of the COVID-19 pandemic.
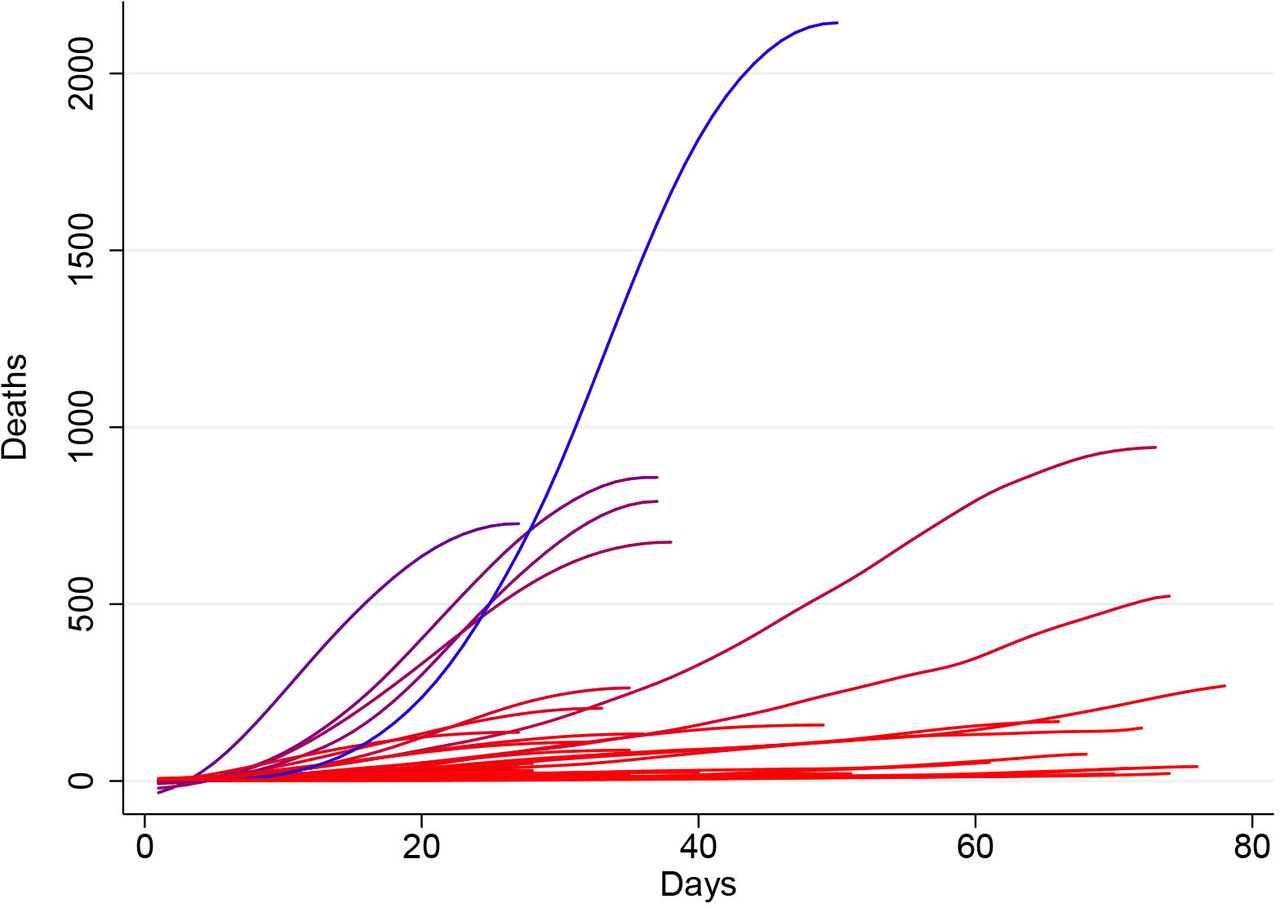
Mean mortality rate was defined as the mean slope of the mortality curve (figure 1), measured from the first day when more than two COVID-19 deaths were reported until either the mortality curve reached a peak value or 8 June 2020, whichever occurred first. The peak of each mortality curve was defined as the first point at which the first derivate of the COVID-19 mortality curve as a function of the pandemic timeline became zero. Before slope calculation, the mortality curve in each country was smoothed using a locally weighted (Lowess) regression using a bandwidth of 0.4. In order to ensure a good fit of the Lowess regression line, only countries having reported at least 25 daily deaths until the 8 June 2020 were included. The mean mortality rate thus represents an estimate of the country-level daily increase in reported deaths during the ascending phase of the epidemic curve.

Graphical representation of the smoothed* number of daily deaths of each country (before reaching mortality peak, if applicable) as a function of the number of days passed since the first day when an excess of three deaths were reported. Countries with higher mean mortality rates are depicted in blue, while those with lower mean mortality rates are depicted in red. *Smoothed using a local regression (Lowess) function with a bandwidth of 0.4.
Determinants
Data on population density were extracted as the country-level population per square kilometre in 2019.27 Data on ambient air pollution were extracted as the country-level mean concentration of fine particulate matter (PM2.5) measured in 2016.28 Temperature data were extracted as the mean temperature recorded in each country between January and May using temperature data recorded between 2010 and 2016.17 Data on international arrivals were extracted as the total number of country-level international arrivals in 2018.29
Data on prevalent diabetes were extracted as the percentage of the population aged 20–79 years in 2019.18 Data on prevalent cancers were extracted as the age-standardised cancer prevalence among both sexes in 2017, expressed as percentages.30 Data on prevalent hypertension were extracted as the age-standardised percentage of the population over 18 years of age with systolic blood pressure ≥140 mm Hg or diastolic blood pressure ≥90 mm Hg in 2015.31 Data on BMI were extracted as the age-standardised mean body mass index trend estimates for both sexes among adults (≥18 years) in 2016.32 Data on daily cigarette smoking were extracted as the age-standardised smoking rate across both sexes among adults (≥18 years) in 2013.33 While the definition of ‘daily cigarette smoking’ varies across surveys, it habitually refers to current smoking of cigarettes at least once a day.33
Data on GDP were extracted as GDP per capita by purchasing power parity (PPP) in current international dollars in 2018.34 The percentage of population living in urban areas was defined as the percentage of de facto population living in areas classified as urban according to the criteria used by each area or country.16 The WHO health index is a composite index that aims to evaluate a given country’s healthcare system performance relative to the maximum it could achieve given its level of resources and non-healthcare system determinants. It was calculated in the year 2000. The index uses five weighted parameters: overall or average disability-adjusted life expectancy (25%), distribution or equality of disability-adjusted life expectancy (25%), overall or average healthcare system responsiveness (including speed of provision and quality of amenities; 12.5%), distribution or equality of healthcare system responsiveness (12.5%) and healthcare expenditure (25%). Data on hospital beds per 10 000 population were defined by the World Bank as including ‘inpatient beds available in public, private, general, and specialized hospitals and rehabilitation centres’. The published data for the included countries were between 2000 and 2017. In most cases, beds for both acute and chronic care were included.23 The SI is an overall indicator of public health measures adopted by each country in response to the COVID-19 pandemic and includes containment and closure indicators (school closures, workplace closures, cancelling public events, restrictions on gatherings, public transport closures, stay-at-home requirements, restrictions on internal movements and international travel controls), economic response indicators (income support, debt/contract relief, fiscal measures and international support) as well as health system indicators (public information campaigns, testing policy, contact tracing, emergency investment in healthcare and investment in vaccines).11 The mean daily SI was calculated for each country between 31 December 2019 and until either the mortality curve reached a peak value or 8 June 2020, whichever occurred first.
Country-level exposure to UV radiation was quantified as the population-weighted average daily ambient ultraviolet radiation level measured in J/m2 for the years 1997–2003.35 BCG vaccination coverage was quantified as the average percentage of 1-year-old children having received the BCG vaccine between 1980 and 2019 in each country. Testing capacity was quantified as the total number of COVID-19 tests per 1000 population performed until 8 June 2020.
Country-level intensive care unit (ICU) capacity was not included in the analyses, given the absence of a database centralising this information and the resulting poor reporting. Furthermore, ICU capacity data were unavailable for several important countries included in our analyses, such as Algeria, Argentina, Chile, the Dominican Republic, Ecuador, Egypt, India, Indonesia, Peru, the Philippines, Saudi Arabia and Ukraine.
Statistical analysis
All analyses were performed in Stata V.15.1SE, Stata Statistical Software. A 5% threshold of statistical significance was used for all analyses (p<0.05). Linear regressions were performed to assess the univariable relationship between each country-level determinant and the calculated mean mortality rate for each country. The following factors were included in the univariable analyses: the natural logarithm of the population in 2018 (10 million increase), percentage of population aged 65 years and over, pollution levels, mean temperature (January–May), international arrivals in 2018 (1 million increase), population density, prevalent diabetes, prevalent neoplasms, median BMI, prevalent hypertension, smoking prevalence, hospital beds (per 10 000 population), WHO health index, percentage population living in urban areas, GDP per capita (PPP), UV radiation exposure, mean BCG coverage and the SI. The following determinants reaching a p value <0.3 at univariable level were then included in a multivariable logistic regression model with the natural logarithm of the mean mortality rate as outcome: the logarithm of the total population in 2018, percentage of population aged 65 years and over, pollution, mean temperature (January–May), international arrivals, population density, prevalent neoplasms, prevalent hypertension, the WHO health index, population living in urban areas, GDP per capita, UV radiation exposure, mean BCG coverage and the SI. Such a determinant selection process was chosen in order to lessen the likelihood of excluding factors that may be important but would not reach statistical significance due to the relatively small sample size of the study.
Given that testing capacity data for 8 (Algeria, Brazil, Egypt, France, Germany, the Netherlands, Spain and Sweden) of the 37 included countries were not available, a secondary analysis also including testing capacity as a determinant was performed considering only the remaining 29 countries. Linear regressions were performed to assess the univariable relationship between each country-level determinant and the calculated mean mortality rate for each country. The following determinants reaching a p value <0.3 at univariable level were then included in a multivariable logistic regression model with the natural logarithm of the mean mortality rate as outcome: the logarithm of the total population in 2018, percentage of population aged 65 years and over, international arrivals, population density, prevalent neoplasms, prevalent hypertension, GDP per capita, UV radiation exposure, mean BCG coverage, the SI and testing capacity.
Results
Table 1 and online supplemental file 1 detail the analysed data for the 37 included countries, including the calculated mean mortality rates. The mean mortality rates ranged between 0.22 (Chile) and 43.74 (the USA) new daily deaths. Only five included countries had a high mean mortality rate (>10): the USA (43.74), Spain (29.23), the UK (24.05), France (22.13), Italy (18.79) and Brazil (13.09).
Supplemental material
Observed mean mortality rate during the ascending phase of the first wave of the COVID-19 pandemic and number of international arrivals in 2018 (millions) for each country included in the analyses
Table 2 details the results of the linear regression analyses. The following country-level determinants showed a statistically significant relationship with log mean mortality rate in univariable analyses: natural logarithm of population, international arrivals, prevalent neoplasms, prevalent hypertension, GDP per capita and BCG vaccination coverage. On multivariable adjustment, international arrivals in 2018, as a marker of global connection, was significantly associated with an increase in the log mean mortality rate (0.033 (95% CI 0.012 to 0.054) per 1 million increase in international arrivals, p=0.003). This translates to an exp(B) of 1.034, equivalent to a 3.4% increase in the mean mortality rate for every 1 million increase in the number of international arrivals in 2018. Furthermore, the mean BCG vaccination coverage was associated with a decrease in log mean mortality rate (−0.018 (95% CI −0.034 to –0.002) per 1% increase in BCG vaccination coverage, p=0.031). This translates to an exp(B) of 0.982, equivalent to a 1.8% decrease in mean mortality rate for every 1% increase in BCG vaccination coverage. Figures 2 and 3 detail the relationship between the country-level log mean mortality rate (predicted and observed) and each country-level determinant included in the multivariable regression model.

Predicted (based on the results of the multivariable linear regression) and observed country-level mortality rate (mean daily increase in deaths until the peak in mortality) as a function of the recorded country-level number of international arrivals in 2018 (millions). The solid red line represents the point estimate of the predicted log daily increase in deaths, while the blue-grey area represents the corresponding 95% CI. The crosses represent the observed values of the log daily increase in deaths.

Predicted (based on the results of the multivariable linear regression) and observed country-level mortality rate (mean daily increase in deaths until the peak in mortality) as a function of each country-level determinant included in the multivariable model. The solid red lines represent the point estimates of the predicted log daily increase in deaths, while the blue-grey areas represent the corresponding 95% CI. The crosses represent the observed values of the log daily increase in deaths.
Results of the linear regression assessing the association between country-level determinants and the daily increase in deaths
Table 3 details the results of the secondary linear regression analyses, including only countries having reported COVID-19 testing data up to 8 June 2020. The following country-level determinants showed a statistically significant relationship with log mean mortality rate at univariable level: natural logarithm of population, international arrivals, prevalent neoplasms, prevalent hypertension, BCG vaccination coverage and total COVID-19 tests per 1000 population performed until 8 June 2020. On multivariable adjustment, the statistically significant determinants of log mean mortality rate were: international arrivals in 2018 (0.036 (95% CI 0.008 to 0.063) per 1 million increase in international arrivals, p=0.013), prevalent hypertension (−0.129 (95% CI −0.246 to –0.012) per 1% increase in country-level hypertension prevalence, p=0.032) and testing capacity (0.018 (95% CI 0.001 to 0.034) for 1 per 1000 population increase in the number of total COVID-19 tests performed until 8 June 2020, p=0.039).
Results of the secondary linear regression assessing the association between country-level determinants and the daily increase in deaths, including only countries reporting total COVID-19 tests performed up to 8 June 2020
Discussion
Principal findings
In this ecological study including data from 37 countries that were most severely affected by COVID-19 in the first wave of current global pandemic, we assessed 19 country-level socioeconomic, environmental, health and healthcare system and globalisation parameters as potential determinants of the death rates associated with COVID-19. In the multivariable linear regression model, the main determinant that reached statistical significance was international arrivals, a proxy of global connection: a 1 million increase in the number of international arrivals in 2018 was associated with a 3.4% increase in the mean daily increase in COVID-19 deaths during the ascending phase of the first wave of the pandemic. Furthermore, country-level BCG vaccination coverage was associated with decreases in the COVID-19 mean mortality rate during the first wave of the pandemic. Finally, in our secondary analyses including only country with available testing capacity data, the total number of COVID-19 tests performed per 1000 population until 8 June 2020 was also associated with increases in the COVID-19 mean mortality rate.
Comparison with previous literature
A previous ecological study analysed the country-level determinants of the COVID-19 case fatality rate including 65 countries.3 This study found that on adjustment for epidemic age, health expenditure and world region, the case fatality rate was significantly associated with increasing cumulative number of COVID-19 cases and decreasing testing intensity.3 Nevertheless, no other country-level determinants were included in this study.
Further comparisons can be made with data from previous pandemics. A negative association has been reported between health expenditure and death rates from the 2009 influenza pandemic in 30 European countries.24 Associations have also been reported between airline travel and spread of the H1N1 influenza virus infection.36
Comorbidities may account for mortality rate differences between countries. A study among laboratory-confirmed cases of COVID-19 in China showed that patients with any comorbidity, including diabetes, malignancy and hypertension, had poorer clinical outcomes than those without.5 We thus accounted for country-level data on a selection of key comorbidities that included prevalent diabetes mellitus, neoplasms and hypertension. BMI ≥40 kg/m2 has been identified as an independent risk factor for severe COVID-19 illness.7 Finally, a recent systematic review on five studies from China showed that smoking is likely associated with negative outcomes and progression of COVID-19.6
Interpretation of findings
In our multivariate model, the main significant determinant of mortality was international arrivals. Travel restrictions and their effectiveness in containing respiratory virus pandemics remains a contentious subject. In 2007, the WHO published a protocol on ‘rapid operations to contain the initial emergence of pandemic influenza’, which included recommendations on travel restrictions.37 However, subsequent guidance advises such restrictions are not recommended once a virus has spread significantly.38 A recent systematic review of 23 studies that demonstrated limited impact of travel restrictions in the containment of influenza: internal travel restrictions delayed pandemic peak by approximately 1.5 weeks, while 90% air travel restriction delayed the spread of pandemics by approximately 3–4 weeks but only reduced attack rates by less than 0.02%.39 However, another systematic review of combination strategies for pandemic influenza response showed that combination strategies including travel restrictions increased the effectiveness of individual policies.40
The WHO recommendations for pandemic preparedness and resilience suggest that points of entry into the country should be monitored by focusing on surveillance and risk communication to travellers but falls short of closing down international travel.41 Interestingly, during the COVID-19 pandemic, some countries such as Thailand have adopted aggressive international travel screening and isolation policies, which may have led to lower infection rates.42 Our study suggests that travel restrictions have the potential to influence the impact of the COVID-19 pandemic and should be considered as part of a structured and rapidly instigated pandemic preparedness plan.
Our multivariable model also suggests an inverse relationship between BCG vaccination coverage and the mean mortality rate, in which increasing BCG vaccination coverage was associated with decreased mean mortality rate. The relationship between BCG vaccination and the evolution of the COVID-19 transmission and disease severity remains controversial.43 44 While the BCG vaccine has been postulated to exhibit non-specific immunomodulatory properties, which may reduce SARS-CoV-2 viraemia after exposure,43 current epidemiological evidence is derived from ecological studies45 and needs to be interpreted in the light of the inherent limitations of this study design. Further ongoing studies (NCT0432720646 and NCT0432844147) may provide more robust evidence regarding the association between BCG vaccination and COVID-19.
Our analyses also revealed a few surprising findings: the intensity of COVID-19 testing was apparently associated with mean mortality rate increases, while the country-level prevalence of hypertension was apparently associated with mean mortality rate decreases. These findings appear to be contradictory to previous evidence suggesting that testing intensity may be associated with decreased COVID-19 mortality,48 while hypertension was clearly associated with increased mortality.49 These surprising findings need to be interpreted in the light of our ecological study design in which residual confounders may influence these associations.
Strengths and limitations
The main strength of this study lies in its use of comparable and relevant outcome data derived from contemporary death reporting from countries affected by COVID-19. As testing rates for the virus vary across countries, the incidence or prevalence of the disease cannot be compared between countries. While death from the disease is a hard outcome, the denominator information to calculate death rates make between-country comparisons difficult. In addition, the deaths in the community, particularly in the elderly living in care homes, often go untested, and thus, firm diagnosis remains impossible. Therefore, in this study, we have adopted an outcome that is comparable in terms of the increase in the rate of death, rather than death rates per se. This may better represent the spread and seriousness of pandemic in individual countries when comparing countries at different stages of the pandemic. The country-level parameters assessed as potential factors have all been implicated at some point to be associated with severity and consequently mortality. We however found that the main determinant was the total number of international arrivals in the country (2018 figures), signifying transmission of the infection through travel. Although the data were from 2018, there is no reason to believe that international travel figures between countries would be different in early 2020. Furthermore, our multivariable model also accounts for country-level international travel restrictions adopted in response to the spread of COVID-19.
The main limitation of the study stems from the ecological study design. Despite the fact that we did not find any association between comorbidities such as diabetes and cancer and the mean death rates at country level, it is possible for an individual with any or all of these comorbid conditions to be more susceptible to the infection and consequently at increased risk of dying. Only including countries that had reported at least 25 deaths reduced our sample and consequently the power. Furthermore, the reasonably large number of country-level determinants relative to the number of countries means that we cannot rule out the potential for overfitting in the multivariable model. This may lead to spurious associations between determinants and the outcome. Other explanatory variables associated with COVID-19 related mortality may have been missed, and some of the covariate data used in our model predate the COVID-19 outbreak and may not be relevant at this time point. Furthermore, as new countries are affected by the epidemic, the virulence of the virus and resistance of the human body may have changed over time, which was not accounted for in our model. It is also possible that the quality of data, especially under-reporting of deaths related to between-country differences in defining COVID-19 deaths, may have been associated with some of the determinants in our model as well as our chosen outcome and thus biased our results. Furthermore, the delay between COVID-19 symptom onset and hospitalisation may be an important factor in the overall clinical prognosis of patients with severe COVID-19 disease. Nevertheless, given that our analyses rely on country-level determinants and in the absence of individual patient data, it is impossible to ascertain the country-level trends of delay to hospital admission. Notwithstanding, some other country-level parameters pertaining to the accessibility of healthcare included in our analyses such as the number of hospital beds per 10 000 population, proportion of population living in urban areas as well as the WHO health index may account for such differences. Finally, we did not include ICU capacity data in our analyses due to a lack of a reliable data source centralising this variable. Nevertheless, our analyses account for country-level hospital beds per 10 000 population as an indicator of health systems’ coping capacity with increased pressures related to the pandemic.
Conclusion
Out of all the country-level parameters assessed, international travel was the main determinant of the severity of the first global wave of the COVID-19 pandemic. Given that many of world middle-income and lower income countries are showing signs of continued rise in infection rates, international travel restrictions applied very early in the pandemic course should be considered to avoid rapidly increasing infection and death rates globally. The associations between other determinants, such as BCG vaccination coverage, prevalent hypertension and COVID-19 testing capacity, and the outcome were weaker and need to be interpreted in the light of our ecological study design. Further studies are required to determine the relationship between previous BCG vaccination and COVID-19 disease progression.
Acknowledgments
We would like to thank Dr Kathryn Martin, who provided valuable advice in study design.
Footnotes
TAP and SB are joint first authors.
Twitter @tiberiupana, @WeroSzlachetka, @davemclernon
TAP and SB contributed equally.
Contributors PKM and SB conceived the idea. TAP, DTG, ZP, WAS, JAP-L and KDE collected data and performed literature search. TAP, PKM, DJM and SB developed analysis plan. TAP analysed the data under supervision of DJM. TAP and SB drafted the paper. All authors contributed to the interpretation of results and in making an important intellectual contribution to the manuscript. All authors read and approved the final manuscript.
Funding This work was supported by the Aberdeen Clinical Academic Training Scheme.
Competing interests None declared.
Patient consent for publication Not required.
Provenance and peer review Not commissioned; externally peer reviewed.
Data availability statement All data relevant to the study are included in the article or uploaded as supplementary information.
Supplemental material This content has been supplied by the author(s). It has not been vetted by BMJ Publishing Group Limited (BMJ) and may not have been peer-reviewed. Any opinions or recommendations discussed are solely those of the author(s) and are not endorsed by BMJ. BMJ disclaims all liability and responsibility arising from any reliance placed on the content. Where the content includes any translated material, BMJ does not warrant the accuracy and reliability of the translations (including but not limited to local regulations, clinical guidelines, terminology, drug names and drug dosages), and is not responsible for any error and/or omissions arising from translation and adaptation or otherwise.