Article Text

Abstract
Objectives To determine the effect of adjustment for intraindividual variation on estimations of urinary iodine concentrations (UIC), prevalence of iodine deficiency and population distribution of iodine status.
Setting Community-dwelling older adults from New South Wales, Australia.
Participants 84 healthy men and women aged 60–95 years were recruited prior to introduction of the mandatory iodine fortification programme.
Primary and secondary outcome measures UIC data were collected from three spot urine samples, each 1 week apart. Repeated measures analysis of variance were determined between-person (sb) and total (sobs) SDs. Adjusted UIC values were calculated as ((person's UIC−group mean)×(sb/sobs))+group mean, and a corrected UIC distribution was calculated.
Results The sb/sobs for using three samples and two samples were 0.83 and 0.79, respectively. Following adjustment for intraindividual variation, the proportion with UIC <50 μg/L reduced from 33% to 19%, while the proportion with UIC ≥100 μg/L changed from 21% to 17%. The 95th centile for UIC decreased from 176 to 136 μg/L. Adjustment by taking averages yielded a lesser degree of contraction in the distribution than the analysis of variance method.
Conclusions The addition of information about intraindividual variability has potential for increasing the interpretability of UIC data collected to monitor the iodine status of a population.
- PUBLIC HEALTH
- EPIDEMIOLOGY
- NUTRITION & DIETETICS
- PRIMARY CARE
This is an Open Access article distributed in accordance with the Creative Commons Attribution Non Commercial (CC BY-NC 3.0) license, which permits others to distribute, remix, adapt, build upon this work non-commercially, and license their derivative works on different terms, provided the original work is properly cited and the use is non-commercial. See: http://creativecommons.org/licenses/by-nc/3.0/
Statistics from Altmetric.com
Strengths and limitations of this study
-
Three repeated spot urine samples were collected from each subject to allow assessment of intra-individual variability of iodine excretion.
-
There was little additional benefit of collecting three rather than two UIC measurements per person, but this may not be the case in other populations.
-
Older adults, who typically have a less varied diet than younger populations, were sampled, therefore generalisability to other age groups may be limited.
Introduction
Iodine deficiency is one of the most common nutrient deficiencies in the world, with almost one billion people affected. Populations that consume diets that contain small amounts of fish and seafood, moderate to low quantities of milk and dairy products and include locally produced fruits and vegetables grown in iodine-poor soils are likely to be iodine deficient. Iodine deficiency impacts across the life stages.1 It affects growth and development (both cognitive and motor) during pregnancy, infancy and childhood. In older adults, iodine deficiency may play a role in declining cognitive function.1 Consequently, good quality population-level data on iodine status is required to assess population status and design strategies which correct any deficiency but avoid introducing excessive intakes. The iodine status of populations is defined by calculating urinary iodine concentrations (UIC) from spot urine samples collected in a representative sample and comparing the median UIC (MUIC) against reference ranges.2 Daily urinary excretion of iodine closely reflects iodine intake in non-pregnant populations, therefore MUIC of a group is considered to be a valid biomarker of the status of that group.3 However, the concentration measured in a single spot sample has large variation from day to day within individuals.4–6 This increases the spread of the distribution7 ,8 so that it does not reflect the range of long-term or ‘usual’ iodine status around the median in the population. It is the habitual intake of iodine, not the intake on any 1 day, that determines iodine status of groups. Consequently, a method to reduce or remove the effects of the measurement error due to the intraindividual variation that results from collecting a single-spot urine sample from each survey participant would allow a greater description of the population status.
Several methods exist to correct for intraindividual variation in population survey data. One method is to collect multiple days of data on each survey participant and average the data for each participant. This has substantial logistical costs when conducting a national survey. Another method is to apply a correction factor to the distribution.8 ,9 This requires estimating the correction factor, for example, by collecting multiple samples from a representative subset of the survey population.
This second method has been applied many times to dietary intake data10–12 but has been applied less frequently to biochemical data.13–15 In a survey of indigenous Australian adolescents with MUIC of 51 µg/L, correcting the distribution based on two urine samples per person reduced the 95th centile from 129 to 92 µg/L13 ,14 have highlighted the widespread misuse of calculating the proportions of UIC below the cut-off level of 100 µg/L to estimate the prevalence of iodine deficiency. This will overestimate or underestimate the proportion with deficiency depending on the location of the median. In the previous example,13 the raw data would be misinterpreted as showing that 90% were <100 µg/L, whereas this was 97% after correction for within-person variation. In clearly deficient populations, this difference is not important for programme planning. However, as a population approaches sufficiency, accurate estimation becomes more important for refining programmes. Similarly in replete populations, an accurate estimate of the high intake is needed to assess whether part of the population is reaching potentially adverse levels.
Remote indigenous people have a different lifestyle from that of urbanised non-Indigenous Australians. In this study, we investigate the intraindividual variation in UIC in older non-Indigenous Australians, living in an urban iodine-deficient area prior to the introduction of mandatory fortification. We extend previous work by examining the impact of having two versus three samples for calculating the correction factor and compare this with the effect of averaging the results for each person.
Methods
Participants and recruitment
Between May and September 2009, 110 adults aged 60–95 years volunteered for a study that investigated the association between iodine status and cognition. English-speaking men and women were recruited from a random selection of aged care facilities (independent, assisted and low care living) in the Illawarra region, south of Sydney in Australia. Of the 110 participants, 84 participants (25 men) met the study inclusion criteria and were enrolled. Twenty-six participants were excluded due to: (1) diagnosed dementia and/or Alzheimer's disease, (2) cognitive decline as indicated by a Mini-Mental State Examination (MMSE score of ≤23,16 (3) a previous stroke, (4) current use of thyroxine or any other medications that may affect memory, (5) uncontrolled hypertension (blood pressure (BP) ≥160/95 mm Hg) and (6) uncontrolled diabetes (blood glucose (BG) ≥7.8 mmol/L). The study protocol was approved by the Human Research Ethics Committee of the University of Wollongong and all participants provided written informed consent.
Weight (Tanita Scale, TBG622, Tanita Inc, Tokyo, Japan) and height (stadiometer) of the participants were measured. Body mass index was calculated as the ratio of weight (kg) divided by height squared (m2). Nutritional status was assessed using the 18-item Mini Nutritional Assessment (MNA) which has been previously validated in older adults and classified according to categories of well nourished, at-risk or malnourished.17 The Barthel index18 was administered to assess the ability to perform Activities of Daily Living, with a score of >50/100 indicating independence.
Biochemical data
Participants were provided with written instructions for spot urine sample collections, which included collection of the first voiding of the day, on the same day each week, where possible, over a 3-week period. Urine samples were stored at −80°C and batch-analysed by the accredited laboratory of the Institute of Clinical Pathology and Medical Research (ICPMR), Westmead Hospital (Sydney, New South Wales, Australia). UIC was analysed using an adaptation of the Sandell-Kolthoff method using an ammonium persulfate digestion and microplate reading.19 The coefficient of variation (CV) of the urinary iodine assay in the ICPMR laboratory is 16.7% at 46±7.72 µg/L, 5.8% at 153±8.9 µg/L and 8.65% at 347±30 µg/L. The group MUIC was compared with population-specific reference values.2
Statistical analyses
The UIC data were transformed using the natural logarithm to improve normality. Repeated measures analysis of variance was performed to determine the between-person (sb) and total (sobs) SDs. An adjusted log UIC value was calculated for each person as20:
adjusted UIC=((person's day 1 UIC−group mean for day 1) × (sb/sobs)) + group mean for day 1 (equation 1).
The results were exponentiated. The adjustment procedure was performed twice using SAS (V.9.2, SAS Cary, North Carolina, USA). First, the correction factor (sb/sobs) was calculated using all three replicates, then it was calculated using only the first two replicates.
We also calculated the average for each person using all three replicates and for the first two replicates. Centiles of the distribution and the proportion below selected values were calculated for the raw day 1 data and for distributions derived using adjustment or averaging. Descriptive analyses were performed using IBM SPSS (V.19.0 IBM Corporation, Armonk New York, USA).
Results
Sociodemographic characteristics of the study participants are shown in table 1. All except 4 (5%) were classified as being well nourished according to the MNA classification, with the remainder in the ‘at-risk’ category. All the participants were independently able to perform activities of daily living.
Demographic and clinical characteristics of the study particpants (n=84)
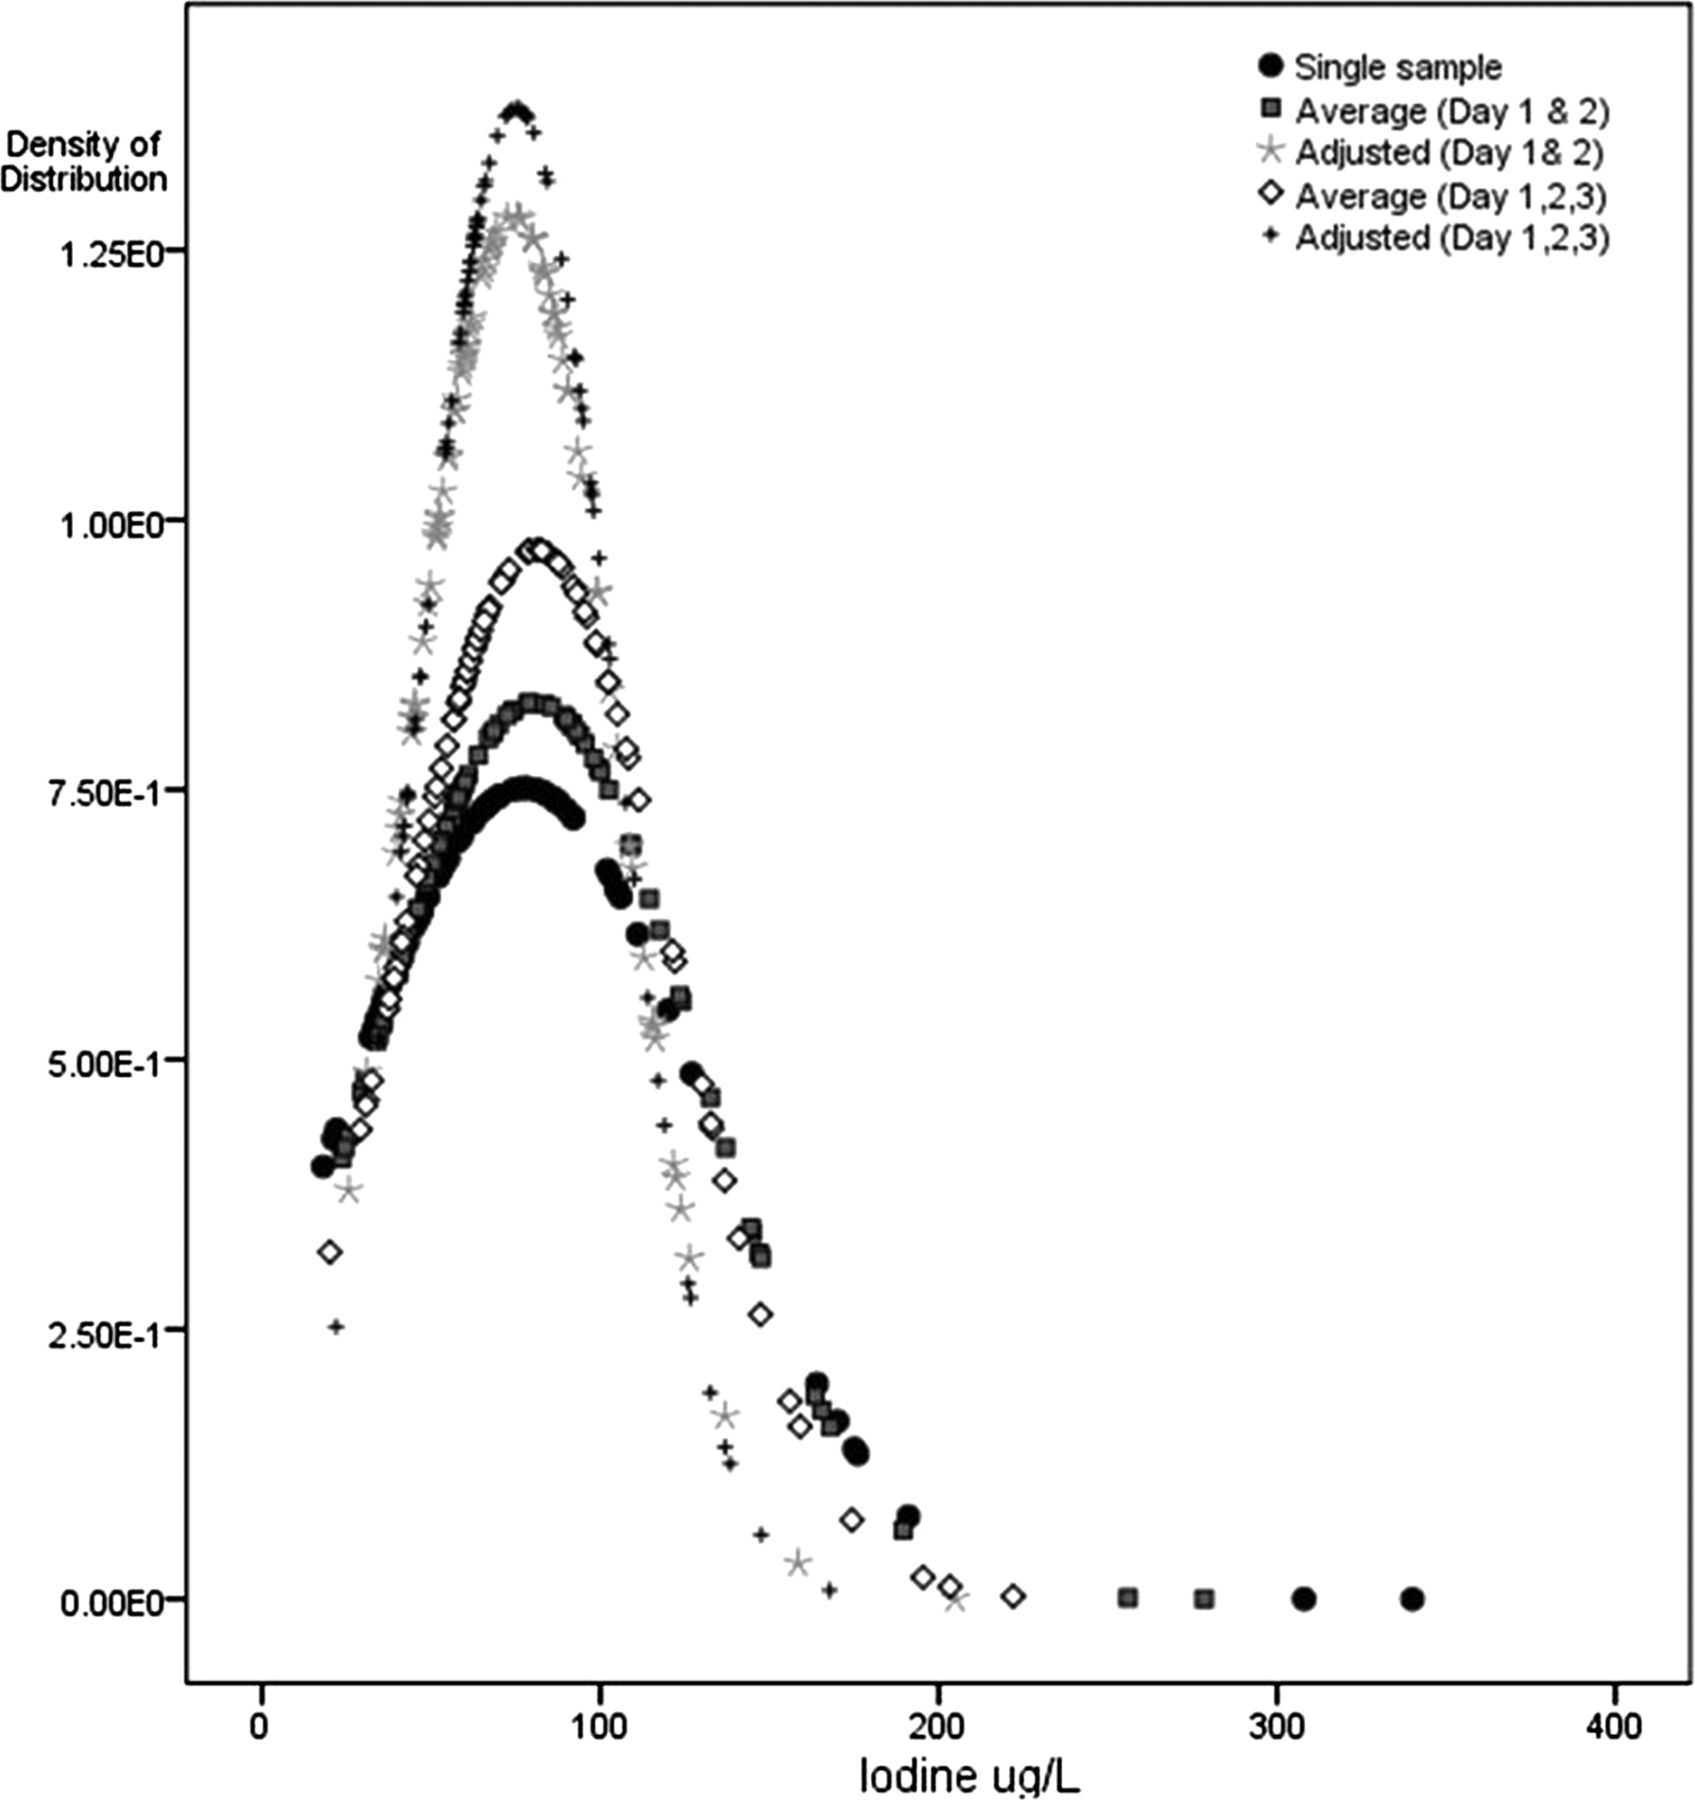
MUIC of the study population using the first spot urine collection indicated mild iodine deficiency (65.5 (IQR 42–89)) μg/L). Correlations for transformed urinary iodine concentration values were: days 1 and 2: r=0.48, p<0.01; days 1 and 3: r=0.43, p<0.01; days 2 and 3: r=0.41, p<0.01. The distribution of urinary iodine concentrations calculated by the different methods is shown in table 2 and figure 1. The sb/sobs was 0.83 when calculated using three replicates and 0.79 when calculated using two replicates; that is, the contraction in the distribution was slightly less with two replicates than three. Compared with the raw distribution, adjustment and averaging reduced the spread of the distribution, especially at the upper end owing to the right skew in the data. Following adjustment using the three urine collections, the MUIC remained unchanged but the IQR was shifted upwards 65.2 (55–94) while the upper end of the distribution (95th centile) changed from 176 to 136 μg/L. The percentage of participants with UIC <100 μg/L increased from 79% to 83% following adjustment.

Population distribution of urinary iodine, according to number of days of spot urine collection.
Urinary iodine concentration distribution, raw data from 1 day, after adjustment for intraindividual variation of two and three spot sample collections and averages of multiple collections
Taking an average of the three replicates also yielded similar results to taking an average of only two replicates. The averaging method contracted the distribution less than the adjustment method and, in particular, had less effect in drawing the upper tail towards the median.
Discussion
In this population with a suboptimal iodine status, the collection of a single urine sample from each participant would lead to different conclusions about the extremes of the population distribution of UIC. This has also been shown previously in Indigenous Australian adolescents13 and young Swiss women.14
In our population, there was no gain in having three, rather than two, samples as both adjustment factors were approximately 0.8 on the natural logarithmic scale. This means that the SD of the final distribution is 80% of the original. The lower the ratio, the higher the correction—for example, a ratio of 0.5 would have resulted in a distribution with a SD of half the width of the original.21 We do not know whether having a greater number of replicates, such as 7 or 14, or including different seasons, would have yielded the same result. Our urinary findings are consistent with the low variability in dietary iodine intake assessed at the same time in this population living in low-level residential aged care facilities.22 A similar adjustment ratio of 0.69 on the natural logarithmic scale for UIC has been reported in indigenous adolescents from the Darwin area, whose dietary patterns are limited in variety.13 We hypothesise that the degree of adjustment would be larger in other populations that have more variety in food intake.
Heterogeneity in the iodine content of different foods and their frequency of consumption in different populations will affect the magnitude of intraindividual variability in UIC. This suggests that the intraindividual variability in UIC would change after a fortification programme is introduced. It could be further hypothesised that the intraindividual variability might increase if one or a small number of foods are fortified, particularly at high concentrations. In Tasmania, the IQR widened as the MUIC value increased following iodisation of salt (25–65 g iodine/kg salt) used in bread. Prefortification, MUIC in schoolchildren was 73 (IQR 56–100) μg/L, which increased to 108 (73–158) μg/L following voluntary fortification and to 132 (96–198) μg/L postmandatory fortification.23 However, it is not possible to compare these results to studies which report other parameters for the UIC distribution such as the range14 or the 10–90th centiles.24 It is less clear whether variability would increase or decrease if a wide range of foods are fortified and/or at a lower concentration. We hypothesise that adjustment factors need to be reassessed if iodine intake changes and multiple factors might be needed if there is a geographical variation in iodine status within a country.
The greater narrowing in population distribution that results from the adjustment method, compared with the averaging method, is expected if multiple days are needed to estimate the long-term UIC for an individual. This is because the average of few days of urinary collection would still contain intraindividual variation. However, studies that collect a greater number of replicate samples than in the current study are still needed to compare the distribution determined by statistical adjustment to a directly assessed long-term average UIC. Another consideration is the use of spot urine samples as a proxy for assessment of iodine status at a population level. A spot sample does not reflect the intake over an entire day for which a 24 h collection would be needed. Konig et al25 have reported a trend for higher intraindividual variation for spot UIC (38%) versus measured 24 h urinary iodine excretion (32%).
Our study sample comprised older adults, an age group which has been studied least for iodine status, and who also often have impaired renal function. We have previously suggested that spot urinary iodine concentrations may be underestimating 24 h excretion in this study population22 but this would not impact on intraindividual variability of UIC which is the topic of the current article. Any variation in day-to-day fluid intake would be included in the changing UIC for each person in the study on each day of collection. However, as the samples were all collected within a 3-week period, we have not included any variation in fluid intake related to seasons. This may have underestimated the degree of adjustment in this population. However, a reduction in total fluid intake, and therefore urine volume, might or might not affect the day-to-day variation.
In our study, we had replicate samples on all participants. A more logistically feasible alternative in a large survey is to collect the replicates in a representative subset and apply the adjustment factor calculated in the subset to the whole population. It may be necessary to subdivide the population, for example, by age and sex, and ensure that there are enough participants in each subdivision to permit a suitable range of adjustment factors to be calculated. The method we have used20 is the simplest of several methods that have a similar purpose.26 The disadvantage of collecting replicates in a subset only is that, although an estimate of the usual UIC distribution of the population is obtained, the method treats each individual as representative of a larger group and so the value calculated for each individual in equation 1 is theoretical. Therefore, if it is desired to link the intake with excretion at an individual level, then replicate information about intake and excretion for each survey participant would be preferable but it is also possible to correct a regression coefficient for within-person variability.27 In addition, the method we used assumes that the data can be normalised. If this is not true, then alternatives include calculating an average for each participant28 or using a complex method such as the National Cancer Institute method.29
Conclusion
In a sample of healthy older Australian adults who were iodine deplete, the use of two or three spot urine samples for adjustment of intraindividual variation in urinary iodine concentration resulted in a narrowed population distribution, particularly at the upper end. Statistical adjustment yielded a stronger correction than averaging the replicates. There was no important gain in collecting a third sample in this population; however, this finding might be specific to our group and not generalisable to other age groups. The impact of the adjustment in narrowing the distribution would be greater in groups with more varied dietary intakes, and therefore wider intraindividual variation in UIC. These results provide a case for further work to investigate the usefulness of determining adjustment factors to remove intraindividual variability as part of population assessment of iodine status.
Acknowledgments
Associate Professor Gary Ma is thanked for analysis of the urinary iodine concentrations. Joanna Russell provided editorial assistance.
References
Footnotes
-
Contributors KEC was involved in conceptualisation of study design and drafting the initial manuscript. MJB was involved in statistical analysis and editing of the manuscript. LMTB was involved in participant recruitment, data collection, data entry and editing of the manuscript.
-
Funding This work was supported by the University of Wollongong Faculty Research Committee.
-
Competing interests None.
-
Patient consent Obtained.
-
Ethics approval Human Research Ethics Committee of the University of Wollongong.
-
Provenance and peer review Not commissioned; externally peer reviewed.
-
Data sharing statement No additional data are available.