Article Text

Abstract
Objective To evaluate clinical healthcare performance in Aboriginal Medical Services in Queensland and to consider future directions in supporting improvement through measurement, target setting and standards development.
Design Longitudinal study assessing baseline performance and improvements in service delivery, clinical care and selected outcomes against key performance indicators 2009–2010.
Setting 27 Aboriginal and Islander Community Controlled Health Services (AICCHSs) in Queensland, who are members of the Queensland Aboriginal and Islander Health Council (QAIHC).
Participants 22 AICCHS with medical clinics.
Intervention Implementation and use of an electronic clinical information system that integrates with electronic health records supported by the QAIHC quality improvement programme—the Close the Gap Collaborative.
Main outcome measures Proportion of patients with current recording of key healthcare activities and the prevalence of risk factors and chronic disease.
Results Aggregated performance was high on a number of key risk factors and healthcare activities including assessment of tobacco use and management of hypertension but low for others. Performance between services showed greatest variation for care planning and health check activity.
Conclusions Data collected by the QAIHC health information system highlight the risk factor workload facing the AICCHS in Queensland, demonstrating the need for ongoing support and workforce planning. Development of targets and weighting models is necessary to enable robust between-service comparisons of performance, which has implications for health reform initiatives in Australia. The limited information available suggests that although performance on key activities in the AICCHS sector has potential for improvement in some areas, it is nonetheless at a higher level than for mainstream providers.
Implications The work demonstrates the role that the Community Controlled sector can play in closing the gap in Aboriginal and Torres Strait Islander health outcomes by leading the use of clinical data to record and assess the quality of services and health outcome.
- Primary Care
This is an open-access article distributed under the terms of the Creative Commons Attribution Non-commercial License, which permits use, distribution, and reproduction in any medium, provided the original work is properly cited, the use is non commercial and is otherwise in compliance with the license. See: http://creativecommons.org/licenses/by-nc/3.0/ and http://creativecommons.org/licenses/by-nc/3.0/legalcode
Statistics from Altmetric.com
Article summary
Article focus
-
The Australian government has introduced a national reporting process for primary healthcare services using national key performance indicators.
-
This study evaluated clinical performance against key indicators in 22 Aboriginal and Islander Community Controlled Health Services (AICCHS) in Queensland during 2009–2010.
-
Future directions in supporting improvement through measurement, target setting and standards development are considered
Key messages
-
Performance was high for recording of key risk factors and healthcare activities including the assessment of tobacco use and management of hypertension but low for others. Performance between services showed the greatest variation for care planning and health check activity.
-
Careful interpretation of the factors underlying variation in performance is needed to support the planning of health service delivery and action for improvement at the local, regional and state levels. Many factors are likely to be related to circumstances beyond the immediate control of the health service such as remoteness and disadvantage.
-
Data collected suggest that although performance on key activities in the AICCHS sector has potential for improvement in some areas, it is nonetheless at a higher level than for mainstream providers.
Strengths and limitations of this study
-
The work demonstrates the role that a Community Controlled quality improvement programme can play in closing the gap in Aboriginal and Torres Strait Islanders’ health.
-
As the data are aggregated service level data, there may be a small number of patients using more than one service.
Introduction
The burden of morbidity, chronic disease and injury remains high in Aboriginal and Torres Strait Islander people in Australia, with Indigenous men and women having shorter lives than their non-Indigenous peers by 11.5 and 9.7 years, respectively.1 Chronic diseases, particularly diabetes, cardiovascular and renal disease, contribute significantly to this increased morbidity, beginning some 10 years earlier and at 2–5 times the rate of that experienced by other Australians. The Australian Government has made a significant commitment to reducing this disadvantage with its ‘Closing the Gap’ reform, investing in programmes to incentivise better identification, increase access to primary healthcare, reduce the cost of medicines and establish a workforce to tackle tobacco use and obesity. Central to the reforms are targets for closing the life-expectancy gap within a generation and halving death rates for children under 5 years of age within a decade.2 ,3 While education, housing and employment are significant contributors to this health disparity, the role of primary healthcare services, whether Aboriginal and Islander Community Controlled Health Services (AICCHSs), community health services or general practices are also important and a significant component of the effort to Close the Gap (CtG).
The Queensland Aboriginal and Islander Health Council (QAIHC) has been leading the development of the first Indigenous community controlled Heath Information System (HIS) designed to build capacity in AICCHSs for the ongoing analysis, monitoring and reporting of clinical health data in Queensland.4 The HIS comprises a set of performance indicators, seamless integration with service Electronic Medical Records (EMR) and a web-based portal, which together forms the measurement platform for the QAIHC quality improvement programme, the CtG Collaborative that drives organisational change.
This work has been progressing in an environment that is moving towards a national key performance indicator (nKPI) reporting process, authorised by the Council of Australian Governments (COAG).3 A subset of AICCHs began reporting nKPI data to the Australian Institute of Health and Welfare in February 2012, with a plan to mandate reporting biannually from June 2013 for all AICCHSs (over 150). The advent of the National Health Performance Authority (NPHA) in the context of the ongoing health-reform agenda and release of the NPHA Performance and Accountability Framework suggests that efforts to capture and measure national health performance data are gathering pace and may soon involve the broader primary healthcare sector in Australia.5
These new reforms need careful evaluation. The change in policy direction has occurred in a historical context in which the collection of data and information at the Aboriginal and Torres Strait Islander primary healthcare service level has been in place for many years and is driven by accountability requirements based primarily on service activity reporting.6 Currently, AICCHSs contend with multiple programme-specific reporting frameworks, each with their attendant indicator sets. As well as being overly burdensome,7 data collection for these reporting processes has not been seamless, and does not support the appropriate aggregation or timeliness of feedback required for quality improvement and planning purposes at the service level. As a consequence, this reporting has not adequately supported individual AICCHSs to assess the clinical care their health teams deliver, engage in useful quality improvement, plan for the future or demonstrate the effectiveness of AICCHSs individually or as a sector.
In this paper, we present data from the first 2 years of the QAIHC CtG collaborative programme (2009–2010) to examine improvements in the delivery of clinical care against key performance indicators. Consideration is given to target setting for clinical care activities for Aboriginal primary healthcare clinics based on the findings.
Methods
Setting
Queensland has a large Indigenous population of 146 000 Aboriginal and Torres Strait Islander persons. This represents 3.6% of the total Queensland population and 28.3% of the national Aboriginal and Torres Strait Islander population.8
QAIHC supports the 27-member AICCHSs across Queensland to deliver comprehensive, primary healthcare to their communities. These organisations receive a mix of funding from the commonwealth and state governments and additionally bill Medicare, Australia's national health insurance scheme, for services delivered by their clinical care teams. The services have community-elected boards leading the delivery of multidisciplinary, comprehensive primary healthcare.
Indicator set development and implementation
QAIHC has a small Data Management Unit, within its Preventative Health Unit, which has led the implementation of the health information strategy, manages the data and leads the attendant quality improvement programme for the 22 services with medical clinics. In 2007–2008, an expert panel, working with the QAIHC Centre of Research Excellence (CRE) in Cardiovascular Disease, developed a set of indicators, the ‘QAIHC Core Indicators’, which provide an overview of the quality of care delivered by the medical clinics, the health status of the service patient populations in our sector, workload, patient access and workforce9 (table 1). The AICCHSs have been integrally involved in the work from the start in the advisory, testing and participatory capacities and provide members to a continuing, advisory lead clinician group (LCG). Data definitions were established in the CRE work. The indicators are reviewed annually by the LCG.
25 Queensland Aboriginal and Islander Health Council Core Indicators developed by expert review and consensus in 2007–2008 for implementation in the Aboriginal and Islander Community Control Health Services in Queensland
Study design, data collection and analysis
Eighteen of 22 AICCHS regularly submit data to the QAIHC repository on the 25 ‘QAIHC Core Indicators’; four services have newly established medical clinics that will begin submitting data in 2013. Participating services send the aggregated whole of the service data on the first Wednesday of every month to the data repository via automated extraction from the service clinical EMRs using the Pen Computer Systems Clinical Audit tool (Pen CAT). No assessment of the individual patient data is undertaken. The data are fed back to the services through the Australian Primary Care Collaborative (APCC) webportal, via the QAIHC ‘pages’, and a copy is left on the services' servers.
This study presents longitudinal and time point data for selected indicators for 18 participating AICCHS. The study data have been collated from data extracted by the QAIHC Core Indicator report in the Pen CAT tool. The data collection thus represents a ‘live’ whole of the service patient snapshot. That is, the data are extracted for all patients on the EMR and the indicators are reported for the three user groups: all patients, recent patients and regular patients stratified by ethnicity. The patient group numbers vary from month to month, as does the number of services submitting data. The data are derived from the daily delivery of clinical care—there are no patient subgroups defined by having a completed health check; for example, inclusion is defined by attendance for care at the clinic. Table 2 presents a snapshot of the denominators (aggregated data) for the various subgroups of a service's users at each time point, so each row or each patient group is a subset of the previous. In the EMR disease register section, the numbers represent a subset of the regular adult Aboriginal and Islander patients. The data in all the figures are for the regular Aboriginal and Torres Strait Islander patients.
Aggregated patient numbers for each time point with recorded visits at participating Queenland Aboriginal and Islander Community Controlled Health Service with medical clinics
Data for this study were collated using simple descriptive statistics—proportions and 95% CIs or medians and IQRs using SPSS V.19.
Definitions
Patients are asked about ethnicity, self-identify and are recorded as Aboriginal, Torres Strait Islander or both in health service EMRs. A recent patient is a patient with one recorded clinical visit in the 6 months prior to the date of data extraction. A regular patient is a patient who has made three visits to the service in the 2 years AND at least one visit in the 6 months prior to the date of data extraction. An adult is a person aged 15 years or older. A current health check or assessment is defined as a billed Medical Benefits Schedule (MBS) Item number 715 in the 24 months prior to the date of the data extraction. A current General Practitioner Management Plan (GPMP) is defined as an eligible patient having a billed MBS Item number 721 in the 12 months prior to the date of the data extraction.
Privacy, confidentiality and community processes
The quality improvement programme and implementation of the health information system has been fully supported by the member elected QAIHC Board and member services. Participation is voluntary. All participating services have Australian General Practice Accreditation and patients are advised of ongoing quality assurance activity in the services. The work has been supported by funding from the Office of Aboriginal and Torres Strait Islander Health, Department of Health and Ageing.
QAIHC has data management agreements in place with all participating member services and their partners. All participating services have standard agreements with the Improvement Foundation. All data are held securely at QAIHC in a password protected data repository. A copy of the data extraction is retained by the AICCHS. The services are coded and deidentified. All presentation of data outside of a service is deidentified.
Results
Characteristics of patients
From October 2009 to February 2012, the number of participating AICCHSs with medical clinics sending monthly data for the QAIHC Core Indicators increased from 6 to 18. The total number of patients seen by these clinics for a documented visit in the 2 years prior to the date of data extraction increased from 38 167 to 75 309 (June 2010 to February 2012; table 2).
By September 2011, a total of 32 942 recent patients, with a median of 1628 (IQR 1106, 2226) per service, had been seen by the 18 clinics for medical care in the previous 6 months—from 1 April to 30 September 2011. Of these patients, 23 980 (72.8%) were identified as Aboriginal or Torres Strait Islanders, and of these, 19 727 (82.3%, median 0.64 IQR 0.49–0.77/clinic) were regular Aboriginal or Torres Strait Islander patients.
Risk factor management
The aggregated performance of participating services was consistent on the recording of a number of key risk factors and healthcare activities (eg,tobacco use, blood pressure (BP)) but poor for others (waist measurement), with some improvement over time (figure 1).

Recording of key risk and clinical care data#—the proportion of regular Aboriginal and Torres Strait Islander adult patients+, with care activity recorded, attending participating health services in Queensland in between February 2010 and February 2012. #Recording for clinical status and activities is ever for tobacco and alcohol use, having been checked within 12 months of the report date for all adult patients for Waist, body mass index, blood pressure, eGFR and within 6 months of the report date for glycated haemoglobin (HbA1c) in patients with type 2 diabetes. +The denominator for each time point corresponds to the total number of regular Aboriginal and Torres Strait Islander adults seen by all the services who submitted data at the time point (table 2). Alcohol data: submission was omitted from one service in June 2011, three services in September 2011 and February 2012.
In October 2011, the recording of key risk factor data in the EMR, as a proportion (95% CIs) of aggregated regular adult patients who had attended the services in the previous 6 months, was as follows: for tobacco use 92.1% (79.5, 95.5), alcohol use 66.2% (55.3, 83.7), body mass index (BMI) 73.9% (60.6, 79.9), HbA1c 73.8% (62.8, 85.8), waist circumference 19.8% (6.8, 30.1), BP 86% (79.8, 88.3), glomerular filtration rate 26.8% (23.3, 40.9), demonstrating consistent performance across the 18 participant services.
Setting a standard of 80% completion as acceptable for recording of key clinical data, for tobacco use, 14/18 services met this target; for BMI recording, only 4/18 services met the target but if the standard was lowered to 70%, 12/18 services would then have met the target. For checking and recording of BP, 14/18 services met the 80% standard with the lowest completion for this care activity being 66%. Other indicators where performance is consistently low include the recording of physical activity levels and waist circumference.
Health assessments
The aggregated performance of participating services for health assessment increased over time (figure 2). In October 2011, 8697 (44.1%—43.4, 44.8) of the regular patients had a current health assessment.
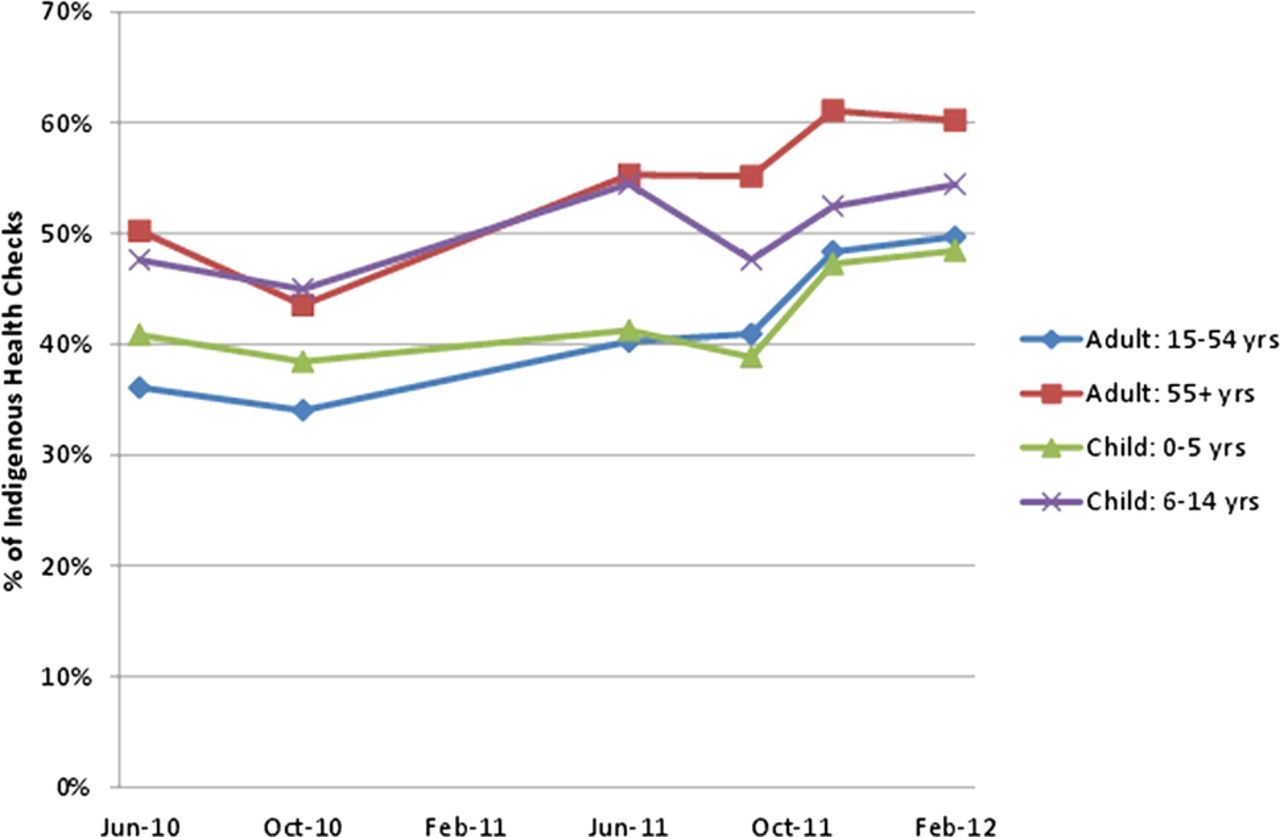
Proportion of regular Aboriginal and Torres Strait Islander adults with current health assessments* by age group attending participating health services in Queensland between February 2010 and February 2012. *Health assessment: comprehensive review of patients health—a billed Medicare Item 715 within the past 2 years (formerly an ‘Aboriginal and Torres Strait Islander health check’). Lipid and renal tests are optional for adults.
Hypertension management
Management of hypertension and performance for coronary heart disease care plans is shown in figure 3 using aggregated data between June 2010 and February 2012. In October 2011, hypertension was identified in a total of 3097 (25.1%) regular Indigenous patients, with a range in prevalence of 16–35% across the 18 services. The care delivered for hypertension was universally good. For patients with diagnosed hypertension, 86% (79.8, 88.3) of these patients had their BP checked within 12 months of the report date and 81.2% (72.4, 85.3) had been prescribed ACE inhibitors or Angiotensin II receptor blockers. Of 1079 patients with Chronic Heart Disease, 24.8% (10.9, 45.1) had a current GPMP(Medicare Item 721) in place.

Management of regular Aboriginal and Torres Strait Islander adults with diagnosed hypertension# attending participating health services in Queensland between February 2010 and February 2012—proportion of patients with recorded care activity. #Hypertension patients: the number of patients with hypertension at each time point is in the disease registers section of table 2. *Hypertension patients prescribed ACE inhibitors or A2s checked within the 12 months prior to the date of data extraction. Denominator at each time point is the number of patients with hypertension. +Patients with coronary heart disease with a current General Practitioner Management Plan performed within 12 months prior to the date of data extraction. Denominator for each time point corresponds to the number for coronary heart disease in the disease registers section of table 2.
Diabetes management
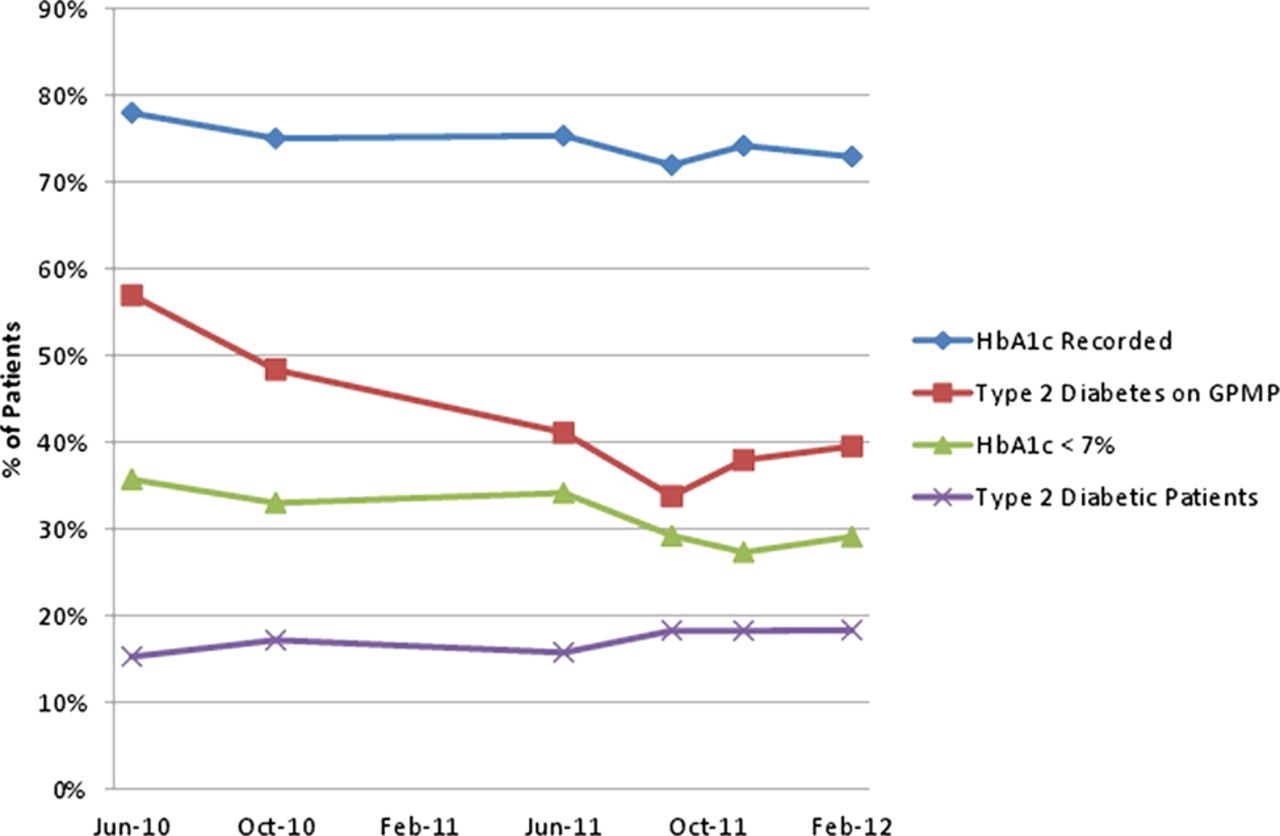
figure 4 shows aggregated data for the care of patients with diabetes mellitus type 2. The completion of HbA1c testing in all diagnosed patients with diabetes across the sites decreased across time, as did care planning and the proportion of well controlled patients—those with an glycated haemoglobin (HbA1c) <7%. The number of regular adult Aboriginal and Torres Strait Islander patients diagnosed with this disease rose across time to 2489/13 630 (18.3%—17.7, 19) in October 2011. For these patients, 1791 (72%—70.2, 73.8) had their HbA1c checked within the past 6 months, 523 (29.2%—27.1, 31.3) had an HbA1c of less than 7% and 808 (32.5%—30.7, 31.3) had a current GP management plan in place.

Management of regular Aboriginal and Torres Strait Islander adults with diagnosed diabetes mellitus type 2* attending participating health services in Queensland between February 2010 and February 2012—proportion of patients with recorded care activity. *Diabetes mellitus type 2 patients: the number of patients with DM Type 2 at each time point is in the disease registers section of table 2. Glycated haemoglobin (HbA1c) recorded: proportion of diabetes mellitus type 2 patients with a HbA1c recorded in past 12 months—data extracted from pathology results. HbA1c <7%: denominator is patients with a recorded HbA1c. GPMP: proportion of diabetes mellitus type 2 patients with a General Practitioner Management Plan (Medicare Item721), performed within 1 year of the date of data extraction).
Variation between services
The prevalence of key risk factors or chronic diseases varies across services, with the variation being greatest for at-risk alcohol use across the 18 participating clinics in October 2011 (figure 5). Variation in the clinical team performance between services was greatest for care planning and health check activity (figure 6).

Prevalence of key health status determinants by recorded diagnosis in 13 630 regular Aboriginal and Torres Strait Islander adults attending 18 participating health services in Queensland, April–September 2011. Note: Tobacco use is self-reported daily smoking; at-risk alcohol use is self-reported ever daily alcohol intake of greater than two drinks; BMI, body mass index; eGFR, glomerular filtration rate is extracted from pathology results. Alcohol data: submission from 15 services in September 2011.

Performance of health assessments and care planning for regular Aboriginal and Torres Strait Islander patients, across 17 participating health services in Queensland, April–September 2011. Note: GPMP, General Practitioner Management Plan (Medicare Item721, performed within 1 year of the date of data extraction); CHD, chronic heart disease; CHC, child health check; AHC, adult health check (Medicare Item 715 performed within 2 years of the date of data extraction).
Discussion
Participating health services in Queensland are now able to systematically collect data which enable them to monitor performance, access and workloads. This is a significant advance. These AICCHSs are completing a number of key clinical care activities in more than 80% of their regular patients. Completion of comprehensive health checks or assessments has increased over the past 2 years, in part driving the increased identification of patients with diabetes and hypertension. This suggests that health system performance in these services has improved, which should translate to improved health outcome.
The data indicate that performance on the clinical best practice aspects of care is remarkably consistent across the services despite their differing characteristics, with screening gaps of 15–30%. BP was recorded for over 85% of all adult patients seen, similarly recording of tobacco use, with alcohol use recorded in at least 70% of patients over the 2-year period. Conversely, waist circumference is recorded in one in six women only, despite the data showing one in two women having a BMI of over 30 and recording of renal function was low. These differences in performance are not likely to reflect improvements in data entry alone and may reflect the nature of the clinical activities themselves. Although each clinical activity can be conducted by individual clinicians, which might be expected to increase the likelihood of change, the impacting factors vary, reflecting confronting clinical tasks, knowledge of best practice guidelines and limitations of EMRs. Consequently, interventions to improve performance will vary for each indicator and may include the need to educate patients about the value of such interventions, to increase demand and clinician confidence in delivery. These data may be useful in setting targets in future; however, it could be argued that mandated monitoring of performance should not be introduced until all levers in care delivery systems are harnessed.
In contrast, the performance on the care planning and biannual health assessment activity, the capture of which is dependent on billing, and the delivery on well-coordinated teamwork shows more variation. While the completion of comprehensive health assessments rose over the 2 years to 50% better in all age groups, care planning may not have kept pace with the increased identification of people with hypertension and diabetes. Many factors are known to influence the provision of preventative care in primary healthcare settings including practice size, available workforce, competing time pressures for both staff and patients, limited referral options, lack of supportive organisational infrastructure, lack of incentives and training.10–12 Many of these factors are relevant to AICCHSs, difficult to quantify and are likely to partly explain the variation between practices in performance data. Thus, interventions to improve performance here may require service level strategies for strengthening administration and reviewing workflows together with policy changes to support teamwork through articulation of roles and changed scope of practice to facilitate the delivery of collaborative team care.
Since the initial work in 2007,13 these data suggest some improvement over the past 4 years. The screening and prescribing gaps for risk factors and hypertension are also consistent with the published data from research projects in both the Aboriginal setting and mainstream general practice.14 ,15 It is difficult to compare across sectors, states and with recent data—however, the delivery of health checks by these AICCHS compares favourably with that of services participating in the Healthy for Life (HFL) programme16 as well as with those in mainstream general practice.17 In 2007, 19 services participating in the HFL programme reported on care planning—419 of 3415 (12%) regular Indigenous adult clients with Type II diabetes had a current GPMP, compared with 34% for these QAIHC services; similarly, 165 of 1546 (10.7%) Indigenous adults with coronary heart disease had a current GPMP compared with 24.8% in this study. Work in the Australian Capital Territory found that 156 adult Health Assessments were conducted between 2004 and 2008 by all primary healthcare services, a coverage of 7% of the eligible population17 compared with 42% in this study, suggesting that the AICCHs sector may be outperforming the mainstream general practice in the care of the Aboriginal and Torres Strait Islander patients. The challenge now is to sustain this system and to continue to act on such data, which is predicated on having the appropriate time and resources in our peak bodies to support the Aboriginal and Islander health services.
Currently, there are no well-considered standards for performance or weighting models to enable comparison between services and sectors in Australian primary healthcare. Measurement and data collection inevitably lead to comparison and interpretation despite the impact of a multitude of factors in the service environment that may influence change, the ever changing data denominators and lack of controlled rigour in data collection. Unlike pay for performance systems in which participation is mandated and gaming of results is not uncommon,18 this system has evolved in a safe environment where questions about what the data mean and comparison of organisations can be given due consideration in a complex context both at the service and state levels. However, supporting a robust comparison of services cannot be done without a consideration of the variety of factors that impact on performance data at the service level. Any efforts to publish or reward performance must be accompanied by the development of appropriate measures that prevent unfair comparisons between services that operate in very different contexts. Models need to encompass factors that could be expected to drive significant variation between these primary healthcare services—size, location, staffing composition, and funding, demographic and socioeconomic bases. There are a number of additional factors that might also be considered particularly in interpreting performance for care planning and health checks (box 1). Given this context, a pay for performance system may be a blunt, inequitable instrument for driving improvement in Aboriginal primary healthcare, where state affiliates such as QAIHC are better placed to support services in their efforts to improve the planning and quality of the healthcare they deliver.
Possible explanatory factors for interservice variation
-
Clinical activities versus EPC items:
-
One person activity versus team activity
-
-
Interservice variation
-
SEIFA, community size and percentage of indigenous people in catchment
-
ICAC or SAT scores? available
-
Staffing/workforce
-
– Senior medical officer
-
– turnover
-
– Ratio of doctors to patients—workload per clinician
-
-
Use data platforms
-
– Pen CAT usage or similar
-
– APCC portal usage
-
– Use of Plan Do Study Act cycles
-
-
CQI programme/collaborative
-
Incentives
-
– Staff—flat salaries or incentives
-
– Patients
-
– Staff and patients
-
-
These observations are important in the context of the evolving NHPA which has recently released some potential indicators for the primary healthcare sector. A number of them are similar to those presented here—for example, those related to care planning.19 Experience from the UK suggests the need for caution to avoid a number of adverse consequences when payment is linked to performance. Particularly relevant to a scaled-up national system, and similar to the system QAIHC has implemented, are concerns that were clearly outlined in a recent paper. These included measurement fixation, tunnel vision, quantification privileging, increasing inequity and politicisation of performance.18 Sensitive, careful interpretation of the variation in performance at the individual service level and comparison of performance between services over time are essential for both planning health service delivery and action to support improvement at the local, regional and state levels.
Finally, the data also demonstrate the depth of workforce needed by all services to assist in major lifestyle change. The high prevalence of smoking, obesity diabetes and hypertension are consistent across all services; the prevalence for tobacco and at-risk alcohol use, resulting in much higher than the workloads faced by mainstream general practice in Australia.20 This is vital information for the prevention and planning of future service delivery by the sector.
An additional strength of the data is its immediacy and robustness—it is ‘live’, ‘real world’ data for nearly one in six Aboriginal and Torres Strait Islanders in Queensland. There will be some patients using more than one service; however, this duplication is quite likely to have had a small impact, given that the data collected are for whole service populations, not smaller, manually audited samples. For QAIHC monitoring, these real-time data can alert one to emerging or early trends in risk factors and chronic diseases. This is important in the context of the recent CtG investments and should, in time, enable QAIHC to better support its workforce, including the new Indigenous tobacco workforce.21
Conclusion
Participating Aboriginal Medical Services in Queensland are now able to systematically collect performance data, which demonstrate what they do in terms of patient access and delivery on key care activity. The performance on some of the clinical best practice aspects of care is remarkably consistent across the services despite their differing characteristics, and appears to have improved in recent years. The limited information available suggests that performance in the AICCHS sector on some key care activities is at a higher level than for mainstream general practice providers. It is consistently higher for single clinician care activities such as BP measurement across all services than for team-based activities, where there is much greater variation in the completion of health checks and care plans.
Setting targets to support improvement needs a careful consideration of the factors underlying different clinical activities and it is conceivable that many of these will be related to circumstances beyond the immediate control of the health service such as remoteness and disadvantage. The work demonstrates the role the Community Control sector can play in using data to close the gap in Aboriginal and Torres Strait Islander health—there is real value in further investing in CQI programmes with these services.
Supplementary materials
Supplementary Data
This web only file has been produced by the BMJ Publishing Group from an electronic file supplied by the author(s) and has not been edited for content.
Files in this Data Supplement:
- Data supplement 1 - Online appendix
Footnotes
-
Contributors KSP, SB and AC conceived the idea for the study and were responsible for the study design. The initial draft of the manuscript was prepared by KSP and then circulated repeatedly among all authors for critical revision. KSP, DL and AD were responsible for undertaking the data analysis and produced the tables and graphs. KLG contributed to the interpretation of the results and drafted sections of the manuscript. IR and MW contributed to the interpretation of the results and provided comments on the manuscript. SB, AC, RS, GW, DB, JM and MW were responsible for implementing and maintaining the project and leading the acquisition of the data. All authors read and approved the final manuscript.
-
Funding Office of Aboriginal and Torres Strait Islander Health, Department of Health and Ageing, Canberra, ACT, Australia.
-
Competing interests None.
-
Ethics approval This study was conducted as part of a Quality improvement programme. The quality improvement programme and implementation of the health information system has been fully supported by the member-elected QAIHC Board and member services. Participation is voluntary. All participating services have Australian General Practice Accreditation and patients are advised of ongoing quality assurance activity in the services. QAIHC has data management agreements in place with all participating member services and its partners. All participating services have standard agreements with the Improvement Foundation. All data are held securely at QAIHC in a password protected data repository. A copy of the data extraction is retained by the AICCHS. The services are coded and de-identified. All presentation of data outside of a service is de-identified .
-
Provenance and peer review Not commissioned; externally peer reviewed.
-
Data sharing statement This article publishes a small subset of data collected by the QAIHC Close the Gap Quality Improvement Collaborative as part of its ongoing work with member services. The complete dataset is held by QAIHC which has data management agreements in place with all participating member services and their partners. All participating services have standard agreements with the Improvement Foundation. These agreements restrict data use.
Linked Articles
- Correction