Article Text

Abstract
Background Nut consumption has increased in the US but little evidence exists on the association between changes in nut consumption and weight change. We aimed to evaluate the association between changes in total consumption of nuts and intakes of different nuts (including peanuts) and long-term weight change, in three independent cohort studies.
Methods and findings Data collected in three prospective, longitudinal cohorts among health professionals in the US were analysed. We included 27 521 men (Health Professionals Follow-up Study, 1986 to 2010), 61 680 women (Nurses’ Health Study, 1986 to 2010), and 55 684 younger women (Nurses’ Health Study II, 1991 to 2011) who were free of chronic disease at baseline in the analyses. We investigated the association between changes in nut consumption over 4-year intervals and concurrent weight change over 20–24 years of follow-up using multivariate linear models with an unstructured correlation matrix to account for within-individual repeated measures. 21 322 individuals attained a body mass index classification of obesity (BMI ≥30 kg/m2) at the end of follow-up.
Average weight gain across the three cohorts was 0.32 kg each year. Increases in nut consumption, per 0.5 servings/day (14 g), was significantly associated with less weight gain per 4-year interval (p<0.01 for all): −0.19 kg (95% CI -0.21 to -0.17) for total consumption of nuts, -0.37 kg (95% CI -0.45 to -0.30) for walnuts, -0.36 kg (95% CI -0.40 to -0.31) for other tree nuts, and -0.15 kg (95% CI -0.19 to -0.11) for peanuts.
Increasing intakes of nuts, walnuts, and other tree nuts by 0.5 servings/day was associated with a lower risk of obesity. The multivariable adjusted RR for total nuts, walnuts, and other tree nuts was 0.97 (95% CI 0.96 to 0.99, p=0.0036), 0.85 (95% CI 0.81 to 0.89, p=0.0002), and 0.89 (95% CI 0.87 to 0.91, p<0.0001), respectively. Increasing nut consumption was also associated with a lower risk of gaining ≥2 kg or ≥5 kg (RR 0.89–0.98, p<0.01 for all).
In substitution analyses, substituting 0.5 servings/day of nuts for red meat, processed meat, French fries, desserts, or potato, chips (crisps) was associated with less weight gain (p<0.05 for all).
Our cohorts were largely composed of Caucasian health professionals with relatively higher socioeconomic status; thus the results may not be generalisable to other populations.
Conclusion Increasing daily consumption of nuts is associated with less long-term weight gain and a lower risk of obesity in adults. Replacing 0.5 servings/day of less healthful foods with nuts may be a simple strategy to help prevent gradual long-term weight gain and obesity.
- weight management
- nutrition assessment
- dietary patterns
This is an open access article distributed in accordance with the Creative Commons Attribution Non Commercial (CC BY-NC 4.0) license, which permits others to distribute, remix, adapt, build upon this work non-commercially, and license their derivative works on different terms, provided the original work is properly cited, appropriate credit is given, any changes made indicated, and the use is non-commercial. See: http://creativecommons.org/licenses/by-nc/4.0/.
Statistics from Altmetric.com
What this study adds
Increased total consumption of nuts and intakes of individual types of nuts were associated with less weight gain despite being calorically dense.
Increased daily consumption of nuts was associated with lower risk of moderate weight gain and lower risk of developing obesity.
Incorporating nuts as part of healthy dietary pattern can be an effective strategy on making attainable dietary modifications for the primary prevention of obesity.
Introduction
Obesity is a significant contributor to increased morbidity and mortality.1 Nearly 40% of US adults (20–59 years of age) meet the threshold for obesity, a body mass index (BMI) ≥30 kg/m2, with a slightly higher prevalence (42.8%) among adults ages 40–59 years.2 On average, US adults accumulate ~1 lb (or 0.45 kg) per year throughout adulthood. Even modest weight gain (2.5–10 kg) in adulthood increases mortality and the risk of subsequent cardiovascular disease, type 2 diabetes, obesity, and obesity-related cancers over time.3 Primary prevention of gradual weight gain may be an effective strategy to reduce the prevalence of obesity at the population level; however, identifying the underlying causes of the subtle increases in body weight has been challenging.
The cause of weight gain is often oversimplified as a consequence of a surplus in energy intake that can be averted by reducing total calorie intake and/or avoiding energy dense foods. However, evidence increasingly supports a significant role of diet quality in weight management. For example, recent studies suggest that different foods and dietary patterns contribute to long-term weight maintenance through different pathways of weight homeostasis.4 Thus, strategies promoting overall healthy dietary patterns, rather than those solely focusing on total calories, may be more effective for long-term weight control and the prevention of obesity.
Among US adults, diet quality has modestly improved over the last two decades, attributable to increased intakes of whole grains, nuts and seeds, and decreases in sugar-sweetened beverage consumption.4 Nuts are nutrient-dense foods rich in unsaturated fatty acids, vitamins, minerals and fibre. Their high fat content leads some to perceive nuts as unhealthful and to be avoided by those attempting to manage or lose their body weight. Nonetheless, consumption of nuts and seeds increased from 0.5 servings/day in 1999 to 0.75 servings/day in 2012.4
Previous epidemiologic research has evaluated the relationship between nut consumption and body weight and weight change.5–8 Most of this research evaluated either baseline or updated nut consumption with weight change during a subsequent follow-up period. However, this approach has some limitations. First, past diet is not as relevant to recent body weight change as concurrent dietary changes are. Second, based on modelling/biology of weight change, most of the effects of change in a diet or lifestyle factor on body weight will occur within 2 to 4 years.9 Therefore, in the present study we aimed to evaluate the association between changes in nut consumption with concurrent weight change across repeated 4-year intervals in three independent cohorts of US men and women.
Methods
Population characteristics
We analysed data from three prospective cohorts: the Health Professionals Follow-Up Study (HPFS), the Nurses’ Health Study (NHS), and the NHS II. In the HPFS, 51 529 male health professionals between 40–75 years of age were enrolled at study inception in 1986. The NHS includes 121 700 nurses aged 35–55 years when first enrolled in 1976 and the NHS II enrolled 116 686 younger nurses ages 24–44 in 1989.10 Participants were recruited across the US; approximately 97% of participants included in the cohorts were Caucasian.11 Participants were followed up through mailed biennial validated questionnaires that ascertained medical history, lifestyle factors and other health-related behaviours as previously described, with a response rate of ~90% per cycle.10
The study protocol was approved by the institutional review boards of Brigham and Women’s Hospital and Harvard T.H. Chan School of Public Health.
Dietary assessment
A semi-quantitative validated food frequency questionnaire (FFQ) containing 130 foods was administered to participants in the NHS and HPFS every 4 years since 1986 and to participants in the NHS II since 1991. Participants were asked to report the frequency of consumption of a standard portion size of each food or beverage within nine possible frequency categories ranging from “never or less than once per month” to “≥6 times per day”. Validation of the questionnaire against 7-day diet records has been described previously.12–15
For nut consumption, participants were asked how often they consumed a serving (28 g or 1 ounce) of nuts and peanuts from the preceding year. We converted the frequency categories (never or less than once per month, 1–3 per month, 1 per week, 2–4 per week, 5–6 per week, 1 per day, 2–3 per day, 4–6 per day, or ≥6 times per day) to serving per day. Peanuts share a similar nutrient profile with nuts. Although botanically peanuts are legumes, by consumer definition, we included peanuts as part of the nut food group. Data on specific consumption of walnuts and other tree nuts were first available in 1998 in the HPFS and NHS and in 1999 in the NHS II. Before this, consumption of walnuts, if there was any, was counted as a part of tree nuts consumption. After 1998 and 1999, consumption of tree nuts is the sum of other tree nuts and walnuts. Consumption of peanut butter was also assessed with the same nine frequency categories by considering one serving size as 15 g (one tablespoon).
Nut consumption assessed by the FFQ questionnaire provided reasonable accuracy in reflecting the daily nut consumption when compared with a 7-day diet record, as evidenced by a correlation coefficient of 0.75 for both consumption of total nuts and peanut butter.15 In the present study, we analysed the following categories of nuts: total consumption of nuts (walnut, other tree nuts and peanuts), tree nuts (walnuts and other tree nuts), walnuts, other tree nuts, peanuts and peanut butter.
Assessment of weight change
Weight and height were assessed by questionnaire at enrollment. We obtained updated self-reported weight on each biennial follow-up questionnaire. We calculated weight change as the difference in weight over each repeated 4-year interval in which the FFQ was also administered. In a validation study, weight reported by a subsample of 184 women who were weighed 6–12 months after completing the mailed questionnaire showed that self-reported body weight was highly correlated with staff-measured body weight (r=0.97).16
Assessment of physical activity
Physical activity was assessed using a validated questionnaire that was updated every 2 years with average energy expenditure (metabolic equivalents (MET) hours/week) for specific activities (eg, walking, jogging, bicycling, swimming, racquet sports and gardening).17 We multiplied the intensity of each activity (defined in MET) by duration and summed across activities for total physical activity in MET hours/week.
Statistical analysis
We assessed the association between changes in nut consumption and weight change per each 4-year interval using multivariable linear models with an unstructured correlation matrix to account for within-individual repeated measures (HPFS 1986–2010, NHS 1986–2010, NHS II 1991–2011). We used an increase of 0.5 servings/day as the unit of exposure which is equivalent to 3.5 servings/week. The β coefficient represents the absolute weight change associated with a 0.5 servings/day increase in nut consumption during the 4-year period irrespective of other confounders. Participants who reported a diagnosis of cancer, diabetes, myocardial infarction or stroke, and those with missing BMI at baseline, were excluded from the analyses. Individuals who did not complete the FFQs, who reported an implausible total energy intake (<600 or >3500 kcal/day for women, <800 or >4200 kcal/day for men), or were missing body weight data were excluded from the interval with the missing data but re-entered the analysis in subsequent questionnaire years with eligible data. We censored participants on reaching age 65 years during the follow-up period to minimise measurement error from aging-related weight loss and loss of lean body mass. Individuals who were or became pregnant were excluded for the intervals when pregnancy was reported and re-entered the analysis during non-pregnancy periods. Baseline was the first year for which detailed information on diet, physical activity and lifestyle were comprehensively measured. For this analysis, the baseline was set at 1986 for HPFS and NHS and at 1991 for NHS II. The final analytical study population included 27 521 men in the HPFS, 61 680 women in the NHS and 55 684 women in the NHS II.
We adjusted the multivariable models for age, menopausal status (pre- or postmenopausal), hormone therapy use (never, past, or current) in women, hours of sleep, BMI at the start of each 4-year interval, and concurrent 4-year changes in lifestyle factors: smoking status (never, former, current: 1 to 14, 15 to 24, or ≥25 cigarettes/day), physical activity (MET hours/week), hours of sitting/week; and dietary factors (serving/day): fruits, vegetables, alcohol, snacks, dessert, French fries, potato, red meat, processed meat, whole grain, refined grain, and sugar-sweetened beverages. Lifestyle changes were modelled as continuous variables (eg, hours of physical activity) or as indicator variables for categorical behaviours (eg, smoking status). Continuous variables were censored at the 0.5th and 99.5th centiles to minimise the influence of outliers.18 Categorical variables with missing data were assigned a missing indicator. We also calculated the differences in β coefficients and 95% CIs among nuts and other food items, and interpreted these differences as the estimated associations of substituting 0.5 servings of nuts for 0.5 servings of other foods on weight change.
We further used the multivariable model with Poisson distribution to assess relative risk (RRs) and 95% CIs for weight gain (≥2 kg or ≥5 kg over 4 years), and RRs for becoming obese (BMI ≥30 kg/m2 over 4 years) per 0.5 servings/day increase in nut consumption. In analyses assessing RRs of incident obesity, we excluded participants who were obese at baseline of every 4 years.
The joint association of nuts intake (none, 0–0.5, >0.5 servings/day) at the beginning and end of each 4-year interval in relation to weight change, risk of weight gain (at least 2 kg or 5 kg) and risk of becoming obese was also examined. Participants were categorised into nine groups; those with the lowest nut consumption (0 servings/day of nut at first year and last year of the 4-year interval) were used as the reference group.
Three sensitivity analyses were conducted to test the robustness of our results. First, we conducted pre-specified subgroup analyses by potential effect modifiers of the association between changes in nut intake and weight change. At the start of each 4-year interval, we conducted stratified analyses by participants’ BMI (≤25 kg/m2, >25 kg/m2), age (≤55 years, >55 years), levels of physical activity (≤18 MET hours/week, >18 MET hours/week). Second, we further adjusted the models for Alternate Health Eating Index (AHEI),19 excluding the nut and alcohol components to account for the overall dietary quality. To examine the independent contributions of types of nuts to weight change, we mutually adjusted peanuts, walnuts, and other tree nuts for each other in the final multivariable model. Finally, to examine whether dietary composition may have an effect independent of energy intake, we adjusted baseline calorie intake and changes of calorie intake of each 4-year period. We conducted the analyses in three cohorts separately, and results were pooled with a fixed effect meta-analysis. We used SAS version 9.4 (SAS Institute) to analyse the data. Statistical significance was set at a two-tailed p<0.05.
Results
Baseline characteristics and weight change during follow-up
Body weight, lifestyle and dietary characteristics at baseline and average 4-year changes among the 144 885 participants of the study are presented in table 1. The average weight gain across all 4-year periods was 0.77 kg for men in the HSPH, 1.14 kg for women in the NHS and 1.81 kg for women in the NHS II. Across three cohorts, participants had an average weight gain of 0.32 kg (0.71 lb) each year. From 1986 to 2010, consumption of total nuts increased from 0.25 to 0.47 servings/day in men from HPFS, from 0.15 to 0.31 servings/day in women in NHS, and from 0.07 to 0.31 servings/day in NHS II from 1991 to 2011 (online supplementary figure S1). More than 60% of participants had an increase in daily total consumption of nuts during the most recent cycle (online supplementary figure S2).
Supplemental material
Supplemental material
Baseline characteristics and average 4-year lifestyle changes and changes in nut consumption among 126 190 US women and men in three prospective cohorts
Nuts and weight change
Increased total consumption of nuts and intakes of individual types of nuts were associated with less weight gain (figure 1). Increasing total consumption of nuts per 0.5 servings/day was associated with 0.19 kg less weight gain over 4 years (95% CI −0.21 to −0.17). Similarly, per 0.5 servings/day increase in consumption of walnuts or other tree nuts was associated with lesser weight gain of −0.37 kg (95% CI −0.45 to −0.29) and −0.36 kg (95% CI −0.41 to −0.31), respectively.

Association of weight change (kg) every 4 years and per 0.5 servings/day increase in consumption of nuts, individual types of nuts among NHS, NHS II and HPFS. Weight changes are solid bars; T bars represent 95% CI. Multivariate model was adjusted for age, menopausal status (pre- or postmenopausal) and hormone therapy use (never, past, or current) in women; baseline BMI of every 4 years; hours of sleeping at baseline; changes in lifestyle factors: smoking status (never, former, current: 1 to 14, 15 to 24, or ≥25 cigarettes/day), physical activity (MET hours/week), hours of sitting (hours/week); changes in dietary factors: fruits, vegetables, alcohol, snacks, dessert, French fries, red and processed meat, whole grain, refined grain products, and sweet sugar beverages. The p values are <0.001 for all nuts with the exception of changes in peanut consumption in NHS and peanut butter in HPFS. Data on walnuts and other tree nuts were first available in 1998 for NHS, 1998 for HPFS and 1999 for NHS II. BMI, body mass index; HPFS, Health Professionals Follow-up Study; MET, metabolic equivalent; NHS, Nurses' Health Study.
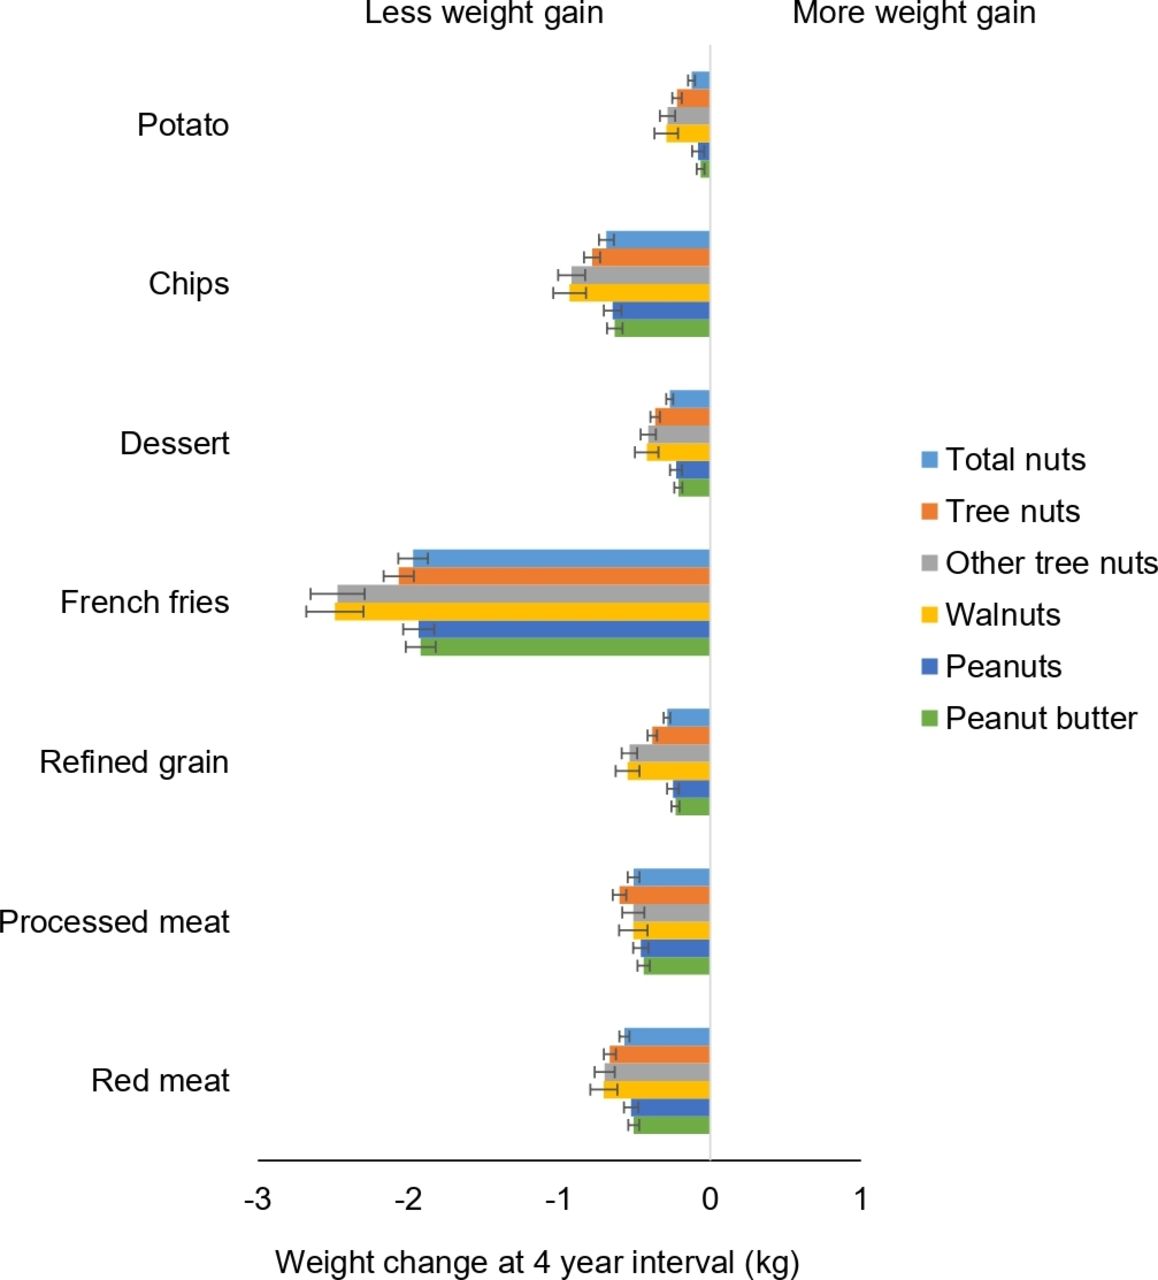
Substituting nuts for snacks, red meat, processed meat, refined grains or desserts (including chocolates, candy bars, cookies, cakes, sweet roll, pies and donuts) was associated with less weight gain (figure 2). For example, substituting 0.5 servings/day of dessert with walnuts or other tree nuts was associated with −0.42 kg (95% CI −0.49 to −0.34 kg) and −0.41 kg (95% CI −0.46 to −0.36 kg) less weight gain, respectively. Replacing red meat and processed meat with nuts or individual types of nuts was also associated with less weight gain (ranging from −0.50 to −0.70 kg per 0.5 servings/day substituted).

Association of weight change (kg) every 4 years and substitution of nuts, individual types of nuts, per 0.5 servings/day with equal serving of other food items among NHS, NHS II and HPFS. Weight changes are presented as solid bars; T bars represent 95% CI. Multivariate model was adjusted for age, menopausal status (pre- or postmenopausal) and hormone therapy use (never, past, or current) in women; baseline BMI of every 4 years; hours of sleeping at baseline; changes in lifestyle factors: smoking status (never, former, current: 1 to 14, 15 to 24, or ≥25 cigarettes/day), physical activity (MET hours/week), hours of sitting (hours/week); changes in dietary factors: fruits, vegetables, alcohol, snacks, dessert, French fries, red or processed meat, whole grain, refined grain products, and sugar sweetened beverages. The p values are <0.001 for all nuts with the exception of when substituting whole grain with peanut butter in HPFS, whole grain, potato with peanuts, and potato with total nuts in NHS. Data on walnuts and other tree nuts were first available in 1998 for NHS, 1998 for HPFS and 1999 for NHS II. Tree nut consumption was the sum of other tree nuts and walnut (if available). Total nut consumption was the sum of peanut, tree nut and walnut (if available). BMI, body mass index; HPFS, Health Professionals Follow-up Study; MET, metabolic equivalent; NHS, Nurses' Health Study.
Nuts and risk of weight gain and obesity
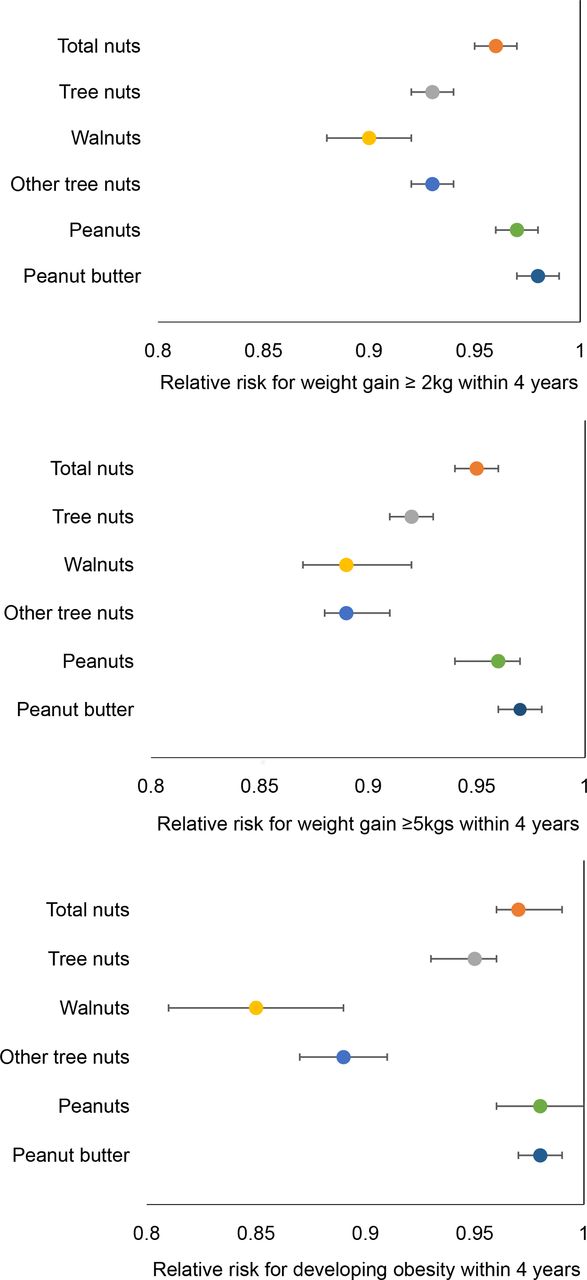
In addition to absolute body weight change, we observed that increasing nut consumption was associated with a lower risk of moderate weight gain (≥2 kg or ≥5 kg) and becoming obese (BMI ≥30 kg/m2) (figure 3). An increase in the daily consumption of nuts by 0.5 servings/day was associated with a lower risk of weight gain ≥2 kg over a 4-year period. The corresponding risk estimates for total nuts, tree nuts, walnuts, other tree nuts, peanuts, and peanut butter are 4% (95% CI 0.95 to 0.96), 6% (95% CI 0.93 to 0.95), 10% (95% CI 0.88 to 0.92), 7% (95% CI 0.92 to 0.94), 3% (95% CI 0.96 to 0.97), and 2% (95% CI 0.97 to 0.99), respectively (figure 3A). Similar inverse associations were observed for risk of weight gain ≥5 kg (figure 3B).

Multivariable adjusted relative risk (95% CI) for moderate weight gain (≥2 kg or ≥5 kg) and incident obesity with 0.5 servings per day increase in consumption of nuts among NHS, NHS II and HPFS. (A) Weight gain ≥2 kg. (B) Weight gain ≥5 kg. (C) Incident obesity. Multivariate model was adjusted for age, menopausal status (pre- or postmenopausal) and hormone therapy use (never, past, or current) in women; baseline BMI of every 4 years; hours of sleeping at baseline; changes in lifestyle factors: smoking status (never, former, current: 1 to 14, 15 to 24, or ≥25 cigarettes/day), physical activity (MET hours/week), hours of sitting (hours/week); changes in dietary factors: fruits, vegetables, alcohol, snacks, dessert, French fries, potato, red or processed meat, whole grain, refined grain and sweet sugar beverages. Relative risk of incident obesity was calculated by multivariable model excluding the adjustment of baseline BMI of every 4 years. Data on walnuts and other tree nuts were first available in 1998 for NHS, 1998 for HPFS and 1999 for NHS II. BMI, body mass index; HPFS, Health Professionals Follow-up Study; MET, metabolic equivalent; NHS, Nurses' Health Study.
During 24 years of follow-up, we documented 21 322 men and women attaining a BMI classification of obesity (BMI ≥30 kg/m2) including 2465 cases from HPFS, 8019 cases from NHS, and 10 838 cases from NHS II. An increase in total consumption of nuts, per 0.5 servings/day, was associated with a modest but significant 3% lower risk of becoming obese (95% CI 0.96 to 0.99, p=0.004). An increase in consumption of walnuts and other tree nuts, per 0.5 servings/day, was associated with a 15% (95% CI 0.80 to 0.89) and 11% (95% CI 0.87 to 0.91) lower risk of developing obesity (figure 3C). Increasing peanut consumption was not associated with risk of obesity (RR 0.98, 95% CI 0.96 to 1.00, p=0.65).
We evaluated the joint association of baseline and final nut consumption over every 4-year period. Compared with participants who remained non-consumers, those who increased consumption of nuts from none-consuming (0 servings/day) to ≥0.5 servings/day had a lesser weight gain of 0.74 kg, a lower risk of moderate weight gain (RR for weight gain ≥2 kg: 0.87, 95% CI 0.84 to 0.89, p<0.0001; RR for weight gain ≥5 kg: 0.87, 95% CI 0.81 to 0.92, p<0.0001), and a 16% lower risk of becoming obese (95% CI 0.80 to 0.89) (table 2). Compared with non-consumers, a consistent higher nut consumption (≥0.5 servings/day) over every 4-year period was associated with even lower risks of moderate weight gain (RR for weight gain ≥5 kgs: 0.77, 95% CI 0.73 to 0.80) and a lower risk of becoming obese (RR 0.77, 95% CI 0.74 to 0.80).
Multivariable adjusted weight change and relative risk (95% CI) for weight gain and incident obesity according to the joint categories of total nuts intake at the first and fourth years of each period based on pooled data of Nurses' Health study (NHS), NHS II, and the Health Professionals Follow-Up Study (HPFS)
Results were persistent between specific types of nuts and weight change, risk of weight gain, and risk of developing obesity (online supplementary table S1). In contrast, non-consumers who increased peanut butter consumption were not significantly associated with weight gain or the risk of incident obesity.
Supplemental material
The inverse associations of changes in nut consumption and weight gain remained robust after additional adjustment for AHEI score (excluding the nut and alcohol component) (online supplementary table S2). Stratified analyses by age, BMI, physical activity and AHEI score did not alter the results (online supplementary table S3). Results remained consistent with primary analysis after specific types of nuts were mutually adjusted for each other in pooled analysis (online supplementary table S4). Further adjustment for calorie intake did not change these results (online supplementary table S5).
Supplemental material
Supplemental material
Supplemental material
Supplemental material
Discussion
In the present study, we assessed the associations between changes in total consumption of nuts, intakes of specific types of nuts and weight change during more than 20 years of follow-up in US men and women from three prospective cohort studies. Increased total consumption of nuts and any type of nuts (including peanuts) was associated with less long-term weight gain and lower risk of developing obesity. The present study provides evidence to support current dietary guidelines that emphasise the importance of incorporating nuts as part of a healthy dietary pattern in the primary prevention of gradual long-term weight gain and obesity.
A number of cross-sectional studies and prospective cohort studies20–22 have demonstrated consistent inverse associations between higher nut consumption and BMI, and body weight.8 23 Our long-term follow-up data with repeated measures from three cohorts are in line with prior observations, including a prior analysis of NHS II data which showed individuals who consumed nuts ≥2 times/week had slightly less weight gain than those who rarely ate nuts during 8 years of follow-up.23 Another study reported that each serving/day of nut intake was associated with 0.26 kg (0.57 lb) less weight gain over 4 years in non-obese individuals from the HPFS, NHS and NHS II.18 In a European cohort, individuals in the highest quartile of nut intake had less weight gain (−0.07 kg, 95% CI −0.12 to −0.02) and had a lower risk of becoming overweight or obese over 5 years when compared with non-consumers.24 Our findings provide further support to existing evidence by demonstrating that increasing the total consumption of nuts, by 0.5 servings/day, was associated with a lower risk of moderate weight gain and a lower risk of developing obesity. The magnitude of inverse associations with obesity risk was similar between specific types of nuts.
In the present analysis, we did not exclude participants with obesity from the analysis of weight change, as was done in the previous study. Elimination of obese participants may lead to underestimating the effect of diet on weight change, as people with obesity are more susceptible to changes in dietary quality and the obesogenic environment. In addition, ~40% of the US population is obese, warranting research in this high risk group that stands to benefit from adopting a healthy dietary pattern. Because weight change occurs gradually at the population level, our 4-year assessment period is aligned with the long-term time course of weight change in response to a change in diet. We modelled the concurrent changes in the intakes of nuts and weight change over a 4-year period, which approximates to an intervention study when changes in other lifestyle factors are also taken into account.
The mechanisms underlying our observed associations between increasing nut intake and lower risks of weight gain are multipronged. Nuts require considerable oral processing effort. The mastication of chewing may elicit dietary compensation through a reduced rate of ingestion.25 The high fibre content of nuts can delay gastric emptying,25 increase satiety,26 27 suppress hunger and the desire to eat, and promote fullness.28 The fibre in nuts also provides a greater binding of fatty acids in the gut, leading to greater calorie fecal excretion.29 A number of studies have examined the efficiency of energy absorption from nuts and have shown that consumption of varying types of nuts resulted in substantive increases in fecal energy loss ranging from 5% to >20%.30–32 There is evidence that the high unsaturated fat composition of nuts elevates fatty acid oxidation and increases thermogenesis33 and resting energy expenditure,34 which may also contribute to the mitigation of weight gain.
Even modest weight gain of ≥2.5 kg from early to middle adulthood (18–55 years) is significantly associated with increased risk of obesity-related cardiovascular disease and type 2 diabetes, compared with those who maintain a stable body weight.3 35 In our study, on average, participants gained 0.32 kg per year. Increasing total nut intake by 0.5 servings/day was associated with less weight gain of 0.19 kg, suggesting that incorporating nuts into the diet, even given their calorie content, is helpful in mitigating a portion of long-term gradual weight gain. In addition, our findings suggest that replacing snacks with nuts could potentially provide long-term beneficial effects in weight management and associated cardiometabolic benefits at the population level. These findings also underscore the importance of diet quality for weight gain prevention.18 While the average diet quality of the US population has improved in recent decades, it remains suboptimal.36 Part of the improvement of the diet quality can be attributed to the increased intake of nuts.4 The average consumption of nuts was 0.47 servings/day for men from HPFS in 2010, and 0.31 servings/day for women from NHS in 2010 and NHS II in 2011 (figure S1), which is half the amount recommended by the American Heart Association for the improvement of cardiovascular health (3–4 servings/week for 1600 kcal, 4–5 servings/week for 2000 kcals, ~0.6 servings/day), indicating room for improvement.37 Even a small increase in nut consumption is preventive of weight gain. In our cohort, an increase in intakes of different types of nuts and peanuts, by one serving/week (equivalent to 0.14 servings/day) was associated with less weight gain (ranging from −0.03 kg to −0.10 kg). Nuts are often consumed as snacks and as such could potentially improve diet quality by replacing other snacks high in saturated fat, sodium and added sugar.38 Substituting snacks such as chips (crisps) and desserts with any type of nut therefore offers a realistic and attainable dietary modification for long-term weight management. In addition to the impact on human health, using environmentally friendly plant-based protein, such as nuts and seeds, to replace animal sources of protein may contribute to the promotion of a global sustainable food system.39
Our study has several strengths. The large sample size including both sexes with high follow-up rate and long duration of the follow-up enabled us to evaluate subtle changes of gradual weight gain. The repeated prospective measures of diet and weight reduced potential biases due to reverse causation9 and the analyses on concurrent changes provided more robust, consistent and biologically plausible associations by simulating a dietary intervention study.
Several potential limitations should be considered. First, although we adjusted for parallel changes in many dietary and lifestyle factors, residual confounding cannot be completely ruled out. It is possible that other lifestyle and dietary changes accompanied the decision to change nut intakes. However, adjustment for correlated dietary factors including fruit, vegetables and further adjusted for AHEI without nuts and alcohol (online supplementary table S1) did not appreciably alter the results. Second, nut intake was self-reported and measurement error in self-reported diet is possible. However, our previous validation studies in a subsample of participants showed a reasonable degree of correlation between our FFQ questionnaire and multiple dietary records for nut intake. Bias due to reverse causation cannot be completely eliminated, such that perceived changes in body weight may lead to changes in diet, rather than the opposite temporal direction that we hypothesise. Finally, our cohorts largely consisted of Caucasian health professionals with relatively higher socioeconomic status, and thus the results may not be generalisable to other groups. Because of the lack of data on how nuts were prepared (ie, salted, raw, roasted), we were limited to examining the influence of preparation methods.
Conclusion
Our results indicate that increased consumption of total nuts or any types of nut (including peanuts) is associated with less long-term weight gain, despite being calorically dense. Incorporating nuts as part of a healthy dietary pattern by replacing less healthful foods may help mitigate the gradual weight gain common during adulthood, and beneficially contribute to the prevention of obesity. Our findings support food-based dietary recommendations and support the incorporation of nuts as an effective strategy for making attainable dietary modifications for the primary prevention of obesity.
References
Supplementary materials
Press_Release
Press_Release- Press_Release.pdf -
Press_Release
- Press_Release.pdf -
Footnotes
Contributors XL, YL, DKT: Conception or design of the work. XL, YL, MGF, DKT: Data analysis and interpretation. XL: Drafting the article. WCW, JP-DC, SNB: Critical revision of the article. DKT: Final approval of the version to be published.
Funding This study was supported by research grant UM1 CA186107, UM1 CA176726, and UM1 CA167552 from the National Institutes of Health.
Competing interests XL was partly funded by The Peanut Institution and YL was partly funded by the California Walnut Commission. The funders have no roles in study design, data collection and interpretation and decision on manuscript publication. J-PD-C is being supported by a Banting Postdoctoral Fellowship from the Canadian Institutes of Health Research (BPF-156628). J-PD-C received speaker and consulting honoraria from the Dairy Farmers of Canada in 2016 and 2018, outside the submitted work.
Patient consent for publication Not required.
Provenance and peer review Not commissioned; externally peer reviewed.
Data availability statement The Health Professionals Follow-up Study, the Nurses’ Health Study, and the Nurses’ Health Study II data may be used in collaboration with a principal investigator. Please see the study websites for more information: https://www.hsph.harvard.edu/hpfs/hpfs_collaborators.htm, and http://www.nurseshealthstudy.org/researchers.