Article Text

Abstract
Background Evidence suggests reducing consumption of sugar-sweetened beverages is important to reducing weight gain and chronic disease risk. Indonesia’s large population is a growing market for sugar-sweetened beverages. Taxation to reduce consumption is of interest, but considered fiscally regressive. Little is known about differential effects between income groups in low-income countries.
Methods This modelling study uses a proportional multistate life table to model reduced daily energy intake following a $0.30 per litre tax on sugar-sweetened beverages and subsequent shifts in Body Mass Index (BMI) distribution for income groups in Indonesia. Energy balance equations calculate reduced BMI. Reduced incidence of type 2 diabetes mellitus, ischaemic heart disease and stroke is determined from the relative risk of the BMI shift and subsequent health-adjusted life years gained calculated.
Results The tax’s effect was greater for higher income quintiles than lower. Energy intake reduced most in higher income quintiles. Cases of overweight and obesity for women decreased by approximately 15 000 in the lowest income quintile, but 417 000 for the highest. For men, this was 12 000 and 415 000. Over 25 years, 63 000 cases of diabetes were averted in the lowest quintile and 1 487 000 in the highest. Similar magnitudes were observed for stroke and ischaemic heart disease. Tax paid over 25 years was $0.5 billion for the lowest income quintile and $15.1 billion for the highest.
Conclusion Sugar-sweetened beverage taxation can help to reduce the number of overweight and obese, and prevent over a million cases of diabetes in Indonesia. Higher income groups would benefit more than lower income groups. The tax would raise $920 million in the first year and $27.3 billion over 25 years.
- obesity
- tax
- beverage tax
- chronic disease prevention
- diabetes
This is an open access article distributed in accordance with the Creative Commons Attribution Non Commercial (CC BY-NC 4.0) license, which permits others to distribute, remix, adapt, build upon this work non-commercially, and license their derivative works on different terms, provided the original work is properly cited, appropriate credit is given, any changes made indicated, and the use is non-commercial. See: http://creativecommons.org/licenses/by-nc/4.0/
Statistics from Altmetric.com
Key questions
What is already known?
Individuals from different socioeconomic groups have different patterns of sugar-sweetened beverage (SSB) consumption and risk profiles for non-communicable diseases.
Modelling studies indicated that SSB taxes can reduce consumption and Body Mass Index, leading to health gains for whole populations.
What are the new findings?
In Indonesia, higher income groups benefit substantially more from SSB taxation than lower income groups and pay more tax.
What do the new findings imply?
In countries that are still in the early phase of the transition to diets high in processed foods, SSB taxes initially benefit the health of wealthier sections of the middle class most.
Taxing energy-dense, nutrient-poor foods has the potential to slow the rise in obesity prevalence in low-income countries.
Introduction
The trend of increasing obesity prevalence and the rise in the burden of non-communicable disease (NCD) over the past several decades is of particular concern to low-income and middle-income countries.1 Lower income countries such as Indonesia are beginning to experience disease patterns similar to high-income countries, as more processed foods are incorporated into diets in a nutrition transition,2 3 with less of the necessary healthcare resources to cope with increased disease burden.
Globally, obesity or Body Mass Index (BMI) greater than 30 kg/m2 was estimated to have been the cause of 3.4 million deaths in 2010.4 Excess sugar consumption—particularly consumption of sugar-sweetened beverages (SSBs)—is a well-documented, significant causal factor for weight gain.5 6 Several studies have found increases in BMI per additional daily serve of SSB and decreases in BMI when SSB consumption is reduced.7 Excess body mass is a significant risk factor for many NCDs such as ischaemic heart disease (IHD), stroke, type 2 diabetes mellitus (T2DM) and various cancers,4 with the associated morbidity and mortality contributing to rising healthcare costs and reduced productivity.4 8 Excess sugar consumption directly increases the risk of T2DM,9 mediated through both the risk due to higher weight and directly through inflammatory mechanisms triggered by elevated blood sugars.10 11 Sugar consumption may directly increase risk of IHD through metabolic syndrome.12 13
Indonesia is a large, rapidly growing market for SSBs. There is a clear upward trend in BMI, with the prevalence of overweight rising from 23.4% in 2010 to 26.5% in 2014,14 and the NCD burden expected to increase similarly. The current burden of obesity in Indonesia is still lower than that in other East Asia Pacific countries which experienced an earlier nutrition transition.5 14 A study using data across 33 provinces of Indonesia determined obesity prevalence in the 20% of geographical areas with the lowest income to be 14.4%, while prevalence in the highest income quintile was 32.2%.15 Total prevalence of diagnosed and undiagnosed T2DM, and impaired glucose tolerance was 14.2% among the lowest socioeconomic groups and 16.4% in the highest.16
In 2014, total sales of SSBs were 3.894 billion litres, of which carbonated soft drinks account for 944 million litres (24.2%), juice for 167 million litres (4.3%), ready-to-drink coffee 16 million litres (0.4%), ready-to-drink tea 2145 million litres (55.1%) and energy drinks 622 million litres (16%),17 for a population of slightly more than 250 million people. Annual per capita sales of SSBs in Indonesia was around 16 litres in 2014, compared with over 70 litres in Singapore.14
It is recognised that states need to act to limit sugar content of food and beverages to reduce excess caloric consumption.18 19 Several countries, most notably Mexico, have implemented taxes on sugar or SSBs to decrease the rate of weight gain and generally improve diets.20 The Mexican example so far has demonstrated a 12% reduction in soft-drink sales following a 10% excise tax,21 providing an evidence-based model for other countries to emulate. This study models the impact of taxing SSBs on the prevalence of high BMI, T2DM, IHD and stroke, with the aim of determining the relative impact of such a tax on the health disparities experienced by different income groups in Indonesia.
Methods
Model structure
This study builds on a model developed for the ACE Prevention project22–24 and the general proportional multistate life table constructed for Indonesia.14 The model calculates the effects on consumption of a $0.30 per litre tax on SSBs (expressed in international dollars; an approximate 20% increase on average). Change in consumption determines shifts in the population BMI, the obesity-related diseases T2DM, IHD and stroke, and health-adjusted life years (HALYs). Price change was converted to a change in consumption using price elasticities (own-price elasticity of SSBs and cross-price elasticities for substitution to milk, diet drinks and fruit juice). The change in energy intake was calculated using average energy density for each beverage category (1609 kJ/L for SSBs, 1821 kJ/L for juice, 2660 kJ/L for milk and 4 kJ/L for diet drinks).14 Energy consumption is converted into BMI and weight gain using energy balance equations.25 The trend in BMI distribution between 1993 and 2008 was fitted on all years until 2035.14 Trends in per capita beverage sales between 2000 and 2014 were fitted to consumption until 2025.17 Shifts in BMI are modelled as a decrease in weight gain relative to the trend due to the lower energy consumption. Overweight is defined as BMI between 25 and 30 kg/m2, and obese as BMI >30 kg/m2. The effect of shifts in the body mass distribution on IHD and stroke incidence is modelled by continuous potential impact fractions,26 with the BMI distribution fitted to the log-normal distribution and the shift in mean BMI as the risk factor exposure. T2DM was modelled similarly, though with an additional direct, multiplicative risk reduction due to decreased SSB consumption independent of BMI.13 26 Differential equations describe the transition between disease states of healthy, diseased, dead from disease and death from all other causes, using rates of incidence, remission, case fatality and mortality, with all diseases modelled independently.27 Disability weights were used to estimate health-related quality of life losses associated with each disease to calculate the HALYs gained due to the intervention.28
Mean BMI, beverage consumption, price elasticities and mortality in the model were varied to reflect differences between income quintiles. The intervention effect is superimposed on the modelled trends, with the model running the population in 5-year age cohorts (0–4 to 95+) until death or age 96. Outputs are relative to a counterfactual scenario with no tax applied. Tax revenue is calculated from the baseline year 2013 as $0.30 per litre of SSBs consumed, assuming a 100% pass-on rate to consumers. Revenue, life years lived and health-adjusted life years lived were discounted at 3% per year. Numbers of new cases, prevalent cases and deaths were not discounted. It was implemented in MS Excel (Microsoft Office 2013) and uses the add-ins Ersatz (EpiGear, V.1.32) and MetaXL (EpiGear, V.5.3).29 Statistical analysis used Stata V.14.1. For a detailed description of the methods employed, readers are directed to the original papers.15 22–24
Data sources
Data on population structure are from the nationally representative National Socio-Economic Survey (SUSENAS), 2012. Household income quintiles were calculated using per capita household expenditure from the 2014 Indonesia Family Life Survey (IFLS) as a proxy for income. Linked anthropometric data were used to calculate the mean BMI for each 5-year age and sex group in each quintile.
Own-price and cross-price elasticities for each beverage category (carbonated soft drinks, milk, diet drinks, fruit juice) for each income quintile were estimated from published international sources, as Indonesian estimates were not available.30–34 Own-price elasticity estimates were derived from demand system analyses for Mexico (73 311 households), Ecuador (38 234 households) and New Zealand (6028 households) (table 1). Cross-price elasticities for milk, juice and diet drinks were derived from two demand system analyses for the USA (table 2). Pooled estimates for the cross-price elasticity for milk, juice and diet drinks were calculated using MetaXL. Low-income and high-income estimates for cross-price elasticities were assumed to be end points for quintiles 1 and 5, with interior points estimated (table 3).
Reported estimates for own-price elasticity of sugar-sweetened beverages per income quintile used to calculate pooled estimates
Relative risks (based on meta-analyses of cohort studies) and epidemiological input parameters for incidence, prevalence, mortality and case fatality rates are from the Global Burden of Disease study, which used a variety of data sources and modelling techniques to estimate the burden due to diseases and risk factors globally.4 DISMOD-II, an epidemiological modelling tool, was used to enforce consistency in estimates based on the mathematical relationship between disease parameters.27 Relative mortality rates for each quintile were derived mathematically from the Ng et al Indonesian cohort study (11 753 participants), which assessed HRs for mortality over 3 years by income group,35 by assuming a linear gradient between the lowest quintile and the average of the aggregated quintiles 2 to 5, and applied to the mortality rate in the base model (tables 2 and 3).
Data from published sources used to construct estimates of differences in parameters for income quintiles
Consumption data from a published systematic review of diet surveys in 187 countries was used to derive the average consumption of beverages for each age and sex group 20 years and older.36 Per capita SSB and milk expenditure for household members aged >20 in each income quintile were derived from the 2014 IFLS by 5- age and sex groups. Diet drinks were included with SSBs in the IFLS study, and juice expenditure was not measured. Per capita expenditure on beverages relative to the average for each quintile (table 3) was used to scale the average SSB and milk consumption in Indonesia, for each age and sex group 20 years and older in the base model. Relative SSB consumption was used to scale diet drinks, and juice consumption was not scaled. Consumption for ages below 20 was not modelled because the low incidence of disease in these ages means this has no impact on disease outcomes.4 Beverage prices were derived from Euromonitor data. The trend in per capita beverage sales between 2000 and 2014 from Euromonitor was calculated and applied to consumption estimates. The average SSB price was $1.51 in the model.
Input parameters used to vary the base model for each income quintile, from lowest (1) to highest (5) (BMI distribution not shown)
Uncertainty analysis
Uncertainty analysis was conducted using Monte Carlo simulation in Ersatz, varying the estimates for own and cross price elasticity, relative consumption of SSBs between income quintiles, relative risk of IHD, stroke and T2DM incidence due to age and BMI, and relative risk of SSB consumption on T2DM. Normal distributions were used for elasticities and relative risks, and log-normal distributions were used for relative consumption. Two thousand runs were conducted for each quintile.
Sensitivity analysis
Several sensitivity analyses were conducted with 2000 runs in Ersatz, as there are multiple components of the analysis which would impact the estimated effects. We investigated the impact of trends, price elasticities, mortality by income quintile and pricing. As the data regarding differential disease incidence and mortality for income groups in Indonesia are not robust, these were included in a sensitivity analysis (see online supplementary material for description of methods, data and results for this analysis).16 37–39 To determine if the projected growth of BMI and SSB consumption altered the estimated tax effect, the trends were set to zero (no change). To determine the impact of price elasticity differences, the model was run with equal price elasticities for income quintiles, using elasticities reported in a meta-analysis by Cabrera Escobar et al.40 Own-price elasticity was reported as −1.30 for SSBs, and cross-price elasticities were −0.42, 0.13 and 0.39 for diet drinks, whole milk and fruit juice, respectively.
Supplemental material
As the range of food items considered for substitution was limited, it is possible that the energy reduction was overestimated. Health outcomes were assessed assuming only half of the energy reduction from decreased SSB intake, ignoring cross-price elasticities. The impact on HALYs of the different mortality rates between income quintiles was assessed by assuming equal mortality rates for income quintiles. As differences between quintiles were constructed using expenditure not volume consumed, differences in price paid were not taken into account. The reduction in consumption was estimated using weighted expenditures to account for differences in prices paid for beverages by income quintile, using the relative differences in prices paid for high-income and low-income groups reported by Zhen et al.41
Results
As a result of the tax on SSBs, energy intake decreased by 17 kJ/person/day after accounting for substitution to other beverages. This resulted in 443 000 fewer cases of overweight (−2.9% of estimated counterfactual) and 204 000 fewer cases of obese (−7.3%) men. For women, this reduced the number of overweight cases by 321 000 (−1.4%) and obese by 348 000 (−3.9%) (table 4).
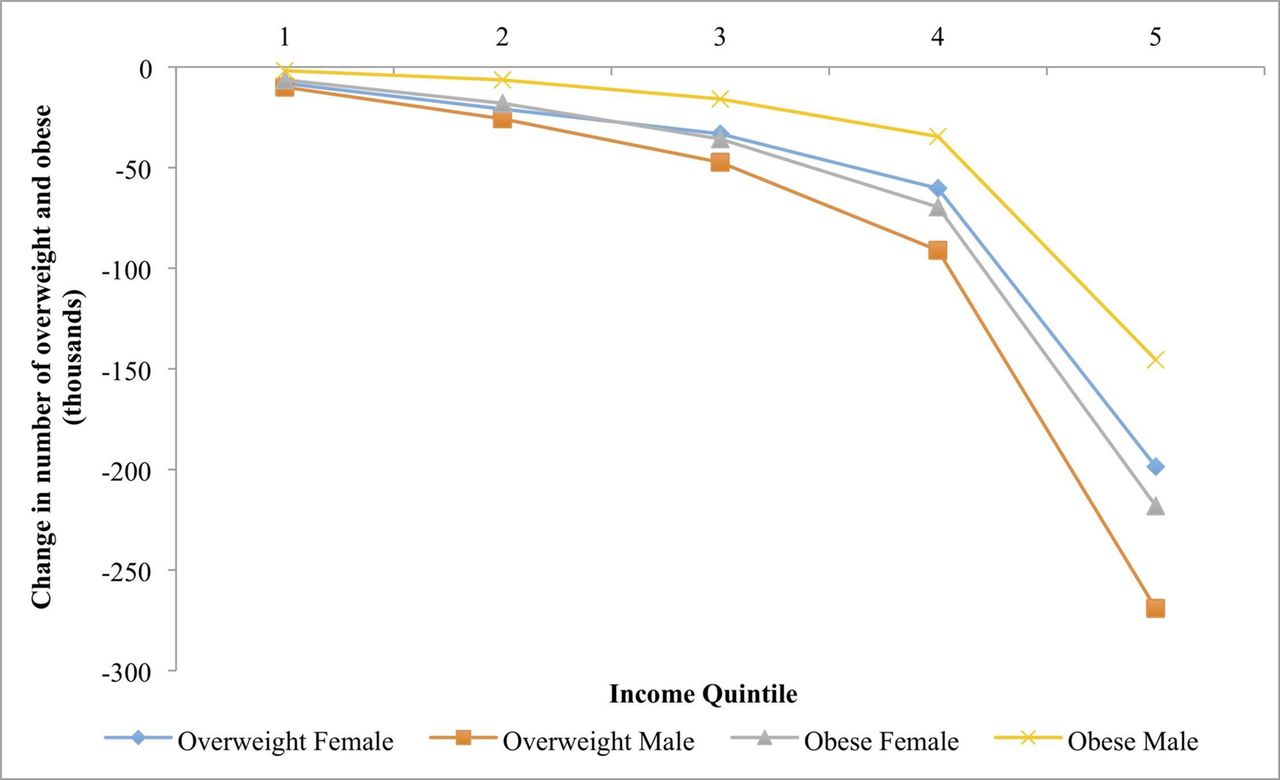
The magnitude of estimated changes in energy intake and cases of overweight and obesity increases as income increases from quintiles 1 to 5 (table 4, figure 1). Energy consumption decreased for the lowest income group, quintile 1, by 1.9 kJ/person/day, but decreased by 53.1 kJ/person/day for the highest, quintile 5. The average person in quintile 1 would spend $10, compared with $300 in quintile 5 (0.002% and 0.01% of total per capita expenditure annually), on the tax over a 25-year period (discounted 3%).
Change in prevalence of overweight and obesity in men and women for each income quintile over 25 years, in thousands, from lowest income (1) to highest income (5).
The number of overweight women in quintile 1 decreased by 8000 (−0.2% of estimated number of overweight), but 198 000 (−4.2%) for quintile 5 (figure 1 and table 4). A similar reduction was modelled among men, with the decrease across quintiles 10 000 (−0.5%) and 269 000 (−6.7%), respectively. Incident cases of obesity decreased more in absolute numbers for women than for men, but as a percentage of total obesity, men benefited to a greater extent (−0.4% for quintile 1 and −10.6% for quintile 5 for women, and −0.8% for quintile 1 and −14.9% for men).
Consequently, health benefits in terms of disease outcomes also accrued most in the higher income groups—particularly quintile 5—shown in table 4. While total incident cases of T2DM were estimated to decrease by 63 000 (−0.5%) over 25 years for the lowest income quintile, the estimated reduction was 1 487 000 (−8.8%) in the highest quintile. For stroke incidence over 25 years, this reduction was 1400 (−0.07%) for the lowest and 45 000 (−2.0%) for the highest income quintile. Incidence of IHD reduced by 1500 (−0.07%) and 48 000 (−2.1%) for the lowest and highest, respectively. Disease mortalities follow a similar pattern, with total lifetime HALYs increasing by 49 000 for quintile 1 and 1 688 000 for quintile 5.
Impact on beverage and energy consumption, cases of overweight, obesity, T2DM, IHD and stroke, mortality and revenue raised following $0.30 tax on SSBs, for income quintiles 1 (lowest income) to 5 (highest income)
When the trends in BMI and SSB consumption are removed from the model, the reduced numbers of obese men and women are 83%–92% of the base model across quintiles (table 5). HALYs gained for men and women are 29% and 28% of the base case, respectively, for quintile 1, and 36% and 34% for quintile 5. Using equal elasticities for each quintile resulted in greater variation from the base model for men and women in quintile 1 for HALYs gained and reduced cases of obesity than for higher income quintiles. Assuming only half of the modelled decrease in energy consumption and ignoring cross-price elasticities, the number of reduced cases of obesity was approximately halved for men and women in all quintiles, while HALYs gained were 54%–58% of the base model. Removing differences in general mortality rates for quintiles had little effect on obesity. The HALYs gained slightly increased for men in quintiles 1 and 2 (5 and 7%) and decreased for men in quintile 5 (−8%). Using weighted expenditure estimates to account for differences in prices paid, HALYs gained for men and women in quintile 1 increased (2% and 3%) and decreased in quintile 5 (−4% and −3%). The number of reduced cases of obesity did not change much relative to the base model. Results for changes in disease incidence are reported in online supplementary table 4.
The multivariate sensitivity analysis for disease-specific parameters (incidence, prevalence and mortality) scaled for income quintile showed little difference from the original model (online supplementary table 3).
Results from sensitivity analyses modelling no trend in BMI or beverage consumption, equal elasticity estimates for quintiles, halved change in energy intake without cross-price elasticities, equal mortality for quintiles and weighted prices, with output expressed as proportion of base model results
Discussion
The Indonesian government is considering implementing a tax on SSBs to reduce sugar consumption and future weight gain. Our findings suggest that a $0.30 excise tax on SSBs will reduce weight and lead to decreased incidence of NCDs. While it increases the health status of all groups, the health benefits of the tax accrued mostly in the higher income groups because these have the highest levels of SSB consumption and are most at risk of non-communicable diseases. Total tax paid was much greater in the higher income groups as well. The tax is thus not regressive. Decreased incidence of IHD and stroke was modelled only by the effect of BMI on incidence, so reduced incidence was observed more in the higher income quintiles. The decrease in T2DM was modelled incorporating both the effect of BMI on incidence and the direct effect of SSB consumption. Because higher income groups had a greater reduction in SSB consumption, the benefit of reduced T2DM incidence was significantly greater for these groups.
Few studies in this area have estimated health effects beyond reductions in weight, and this study contributes to the evidence for taxing SSBs by additionally determining the impact on the NCDs T2DM, IHD and stroke. The results did not change substantially when a multivariate sensitivity analysis was conducted to include differences across income groups in disease incidence, prevalence and case fatality. The study is limited by a lack of Indonesian specific data for parameters that vary by income group (price elasticities, disease incidence and mortality). The populations in the international studies these parameters were derived from are not necessarily similar to Indonesia in SSB consumption. It was assumed that trends in beverage consumption and BMI increase did not vary between the income quintiles, which may not be realistic.
The reduction in energy intake was much greater for higher than lower income groups, and the subsequent reduced weight gain relative to the trend and averted incidence of disease accrued mostly to the higher income groups. This appears to contradict the findings of several other studies that have investigated the impact of SSB taxes on different income groups. Studies regarding price elasticities have determined lower income households to have a greater sensitivity to price30–32 41 42 and therefore are assumed to decrease consumption of SSBs proportionally more in response to a tax. Modelling studies from high-income countries have shown greater reductions for lower income groups.41 42 But these countries are at a different stage in the nutrition transition and have different patterns of SSB consumption and BMI distribution. In Indonesia, lower income people consume significantly fewer SSBs than higher income people, and it is the highest quintile of the population that has the highest body mass, in contrast to the situation in higher income countries. In an Australian study, Sharma et al noted that the largest reductions in weight were for those who already consumed large quantities of beverages.42 The difference in expenditure on beverages between income groups in Indonesia was very large, with quintile 5 (highest income) spending 27 times as much on SSBs as quintile 1 (lowest income), and 10 times as much on milk, which is a common substitute for SSBs. Higher income groups consuming more expensive varieties of SSB may contribute to this big differential.
The model did not account for substitution to beverage categories other than juice, milk and diet drinks. A demand system analysis from Mexico suggested there may also be limited substitution to snacks and other sugary foods that are not incorporated in this model.30 The large demand system created by Zhen et al estimated substitution to 23 packaged foods and beverages,41 and a composite numeraire for all other goods, and determined that the actual reduction in energy intake would be about half of the reduction generally estimated from modelling of limited substitution. Without including substitution to a larger range of beverages or snacks, the model may be overestimating the effect of the tax on reduction in energy intake and subsequent weight distribution. This was investigated as a sensitivity analysis. The effects on overweight, obesity, stroke and IHD were approximately halved, while impacts on T2DM decreased by 40%.
More work can be done to determine the trends in BMI and SSB consumption for income quintiles, and to estimate own-price and cross-price elasticities specifically for Indonesia. The model could be improved by including measured differences in disease incidence, prevalence and mortality for NCDs across income quintiles in Indonesia.
Conclusion
This study provides an evidence base for other low-income to middle-income countries to inform research, policy formulation and public health campaigns. A SSB tax can reduce the incidence and prevalence of NCDs, both directly and through their impact on BMI. In a middle-income country in the early stages of the nutrition transition such as Indonesia, the initial benefits of this policy are directed mostly at higher income groups, who also pay more of the tax than lower income groups.
Acknowledgments
This work would not have been possible without the analysis framework and models created by Lennert Veerman, Jan Barendregt, Linda Cobiac and many others for projects such as Assessing Cost Effectiveness (ACE) studies.
References
Footnotes
Handling editor Seye Abimbola
Contributors EJB was responsible for the planning, research, gathering and analysis of data used for income group parameters, alteration of the base model, analysis of the model outputs and reporting of the work. JLV was responsible for planning and construction of the base model, supervision of the work, statistical review of the altered model and review of the report.
Funding This work was undertaken and funded as part of a research subject at the University of Queensland.
Competing interests None declared.
Patient consent Not required.
Provenance and peer review Not commissioned; externally peer reviewed.
Data sharing statement Detailed data, percentage changes and impact during different time horizons for almost all variables reported in the main analysis and sensitivity analyses are available on request to the authors.