


Abstract
The Arabidopsis (Arabidopsis thaliana) mutant stop1 (for sensitive to proton rhizotoxicity1) carries a missense mutation at an essential domain of the histidine-2-cysteine-2 zinc finger protein STOP1. Transcriptome analyses revealed that various genes were down-regulated in the mutant, indicating that STOP1 is involved in signal transduction pathways regulating aluminum (Al)- and H+-responsive gene expression. The Al hypersensitivity of the mutant could be caused by down-regulation of AtALMT1 (for Arabidopsis ALUMINUM-ACTIVATED MALATE TRANSPORTER1) and ALS3 (ALUMINUM-SENSITIVE3). This hypothesis was supported by comparison of Al tolerance among T-DNA insertion lines and a transgenic stop mutant carrying cauliflower mosaic virus 35S∷AtALMT1. All T-DNA insertion lines of STOP1, AtALMT1, and ALS3 were sensitive to Al, but introduction of cauliflower mosaic virus 35S∷AtALMT1 did not completely restore the Al tolerance of the stop1 mutant. Down-regulation of various genes involved in ion homeostasis and pH-regulating metabolism in the mutant was also identified by microarray analyses. CBL-INTERACTING PROTEIN KINASE23, regulating a major K+ transporter, and a sulfate transporter, SULT3;5, were down-regulated in the mutant. In addition, integral profiling of the metabolites and transcripts revealed that pH-regulating metabolic pathways, such as the γ-aminobutyric acid shunt and biochemical pH stat pathways, are down-regulated in the mutant. These changes could explain the H+ hypersensitivity of the mutant and would make the mutant more susceptible in acid soil stress than other Al-hypersensitive T-DNA insertion lines. Finally, we showed that STOP1 is localized to the nucleus, suggesting that the protein regulates the expression of multiple genes that protect Arabidopsis from Al and H+ toxicities, possibly as a transcription factor.
Plants modulate tolerant mechanisms to adapt to various environmental stresses, such as drought, salinity, and soil acidity (Seki et al., 2003; Kochian et al., 2004). Molecular characterization of such systems is critical to develop efficient breeding programs to make crop plants with high productivity under stress environments. In this context, tolerance mechanisms to various stress factors involved in acid soils (e.g. rhizotoxicities of Al3+ and H+ [Kinraide, 2003], excess of manganese [Horst, 1988], and phosphorus deficiency [Neumann et al., 1999]) are important targets, because about 40% of world arable land is categorized as acid soil.
A number of genes that are responsible for Al tolerance have been isolated from various plant species. Genes encoding malate and citrate transporters were identified as key genes in the Al-exclusion mechanism, such as those encoding Al-activated malate transporters in wheat (Triticum aestivum; TaALMT1 [Sasaki et al., 2004]) and in Arabidopsis (Arabidopsis thaliana; AtALMT1 [Hoekenga et al., 2006]), and for the gene encoding a citrate transporter in sorghum (Sorghum bicolor; Magalhaes et al., 2007). ALS3, encoding a half-type ATP-binding cassette transporter that may be involved in the redistribution process of Al from sensitive tissues in Arabidopsis, was isolated by a mutant study (Larsen et al., 2005). On the other hand, molecular physiological studies identified several key genes regulating efficient phosphorus acquisition, such as the high-affinity phosphate transporter (Mitsukawa et al., 1997). Although H+ is highly rhizotoxic to various plant species (Koyama et al., 1995; Yokota and Ojima, 1995; Kinraide, 2003; Watanabe and Okada, 2005), our knowledge of the molecular basis for its toxicity is limited compared with that of other coexisting stress factors in acid soils, such as manganese toxicity (Delhaize et al., 2003).
Studies on rhizotoxicity indicate that patterns of damage caused by H+ are distinct from those induced by Al (Koyama et al., 1995). In addition, these stress factors were distinguished by a modeling of root elongation in acidic forest soil (Kinraide, 2003). These reports suggest that H+ and Al rhizotoxicities induce damage in the roots by different processes. However, several studies selecting Al-tolerant cultivars suggested that H+ tolerance and Al tolerance are genetically linked in some plant species (Rangel et al., 2005; Yang et al., 2005). These suggest that, although the mechanisms of the toxicities of H+ and Al would involve distinct biological processes, tolerance to these stresses might be concomitantly regulated in some plant species, possibly by the same genetic factors. Recently, we isolated an Arabidopsis mutant that shows hypersensitivity to H+ rhizotoxicity and, interestingly, hypersensitivity to Al (Iuchi et al., 2007). The mutant might be a useful model to dissect the mechanism(s) of H+ tolerance at the molecular level and the interaction of tolerance mechanisms to Al3+ and H+.
The stop1 (for sensitivity to proton rhizotoxicity1) mutant of Arabidopsis was isolated from an ethyl methanesulfonate-mutagenized population using growth inhibition of the roots in the root-vending assay on low-pH gelled medium as a selection index (Iuchi et al., 2007). Interestingly, the stop1 mutant was also hypersensitive to Al, although it was selected by H+ sensitivity. Chromosome-walking analyses, followed by genomic DNA sequencing analysis, revealed that the stop1 mutant carries a missense mutation that substitutes an essential His residue with Tyr in the Cys-2-Hys-2 motif of a putative zinc finger protein, STOP1. On the other hand, one of the critical genes for Al tolerance in Arabidopsis, namely AtALMT1, encoding an Al-activated malate transporter (Hoekenga et al., 2006), was down-regulated in the stop1 mutant (Iuchi et al., 2007). This turns off the major Al tolerance mechanism of Arabidopsis in the stop1 mutant, namely Al-responsive malate release (Kobayashi et al., 2007). However, reverse genetics studies revealed that AtALMT1 is not involved in the H+-tolerant mechanisms, because a knockout mutant (i.e. T-DNA insertion line) of AtALMT1 was not sensitive to H+ (Kobayashi et al., 2007). These results suggest that STOP1 functions to regulate the expression of other genes that critically affect hypersensitivity to H+ and also to Al. Recently, Liu et al. (2009) reported that one of the other genes for Al tolerance in Arabidopsis (i.e. a type of multidrug and toxic compound exclusion protein [AtMATE]; At1g51340) is regulated by STOP1. Although zinc finger proteins have various functions (Englbrecht et al., 2004), these results suggest that STOP1 is one of the key factors involved in the signal transduction pathways regulating tolerance mechanisms to Al and H+ rhizotoxicities, which would consist of various genes other than AtALMT1 (Iuchi et al., 2007) and AtMATE for Al tolerance (Liu et al., 2009).
In this study, we performed molecular physiological characterization of the hypersensitivities of the stop1 mutant to both Al and H+. DNA microarray analysis revealed that multiple genes critical for Al tolerance (i.e. AtALMT1 and ALS3) and those potentially contributing to low pH resistance were down-regulated in the stop1 mutant, such as genes belonging to biological processes of ion homeostasis (i.e. potassium and others). In addition, an integrated analysis of metabolites and transcripts revealed that metabolic pathways that have been assumed to regulate cytosolic pH of the plant (biochemical pH stat [Sakano, 1998] and γ-aminobutyric acid [GABA] shunt [Bouche and Fromm, 2004] pathways) were also down-regulated in the mutant. Interestingly, both ion homeostasis and pH-regulating metabolism are critical for low pH resistance in other organisms, such as Escherichia coli (Yohannes et al., 2004) and fish (Hirata et al., 2003) and possibly in higher plants (Yan et al., 1992). These results indicated that STOP1 regulates multiple tolerant mechanisms to major stress factors of acid soil and that some of the H+-resistant systems down-regulated in the stop1 mutant are similar to those of other organisms.
RESULTS
Transcriptomic Identification of Repressed Genes in the stop1 Mutant
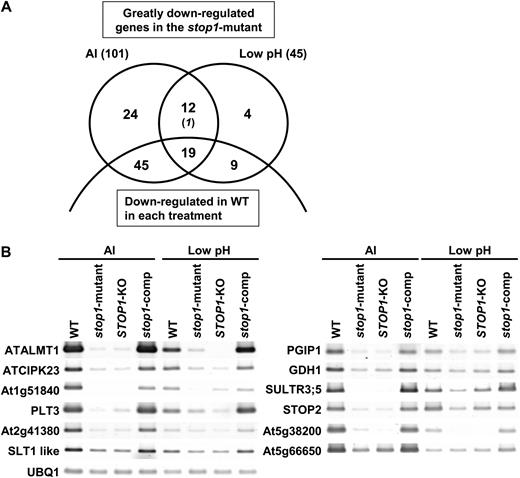
A, Genes repressed in the stop1 mutant compared with the wild type (WT) that were identified by competitive microarray analyses. Greatly repressed genes in the stop1 mutant, when they were compared with the wild type, were identified by three biologically independent replications of the comparative microarray of the stop1 mutant/wild type under Al toxic (10 μ m) and low-pH (pH 4.5) conditions. The genes that were in the lowest percentile of the FC values (stop1 mutant/wild type) in all three replications were defined as “significantly down-regulated genes.” Numbers of down-regulated genes in the wild type in each treatment (FC in treatments/control in the wild type were < 1 with P < 0.05 and FC < 0.8) are shown in the lower parts of the Venn diagram. The genes down-regulated in AtALMT1-KO compared with the wild type in the upper parts are shown by italics. B, Expression levels of 12 overlapped genes in the wild type, the stop1 mutant, STOP1-KO, and a complemented stop1 mutant carrying CaMV35S∷STOP1 (stop1-comp) were determined by semiquantitative RT-PCR.
Down-regulation in the stop1 mutant may occur if the expression of the genes is related to growth rate, because growth is inhibited in the mutant more severely than in the wild type. Such genes would be down-regulated in the wild type with Al and H+ treatments, where the growth rate of the wild type was reduced compared with the control treatment. Such genes were filtered from the above selected genes using FC values of the competitive microarrays in the wild type (i.e. Al treatments/control and H+/control). To maximize the effect of this filtering, both the genes significantly down-regulated in the treatments (FC < 1 with P < 0.05 by t test), and those with FC < 0.8 were filtered out. By this procedure, 64 (Al) and 28 (H+) genes, including 19 of the overlapping genes (detected by both Al and H+), were filtered out from the list of significantly down-regulated genes in the stop1 mutant (Fig. 1; Supplemental Table S1). More than half of such filtered genes were down-regulated in the T-DNA insertion mutant of AtALMT1 (AtALMT1-KO) with Al treatment (FC [AtALMT1-KO/wild type] < 1 with P < 0.05 by t test and/or FC < 0.8; Table I
List of repressed genes in the stop1 mutant among up-regulated or stable genes in the wild type under Al and low-pH conditions (Fig. 1)
Three biologically independent replications of competitive microarray analyses were carried out as follows: stop1 mutant versus the wild type in Al (10 μ m, 24 h) or low pH (pH 4.5, 24 h); AtALMT1-KO versus the wild type in Al (10 μ m, 24 h); control (pH 5.0, no Al, 24 h) versus Al (10 μ m, pH 5.0, 24 h) or low pH (pH 4.5, 24 h) in the wild type. FC ± sd values are shown, as are P values from t tests for significant differences from FC = 1.00.
Arabidopsis Genome Initiative Code | FC (stop1 Mutant or AtALMT1-KO/Wild Type) | FC in the Wild Type with Al or Low-pH Treatments (Treatment/Control) | Description | |||||||||||||||||||
|---|---|---|---|---|---|---|---|---|---|---|---|---|---|---|---|---|---|---|---|---|---|---|
| Al stop1 Mutant | Low-pH stop1 Mutant | Al AtALMT1-KO | Al | Low pH | ||||||||||||||||||
| FC ± sd | P | FC ± sd | P | FC ± sd | P | FC ± sd | P | FC ± sd | P | |||||||||||||
| Repressed in the stop1 mutant and up-regulated or stable in the wild type with Al and low-pH treatments; 12 (+1 of the gene repressed in AtALMT1-KO) genes | ||||||||||||||||||||||
| At1g08430 | 0.01 ± 0.00 | 0.001 | 0.01 ± 0.00 | 0.000 | 0.01 ± 0.00 | 0.001 | 24.40 ± 13.8 | 0.009 | 7.41 ± 4.07 | 0.021 | ATALMT1 (Al-activated malate transporter 1) | |||||||||||
| At1g30270 | 0.13 ± 0.03 | 0.003 | 0.19 ± 0.02 | 0.001 | 1.02 ± 0.14 | 0.866 | 1.44 ± 0.09 | 0.009 | 1.42 ± 0.25 | 0.073 | ATCIPK23 (CBL-interacting protein kinase 23) | |||||||||||
| At1g51840 | 0.25 ± 0.06 | 0.010 | 0.40 ± 0.06 | 0.008 | 1.03 ± 0.15 | 0.765 | 1.31 ± 0.42 | 0.272 | 1.21 ± 0.30 | 0.305 | Similar to Leu-rich repeat protein kinase, putative | |||||||||||
| At2g18480 | 0.06 ± 0.01 | 0.002 | 0.12 ± 0.09 | 0.031 | 1.08 ± 0.15 | 0.433 | 6.97 ± 1.12 | 0.002 | 1.89 ± 0.08 | 0.001 | PLT3 (probable polyol transporter 3) | |||||||||||
| At2g41380 | 0.04 ± 0.01 | 0.003 | 0.14 ± 0.08 | 0.025 | 1.11 ± 0.16 | 0.327 | 6.98 ± 3.70 | 0.021 | 2.28 ± 0.57 | 0.028 | Similar to embryo-abundant protein-related | |||||||||||
| At5g02480 | 0.19 ± 0.03 | 0.003 | 0.31 ± 0.08 | 0.015 | 1.07 ± 0.15 | 0.491 | 2.02 ± 0.31 | 0.015 | 1.18 ± 0.07 | 0.040 | Similar to SLT1 (sodium- and lithium-tolerant 1) | |||||||||||
| At5g06860 | 0.05 ± 0.00 | 0.000 | 0.13 ± 0.06 | 0.017 | 1.17 ± 0.17 | 0.201 | 1.93 ± 1.46 | 0.232 | 1.00 ± 0.74 | 0.992 | PGIP1 (polygalacturonase-inhibiting protein 1) | |||||||||||
| At5g18170 | 0.08 ± 0.01 | 0.001 | 0.27 ± 0.11 | 0.030 | 1.26 ± 0.18 | 0.109 | 2.91 ± 0.39 | 0.005 | 1.19 ± 0.10 | 0.068 | GDH1 (glutamate dehydrogenase 1) | |||||||||||
| At5g19600 | 0.01 ± 0.00 | 0.002 | 0.29 ± 0.06 | 0.008 | 1.33 ± 0.19 | 0.074 | 1.50 ± 0.45 | 0.138 | 2.08 ± 0.37 | 0.019 | SULTR3;5 (sulfate transporter 3;5) | |||||||||||
| At5g22890 | 0.06 ± 0.01 | 0.001 | 0.16 ± 0.08 | 0.023 | 1.07 ± 0.15 | 0.520 | 1.03 ± 0.20 | 0.809 | 1.15 ± 0.15 | 0.200 | STOP2 (a STOP1 homolog) | |||||||||||
| At5g38200 | 0.02 ± 0.00 | 0.001 | 0.10 ± 0.04 | 0.009 | 1.06 ± 0.15 | 0.552 | 4.16 ± 1.79 | 0.027 | 1.77 ± 0.19 | 0.012 | Similar to hydrolase | |||||||||||
| At5g66650 | 0.24 ± 0.03 | 0.003 | 0.19 ± 0.13 | 0.043 | 1.03 ± 0.15 | 0.766 | 9.13 ± 1.11 | 0.001 | 2.68 ± 1.17 | 0.055 | Similar to unknown protein | |||||||||||
| At1g53480 | 0.02 ± 0.01 | 0.002 | 0.02 ± 0.01 | 0.007 | 0.01 ± 0.00 | 0.003 | 1.02 ± 0.02 | 0.341 | 1.10 ± 0.05 | 0.060 | Similar to unknown protein | |||||||||||
| Repressed in the stop1 mutant and up-regulated or stable in the wild type with Al treatment; 24 genes | ||||||||||||||||||||||
| At1g35670 | 0.34 ± 0.02 | 0.001 | 0.76 ± 0.06 | 0.030 | 1.05 ± 0.15 | 0.598 | 1.35 ± 0.07 | 0.011 | 0.53 ± 0.08 | 0.020 | ATCDPK2 (calcium-dependent protein kinase 2) | |||||||||||
| At1g60610 | 0.26 ± 0.05 | 0.006 | 0.54 ± 0.05 | 0.008 | 0.95 ± 0.14 | 0.618 | 1.68 ± 0.23 | 0.023 | 1.16 ± 0.10 | 0.095 | Similar to protein-binding/zinc ion-binding | |||||||||||
| At1g61560 | 0.26 ± 0.03 | 0.003 | 0.61 ± 0.09 | 0.029 | 0.99 ± 0.14 | 0.955 | 3.34 ± 0.75 | 0.011 | 2.65 ± 1.02 | 0.045 | MLO6 (mildew resistance locus O6) | |||||||||||
| At1g72870 | 0.22 ± 0.09 | 0.021 | 0.59 ± 0.15 | 0.064 | 0.92 ± 0.13 | 0.406 | 1.29 ± 0.32 | 0.213 | 0.60 ± 0.05 | 0.008 | Putative disease resistance protein (TIR-NBS class) | |||||||||||
| At1g77760 | 0.18 ± 0.05 | 0.008 | 0.88 ± 0.30 | 0.574 | 1.29 ± 0.19 | 0.088 | 1.66 ± 0.30 | 0.038 | 1.68 ± 0.13 | 0.007 | NIA1 (nitrate reductase 1) | |||||||||||
| At2g01180 | 0.31 ± 0.03 | 0.003 | 0.59 ± 0.09 | 0.028 | 1.03 ± 0.15 | 0.779 | 2.13 ± 0.32 | 0.013 | 1.04 ± 0.09 | 0.525 | ATPAP1 (phosphatidic acid phosphatase 1) | |||||||||||
| At2g16660 | 0.34 ± 0.01 | 0.001 | 0.53 ± 0.06 | 0.009 | 1.23 ± 0.18 | 0.126 | 2.62 ± 0.66 | 0.021 | 1.29 ± 0.43 | 0.310 | Similar to nodulin family protein | |||||||||||
| At2g23150 | 0.31 ± 0.03 | 0.002 | 0.61 ± 0.13 | 0.054 | 1.04 ± 0.16 | 0.661 | 2.80 ± 0.55 | 0.012 | 1.27 ± 0.08 | 0.020 | NRAMP3 (manganese ion transporter) | |||||||||||
| At2g28270 | 0.08 ± 0.03 | 0.006 | 0.41 ± 0.26 | 0.114 | 0.98 ± 0.23 | 0.873 | 2.52 ± 0.92 | 0.046 | 0.74 ± 0.34 | 0.357 | Similar to DC1 domain-containing protein | |||||||||||
| At2g39380 | 0.28 ± 0.05 | 0.005 | 0.83 ± 0.07 | 0.064 | 1.03 ± 0.15 | 0.753 | 1.41 ± 0.21 | 0.054 | 2.63 ± 0.22 | 0.003 | ATEXO70H2 (exocyst subunit EXO70 family protein H2) | |||||||||||
| At2g39510 | 0.27 ± 0.07 | 0.013 | 1.32 ± 1.12 | 0.579 | 1.35 ± 0.20 | 0.072 | 9.60 ± 7.83 | 0.032 | 1.97 ± 1.57 | 0.235 | Similar to nodulin MtN21 family protein | |||||||||||
| At2g43590 | 0.25 ± 0.10 | 0.025 | 1.09 ± 0.50 | 0.754 | 0.84 ± 0.15 | 0.157 | 3.20 ± 0.63 | 0.009 | 2.22 ± 2.00 | 0.214 | Putative chitinase | |||||||||||
| At2g45220 | 0.26 ± 0.04 | 0.005 | 0.69 ± 0.02 | 0.003 | 1.13 ± 0.29 | 0.458 | 1.98 ± 0.26 | 0.012 | 0.43 ± 0.11 | 0.026 | Similar to pectin esterase family protein | |||||||||||
| At3g05400 | 0.19 ± 0.04 | 0.004 | 0.63 ± 0.15 | 0.076 | 1.20 ± 0.17 | 0.158 | 2.98 ± 1.04 | 0.031 | 1.07 ± 0.09 | 0.293 | SUGTL5 (sugar transporter ERD6-like 12) | |||||||||||
| At3g28290 | 0.13 ± 0.03 | 0.004 | 0.46 ± 0.16 | 0.055 | 0.87 ± 0.12 | 0.237 | 1.51 ± 0.13 | 0.014 | 0.93 ± 0.28 | 0.713 | Similar to AT14A | |||||||||||
| At4g13420 | 0.03 ± 0.00 | 0.000 | 2.21 ± 1.35 | 0.135 | 0.84 ± 0.12 | 0.165 | 7.54 ± 4.39 | 0.023 | 6.86 ± 1.12 | 0.002 | HAK5 (high-affinity K+ transporter 5) | |||||||||||
| At4g16563 | 0.09 ± 0.07 | 0.026 | 0.22 ± 0.27 | 0.113 | 1.13 ± 0.28 | 0.449 | 1.22 ± 0.31 | 0.307 | 0.35 ± 0.04 | 0.004 | Similar to aspartyl protease family protein | |||||||||||
| At4g30270 | 0.28 ± 0.06 | 0.010 | 0.84 ± 0.63 | 0.693 | 0.91 ± 0.15 | 0.407 | 12.56 ± 5.39 | 0.009 | 2.05 ± 0.76 | 0.074 | MERI5B (endoxyloglucan transferase) | |||||||||||
| At4g38470 | 0.29 ± 0.05 | 0.007 | 0.80 ± 0.22 | 0.297 | 1.17 ± 0.17 | 0.200 | 1.13 ± 0.20 | 0.343 | 1.15 ± 0.17 | 0.245 | Similar to protein kinase family protein | |||||||||||
| At5g07440 | 0.29 ± 0.05 | 0.005 | 0.54 ± 0.15 | 0.060 | 1.16 ± 0.17 | 0.208 | 2.55 ± 0.16 | 0.001 | 1.23 ± 0.17 | 0.123 | GDH2 (glutamate dehydrogenase 2) | |||||||||||
| At5g11670 | 0.26 ± 0.07 | 0.012 | 0.67 ± 0.06 | 0.017 | 1.02 ± 0.14 | 0.834 | 3.62 ± 0.78 | 0.009 | 1.53 ± 0.15 | 0.018 | ATNADP-ME2 (malic enzyme 2) | |||||||||||
| At5g17860 | 0.31 ± 0.03 | 0.003 | 0.98 ± 0.02 | 0.208 | 0.98 ± 0.17 | 0.837 | 1.28 ± 0.06 | 0.012 | 1.02 ± 0.06 | 0.681 | CAX7 (calcium exchanger 7) | |||||||||||
| At5g47560 | 0.12 ± 0.02 | 0.002 | 0.75 ± 0.15 | 0.129 | 1.09 ± 0.19 | 0.423 | 1.05 ± 0.12 | 0.557 | 1.06 ± 0.12 | 0.457 | ATTDT (tonoplast malate/fumarate transporter) | |||||||||||
| At5g66800 | 0.33 ± 0.03 | 0.003 | 0.58 ± 0.06 | 0.011 | 0.71 ± 0.11 | 0.057 | 1.04 ± 0.05 | 0.248 | 0.91 ± 0.06 | 0.124 | Similar to unknown protein | |||||||||||
| Repressed in the stop1 mutant and up-regulated or stable in the wild type with low-pH treatment; four genes | ||||||||||||||||||||||
| At1g62280 | 0.97 ± 0.62 | 0.936 | 0.47 ± 0.01 | 0.001 | 0.84 ± 0.15 | 0.161 | 0.33 ± 0.30 | 0.133 | 1.06 ± 0.51 | 0.858 | SLAH1 (SLAC1 homolog 1) | |||||||||||
| At1g75840 | 0.58 ± 0.04 | 0.005 | 0.47 ± 0.03 | 0.002 | 0.99 ± 0.15 | 0.879 | 0.94 ± 0.14 | 0.570 | 1.03 ± 0.06 | 0.460 | ATROP4 (rho-like GTP-binding protein 4) | |||||||||||
| At3g12750 | 0.60 ± 0.05 | 0.010 | 0.46 ± 0.09 | 0.020 | 1.42 ± 0.21 | 0.053 | 0.55 ± 0.04 | 0.004 | 1.62 ± 0.13 | 0.009 | ZIP1 (zinc transporter 1) | |||||||||||
| At5g24780 | 0.65 ± 0.57 | 0.431 | 0.43 ± 0.01 | 0.000 | 2.21 ± 0.42 | 0.004 | 1.06 ± 1.02 | 0.918 | 4.00 ± 1.69 | 0.027 | VSP1 (vegetative storage protein1) | |||||||||||
To further evaluate whether the repression of the genes in the mutant was caused by the mutation of STOP1, the expression levels of the 12 shared genes with both treatments were examined in STOP1-KO (T-DNA insertion in STOP1) and with the transgenic mutant carrying normal STOP1 by introducing cauliflower mosaic virus (CaMV) 35S∷STOP1 (Iuchi et al., 2007). Very similar expression profiles were found in the stop1 mutant and STOP1-KO (Fig. 1B). Furthermore, expression of these down-regulated genes recovered in the transgenic mutant carrying normal STOP1 (Fig. 1B). These results indicate that mutation of STOP1 affects the expression of these identified genes.
Function of the Genes Repressed in the stop1 Mutant
The shared gene group, whose members were repressed by both Al and H+ treatments in the stop1 mutant, contained a previously identified gene critical for Al tolerance, AtALMT1 (Hoekenga et al., 2006; Table I), and a homolog of STOP1, encoding a zinc finger protein (referred to here as STOP2). Several genes for transporters (i.e. SULTR3;5 encoding a sulfate transporter 3;5 and PLT3 encoding a probable polyol transporter 3) and regulatory proteins in ion transport (CBL-INTERACTING PROTEIN KINASE23 [CIPK23] regulating AKT1 activity and a homolog of SLT1 [for sodium and lithium tolerant 1] regulating Na+/K+ transport) were identified in this down-regulated gene group. One of major genes for nitrogen metabolism, GLUTAMATE DEHYDROGENASE1 (GDH1), and a gene that might belong to biotic stress defense systems, POLYGALACTURONASE-INHIBITING PROTEIN1 (PGIP1), were also found in the same down-regulated gene group.
The other two gene groups, which were down-regulated by either Al or H+ treatment, contained several genes that are functionally related to the above gene group detected by both treatments (Table I). One of major potassium transporters, HAK5, and major enzymes in nitrogen metabolism (NIA1 [for nitrate reductase] and GDH2) belong to the gene group identified by Al3+ treatment. Different types of malate transporters, namely AtTDT (a vacuolar malate/Na+ cotransporter), a homolog of SLAC1 (for slow anion channel 1), and a malate metabolism enzyme (ME2 encoding a malic enzyme) belong to the gene group identified with Al (AtTDT and ME2) or low pH (SLAC1 homolog) treatment, respectively. These data suggest that mutation of STOP1 modifies ion homeostasis, malate transport, and metabolism in the stop1 mutant.
Down-Regulation of ALS3 in the stop1 Mutant
![Repression of ALS3 in the stop1 mutant and comparison of growth among T-DNA insertion mutants. A, ALS3 expression in the wild type (WT), the stop1 mutant, STOP1-KO, and a complemented line of the stop1 mutant carrying CaMV35S∷STOP1 (stop1-comp), which were grown for 10 d in normal conditions and exposed to Al (10 μ m, pH 5.0) for 24 h. ALS3 expression was normalized by UBQ1 expression and compared with that of the wild type. B and C, Growth response of ALS3-KO compared with that of STOP1-KO and AtALMT1-KO with Al and H+ rhizotoxicities. White bar in B = 1 cm. Different letters indicate significant differences by lsd test (P = 0.05). [See online article for color version of this figure.]](https://oup.silverchair-cdn.com/oup/backfile/Content_public/Journal/plphys/150/1/10.1104_pp.108.134700/2/m_plphys_v150_1_281_f2.jpeg?Expires=1716441518&Signature=P~Jey5HzVtj8haeyLLF3Elj3p28yItVaS09LIjlVX5CP8p6ex8SZDTcHN0ZfiJPjg4a0vxm1YmksluA9Gsj5i7y3Gx3kJTOM4lAdCwnG~WqsrCB-qNsjnO6fDtrChyzriyfvgKB1fM-F8BcWeIBt78sVJC2OhMi4UWApxE7Q3ctNYYFdHVonENJYD4A3rOS7TPBdbrHuXQztYeOU9i3nJa33YKuRu85h6GzKXnR29BrwZI22O4oF6XkfYG36kkkQkTxHAr1bW7lod-nZaxzUEddfpH761YwCTgJ17oNF3rmoMTcPz4DLY3A1E7oBJhiMINe6w0MTo9FhvVXJFWa5wA__&Key-Pair-Id=APKAIE5G5CRDK6RD3PGA)
Repression of ALS3 in the stop1 mutant and comparison of growth among T-DNA insertion mutants. A, ALS3 expression in the wild type (WT), the stop1 mutant, STOP1-KO, and a complemented line of the stop1 mutant carrying CaMV35S∷STOP1 (stop1-comp), which were grown for 10 d in normal conditions and exposed to Al (10 μ m, pH 5.0) for 24 h. ALS3 expression was normalized by UBQ1 expression and compared with that of the wild type. B and C, Growth response of ALS3-KO compared with that of STOP1-KO and AtALMT1-KO with Al and H+ rhizotoxicities. White bar in B = 1 cm. Different letters indicate significant differences by lsd test (P = 0.05). [See online article for color version of this figure.]
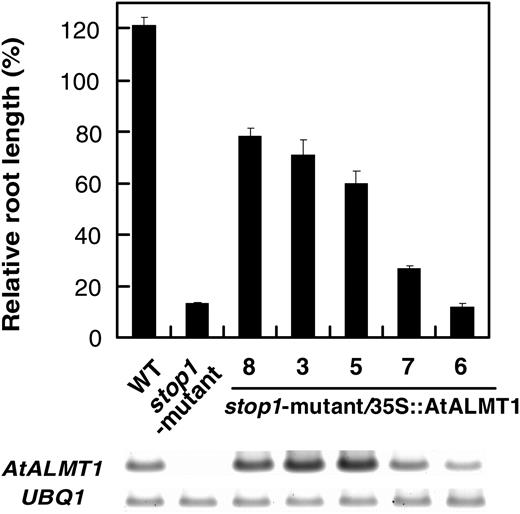
Root growth of the wild type (WT), the stop1 mutant, and a transgenic stop1 mutant carrying CaMV35S∷AtALMT1. Seedlings were grown hydroponically in Al toxic solution containing 2 μ m Al at pH 5.5. Culture solution was renewed every 2 d, and relative root length (percentage of the root growth in the absence of Al) was determined at 7 d. Gel image of semiquantitative RT-PCR of AtALMT1 and UBQ1 transcripts of each line is shown at the bottom. Means ± se are shown (n = 3).
Growth of the STOP1-KO and Al-Sensitive KO Mutants in Soil Culture
![A, Growth of ALS3-KO, AtALMT1-KO, and STOP1-KO in neutral forest brown soil (bottom) and acidic andosol (top). Seedlings were grown for 4 weeks on both soil types. Acidic andosol was neutralized by adding various amounts of CaCO3. Soil pH and amount of exchangeable Al were determined. WT, wild type. White bar = 1 cm. B, Fresh weight of the shoots plotted as means ± se (n > 4). Different letters indicate significant differences at P = 0.05 by lsd test. [See online article for color version of this figure.]](https://oup.silverchair-cdn.com/oup/backfile/Content_public/Journal/plphys/150/1/10.1104_pp.108.134700/2/m_plphys_v150_1_281_f4.jpeg?Expires=1716441518&Signature=YGtWT7rxkJ1zO-y-Hmcf6ySOgLAFHNq~n5cxOnuy4qIwubrCBAf88ApLkOkFb3N57ambTRZn~F6K0h8VTb3hzE0~vGCisJt8RKMk8QnQFd6lWAEY0OrKWc9rW3a2BuFkCyA6uYP8JjRqYt7aLd05DCiAm2-nAP-DpZLcO9qMnieEF0lAsXn-~aTnZlmppUK3rJI2ytEp2rmhf13TUKxbPniNEyuNxmNRtCfAyk1FfRLboqiZOfTYEUhY4h5Jgurq9TWL3vbwMnbhO~Dqqtp4qFcDqDGgp84lSjLmEH-C3jwZRehgsjuq-bGKr6jm9cz3QYkDy8suchtba2hqfQv8XA__&Key-Pair-Id=APKAIE5G5CRDK6RD3PGA)
A, Growth of ALS3-KO, AtALMT1-KO, and STOP1-KO in neutral forest brown soil (bottom) and acidic andosol (top). Seedlings were grown for 4 weeks on both soil types. Acidic andosol was neutralized by adding various amounts of CaCO3. Soil pH and amount of exchangeable Al were determined. WT, wild type. White bar = 1 cm. B, Fresh weight of the shoots plotted as means ± se (n > 4). Different letters indicate significant differences at P = 0.05 by lsd test. [See online article for color version of this figure.]
Effect of the stop1 Mutation on Metabolic Pathways Related to pH Regulation
AtTDT, which encodes a vacuolar malate transporter that is involved in the pH regulation process in Arabidopsis, was identified as a significantly down-regulated gene after Al treatment in the stop1 mutant. However, the gene was not greatly down-regulated in the low-pH treatment; thus, the gene may not solely account for the H+ hypersensitivity of the stop1 mutant. This suggested that other genes cooperatively affect the H+ hypersensitivity of the mutant. One possible mechanism that could explain H+ hypersensitivity is the block of pH-regulating metabolic pathways, because some of the genes (e.g. GDH in the GABA shunt [Bouche and Fromm, 2004] and malic enzyme in the biochemical pH stat [Sakano, 1998]) were found in the significantly down-regulated genes group in the stop1 mutant (Table I).
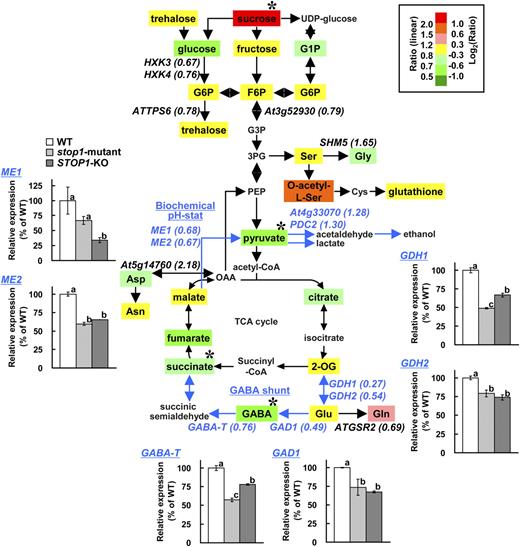
Comparison of metabolites and transcripts in glycolysis, tricarboxylic acid (TCA) cycle, and pH-regulating pathways between the wild type (WT) and the stop1 mutant. Seedlings of the wild type and the stop1 mutant were grown for 10 d in stress-free control conditions, then transferred to low-pH (pH 4.5) solution and incubated for 24 h. The transcriptomes of the stop1 mutant and the wild type on the pathway (222 genes in Supplemental Table S3) were compared, while the metabolomes were compared between STOP1-KO and the wild type. Determined metabolites are shown in colored boxes, and the ratio of STOP1-KO to the wild type is indicated by color as shown at top right. Among the genes with intensities greater than 1,000, relatively more down-regulated (stop1 mutant/wild type < 0.8) or up-regulated (stop1 mutant/wild type > 1.25) genes than others are indicated in italics with the means of FC in parentheses (Supplemental Table S3). Asterisks show significant difference from FC = 1 (t test, P < 0.05). Transcript levels of selected genes in the wild type, the stop1 mutant, and STOP1-KO at pH 4.5 for 24 h are shown in small panels. Different letters in the small panels indicate significant differences by lsd test (P = 0.05). GABA shunt and biochemical pH stat pathways are emphasized by blue color.
Under these conditions, some metabolites in the pathway were significantly changed in the STOP1-KO mutant. A total of 24 metabolites were detected by our analyses, and four metabolites were significantly altered in the STOP1-KO mutant (Fig. 5; Supplemental Table S2). The amounts of GABA and succinate, which belonged to the GABA shunt pathway, were significantly lower in the KO mutant. In addition, products of malic enzymes of the pH stat pathway were also significantly lower in the mutant. These results indicated that pH-regulating pathways are down-regulated by the stop1 mutant. On the other hand, Suc concentration was significantly increased in the stop1 mutant, suggesting that dysfunction of STOP1 also affects Suc availability in the roots. This was accompanied by the repression of several homologs of hexokinase (HXK3 and HXK4).
Intracellular Localization of the STOP1 Protein
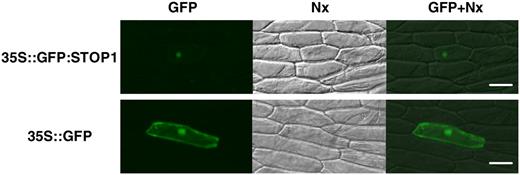
Localization of the GFP∷STOP1 protein that was transiently expressed in onion epidermis cells. Vectors containing CaMV35S∷GFP:STOP1 (top) or CaMV35S∷GFP (bottom) were introduced by particle bombardment. Fluorescence images (left) and bright-field images (middle) are merged at right. Bars = 100 μm.
DISCUSSION
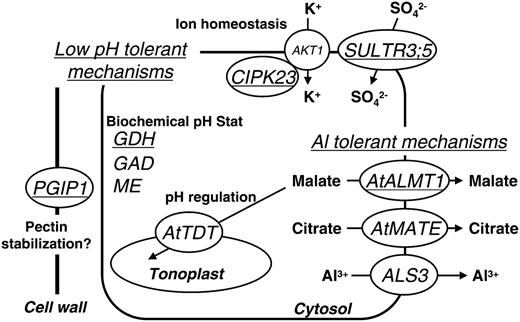
Schematic representation of regulating genes by STOP1 in relation to low pH and Al tolerance. Major genes identified as down-regulated in the stop1 mutant are shown with possible functions in low pH and Al stress tolerance. Except for AKT1, other genes were down-regulated in the stop1 mutant. AtMATE was reported by Liu et al. (2009). Underlined genes were greatly down-regulated in the stop1 mutant with both low-pH and Al treatments (Table I).
AtALMT1-KO and ALS3-KO were not sensitive to H+ rhizotoxicity; therefore, other genes down-regulated in the stop1 mutant should function as the tolerant system for H+ rhizotoxicity. DNA microarray analyses (e.g. a comparative array with the stop1 mutant and the wild type) followed by semiquantitative RT-PCR analyses with STOP1-KO and the transgenic complemented line (i.e. the stop1 mutant carrying CaMV 35S-driven STOP1) revealed that various genes for ion homeostasis and pH regulation are coregulated by STOP1 (Fig. 7). For example, AtTDT, encoding a tonoplast dicarboxylate transporter (a kind of malate transporter), was identified as one of the down-regulated genes in the stop1 mutant. A T-DNA insertion in this gene impaired pH regulation in the cytosol; thus, the gene was annotated as the gene for pH homeostasis in Arabidopsis (Hurth et al., 2005). Although the gene was not greatly repressed in the stop1 mutant with low-pH treatment (FC = 0.75), it may partly explain the H+ hypersensitivity of the stop1 mutant. Several genes that are critical for pH tolerance in other organisms were also down-regulated in the stop1 mutant. For example, K+ transport and homeostasis are identified as major pH-regulating mechanisms in various organisms (Zhang and Kone, 2002). Repression of CIPK23, encoding the regulatory kinase of the major K+ transporter AKT1 (Lee et al., 2007), might have an effect on pH regulation in the stop1 mutant via reduced AKT1 activity. Other transporters relating to SO4 and NO3 could also contribute to pH regulation in plants. The addition of K2SO4 improved root growth of maize (Zea mays) in a low-pH medium (Yan et al., 1992), while high K+ supply also blocked cytosolic acidification in Al-treated wheat root (Lindberg and Strid, 1997). On the other hand, addition of NO3 alleviated acidosis of maize under anoxia (Libourel et al., 2006). Taken together, these data suggest that down-regulation of genes involved in ion homeostasis and transport may cause the proton-sensitive phenotype of the stop1 mutant. This possibility is supported by a recent study of one of the K+ transporters in Arabidopsis. Overexpression of a cation:proton antiporter, CHX13, slightly improved growth at low pH (pH 4.3 and 5.6; Zhao et al., 2008) in K+-limited conditions, suggesting that K+ homeostasis in Arabidopsis is linked to H+ sensitivity.
Dysfunction of STOP1 affected other mechanisms, which were predicted to be members of the pH homeostasis process in plant cells, namely pH-regulating metabolic pathways. One part of the pH stat pathway consists of malic enzyme, pyruvate decarboxylase, and alcohol dehydrogenase (or lactate dehydrogenase) and can consume H+ (Roberts et al., 1992; Sakano, 1998). The other pH stat pathway, called the GABA shunt, consists of GDH, GAD, and GABA-T; it also contributes to regulating H+ in the cytosol (Bown and Shelp, 1997). The GABA shunt is enhanced by hypoxia and by other stresses that cause acidosis of the cytosol (Crawford et al., 1994). Our results suggested that these pH-regulating pathways were down-regulated in the stop1 mutant (Fig. 5). Major isoforms of these pathways, GDH1 and GDH2, GAD1, GABA-T, and ME1 and ME2, were repressed in the stop1 mutant (Table I; Fig. 5). Although one GAD isoform, GAD4, was up-regulated in the stop1 mutant (Supplemental Table S3), a smaller contribution of GAD4 expression than that of GAD1 on total GAD activity was estimated by a recent study (Miyashita and Good, 2008). In addition, expression levels of the isoforms of the other down-regulated genes were quite similar between the wild type and the stop1 mutant, indicating that these pathways were down-regulated in the stop1 mutant. This might affect the H+ sensitivity of the stop1 mutant. Interestingly, orthologs of these genes have been identified as critical for adaptation to acidic environments in other organisms (Castanie-Cornet et al., 1999). For E. coli, GAD is essential for surviving in low-pH medium (Yohannes et al., 2004). These genes, which are down-regulated in the stop1 mutant, could be involved in low-pH-tolerant mechanisms in Arabidopsis.
It is possible that other genes regulated by STOP1 might have a function in low-pH tolerance, even if the genes have been previously characterized in different biological events but not identified as H+-resistant genes. For example, one of the down-regulated genes in the stop1 mutant, PGIP1, has been well characterized as a protein involved in defense systems for pathogen infection. Rudrappa et al. (2008) recently reported that foliar infection of a pathogenic bacterium induces AtALMT1 expression and recruits a beneficial bacterium in the rhizosphere. This suggests that STOP1 is a pleiotropic gene that belongs to defense systems for both biotic and abiotic stressors; thus, it regulates PGIP1 expression. However, PGIP1 also has a potential role in H+ tolerance, according to its function in the root cell wall. The protein binds to the polygalacturonic acid region of pectin, forming a structure termed the “egg box” (Spadoni et al., 2006). This structure is essential for connecting pectin chains by covalent linkage (O'Neill et al., 2004), and its weakening by low-pH conditions is involved in a part of the H+ rhizotoxicity of Arabidopsis growing roots (Koyama et al., 2001). Although the role of PGIP1 for H+ tolerance has been not clarified yet, a functionally similar protein stabilizing the cell wall has been identified as part of the low-pH-tolerant mechanisms in yeast. A protein carrying Man moieties, CWP2 (for cell wall 2), is essential in H+ tolerance of yeast because it can stabilize the cell wall at low pH (Skrzypek et al., 1997). Interestingly, PGIP1 inhibits polygalacturonase of the pathogen at neutral pH due to stabilizing substrate (i.e. pectin), while its synthesis is enhanced by low-pH treatment (Spadoni et al., 2006). In addition, a homolog of PGIP1, namely PGIP2, was also identified in the gene group significantly repressed in the stop1 mutant, but it was rejected during quality control of the scanned data (Supplemental Table S4). Further research will be required for evaluating the contribution of these PGIP proteins in proton tolerance in Arabidopsis roots. Overall, the genes significantly repressed in the stop1 mutant consisted of various genes that were functionally identified as the genes for pH tolerance or pH homeostasis in plants and other organisms. Although experimental evidence in plant research is limited, the combination of altered ion transport and carbon and nitrogen (CN) metabolism seems to be common in other organisms adapting to a low-pH environment. For example, fish adapted to a low-pH environment show altered transport of potassium/sodium/hydrogen and CN metabolism (Hirata et al., 2003), while a bacterium surviving around pH 0 has more copies of genes encoding ion transporters and enzymes in CN metabolism than other bacteria adapting to neutral pH (Fütterer et al., 2004). Further research on the genes regulated by STOP1 might clarify the complex pH-tolerant systems in higher plants.
A series of regulatory proteins (e.g. protein kinases and transcriptional regulators) were down-regulated in the stop1 mutant, including one of the two homologs of STOP1 existing in the Arabidopsis genome, designated STOP2. STOP2 carries a very similar Cys-2-Hys-2 zinc finger domain to STOP1 (Iuchi et al., 2007). Although STOP2's function has not yet been clarified, it may coregulate the expression of several genes with STOP1, similar to other zinc finger transcription factors. For example, a zinc finger transcription factor protein, DOF1 (At1g51700), with its homolog DOF2, regulates the expression in root tissue (Yanagisawa, 2000) of genes encoding enzymes for amino acid and carbohydrate metabolism (e.g. PEP and PPDK; Yanagisawa et al., 2004). Characterization of STOP2's role will raise important issues in understanding gene expression pathways regulated by STOP1. On the other hand, down-regulation of genes in the stop1 mutant by H+ also occurred by Al treatment. This suggests that both stressors induce the same “signal” to trigger gene expression. One possible explanation is the induction of acidification of the cytosol by H+ and Al, which was identified in Arabidopsis using pH-sensitive GFP. Al treatment additively acidified cytosolic pH of the Arabidopsis roots under low-pH treatment (Moseyko and Feldman, 2001). The inhibition of plasma membrane H+-ATPase(s) by Al was reported in some plant species (Ahn et al., 2001), which can also acidify the cytosolic pH. Further research on these issues will clarify the molecular mechanism of the activation process of genes regulated by STOP1 under Al treatment.
The stop1 mutant grew poorly on acid soil compared with AtALMT1-KO, while Al tolerance levels, judged by hydroponic culture, were very similar (Fig. 2, B and C; see Figure 6A in Iuchi et al., 2007). This indicates that H+ sensitivity affects the growth of the stop1 mutant on acid soil. This could be supported by a previous growth experiment that used natural accessions of Arabidopsis. When natural accessions were grown on the same acid soil, growth was correlated with their H+ tolerance if their Al tolerance was similar (Ikka et al., 2007). This indicates that H+ tolerance is one of the factors critical for determining the growth of Arabidopsis in acid soil. Further research on the genes regulated by STOP1 for H+ tolerance (Fig. 7) might contribute to improving H+ tolerance of other crop plants by transgenic breeding or by establishing marker-assisted selection with comparative genomics approaches for the ortholog of STOP1, which have been identified in other plant species, such as rice and maize (Iuchi et al., 2007).
MATERIALS AND METHODS
Arabidopsis Accessions
The stop1 mutant of Arabidopsis (Arabidopsis thaliana) was derived from an ethyl methanesulfonate-mutagenized F2 population of ecotype Col-0 in a previous study (Iuchi et al., 2007). SALK T-DNA insertion mutants, AtALMT1-KO (SALK_009629), STOP1-KO (SALK_114108), and ALS3-KO (SALK_061074), were derived from the Arabidopsis Biological Resource Center. Col-0 (JA58) and Col-4 (N933) were obtained from RIKEN BioResource Center and Nottingham Arabidopsis Stock Centre, respectively. Complementation lines of STOP1 carrying CaMV35S∷STOP1 in the stop1 mutant were identical to those used in a previous study (Iuchi et al., 2007).
Transient Expression of the Synthetic GFP Protein in Onion Epidermal Cells
The synthetic GFP (sGFP) carrying optimized codon usage for plant systems (Chiu et al., 1996) was fused with the N terminus of STOP1 by connecting PCR-amplified fragments derived from pBE2113 (containing sGFP) and RAFL (the RIKEN full-length cDNA clone [RAFL09-20I22; Seki et al., 2002] containing STOP1) using the following primers: SfiI-GFP (5′-CATTTGGCCAAATCGGCCATGGTGAGCAAGGGCGAGGAGCTG-3′), GFP-NotI (5′-GGATTAGCGGCCGCCCTTGTACAGCTCGTCCATGCCGTGAG-3′), NotI-STOP1 (5′-ACAAGGGCGGCCGCATGGAAACTGAAGACGATTTGTGCAAC-3′), and STOP1-SfiI (5′-ACAAGGGCGGCCGCATGGAAACTGAAGACGATTTGTGCAAC-3′). The PCR fragments of sGFP and STOP1 were digested with SfiI and NotI and cloned into the SfiI site of the pBI2113SF vector. The accuracy of the sequence was confirmed by DNA sequencing analysis. The DNA constructs were introduced into onion (Allium cepa) epidermal cells, as described previously, by particle bombardment (Fujita et al., 2004). After incubation at 22°C for 12 h, GFP fluorescence was observed as described previously (Fujita et al., 2004).
Transgenic Complementation of AtALMT1 in the stop1 Mutant
The DNA fragment of AtALMT1 was amplified by PCR using Arabidopsis genomic DNA and the primers Forward (5′-CATTTGGCCAAATCGGCCATGGAGAAAGTGAGAGAGATAGTGAGAGAAG-3′) and Reverse (5′-AGAACGGCCTTATGGCCTTACTGAAGATGCCCATTACTTAATG-3′) and was inserted downstream of the CaMV 35S promoter of the binary vector pBE2113SF (Liu et al., 1998). The binary construct was then introduced into stop1 mutant plants by the floral dip method (Clough and Bent, 1998). The transformants in the T2 generation were obtained by controlled self-pollination of T1 plants.
RNA and Metabolite Extraction from Root Samples
Seedlings were precultured for 10 d in 2% MGRL nutrient with 200 μ m CaCl2 at pH 5.6 hydroponically as described by Toda et al. (1999). Solutions were renewed every 2 d, and seedlings were kept in a controlled environment (30 μmol quanta m−2 s−1, 12-h day/night cycle, 25°C). After the preculture, seedlings were transferred to Al3+ toxic solution (pH 5.0, 10 μ m Al) and H+ toxic solution (pH 4.5), which were prepared as described previously (Iuchi et al., 2007). The seedlings were kept under continuous light, and the roots were harvested at 24 h after the transfer. The roots were excised with scissors, immediately frozen in liquid N2, and kept at −80°C until use. RNA was isolated from the root samples and quantified according to Suzuki et al. (2004). For microarray analysis, the quality of the RNA was evaluated using the Agilent 2100 Bioanalyzer. Metabolites for gas chromatography-mass spectrometry (GC-MS) and capillary electrophoresis (CE)-MS analyses were extracted from the root samples in 50% ethanol using the Qiagen Mixer Mill MM300 kit. Samples were then pretreated by N-methyl-N-(trimethylsilyl)-trifluoroacetamide for GC-time of flight (TOF)-MS or separated into the cationic and anionic fractions for CE-MS as described by Urano et al. (2009).
Microarray Analyses and Data Mining
Microarray analyses were carried out using the Agilent microarray system (Arabidopsis version 3) according to the manufacturer's protocol. Competitive hybridization analyses (Cy3-labeled versus Cy5-labeled copy RNA samples) were performed between control (24 h, no Al at pH 5.0) and rhizotoxin-treated (24 h in pH 4.5 solution or 10 μ m Al solution at pH 5.0) samples of Col-4, and comparisons were made between Col-0 and the stop1 mutant in both treatments. Al and H+ tolerance of Col-0 and Col-4 were very similar (Ikka et al., 2007). Copy RNA synthesis and dye labeling were performed with a kit (Low RNA Input Linear Amplification Kit PLUS; Agilent). All comparisons were carried out three times using biologically independent samples, including one dye-flip treatment. Microarray scanner G2565BA (Agilent) equipped with Feature Extraction version 9.5.1 software (Agilent) was used for scanning of the slides and extracting the data. Data mining and statistical analyses for microarray data were performed using GeneSpring GX version 7.3.1 (Agilent). As a quality control of microarray data, the spot feature data were examined with GeneSpring using default settings for the quality control that indicate “flags” to data with lower quality (e.g. low intensity, not uniform, abnormal in the background; http://www.chem.agilent.com/cag/bsp/products/gsgx/downloads/pdf/FE_Plugin.pdf). If the genes had flagged two or more data in any treatment (i.e. FC of the wild type in Al and low-pH treatments, or comparisons between the stop1 mutant and the wild type), they were not used for the data mining. Significantly down-regulated genes in the stop1 mutant with Al and H+ treatments were defined as genes that carried FC (stop1 mutant/wild type) values that were in the lowest 1% among all detected data.
Profiling of Metabolites
GC-TOF-MS analysis was performed with the Agilent 6890 GC system connected to a LECO Pegasus III mass spectrometer (Agilent), while CE-MS analyses were performed using the Agilent CE system in conjunction with an Agilent 1100 series MSD mass spectrometer. Anion detection by CE-MS followed the methods described by Urano et al. (2009), while GC-TOF-MS detection was carried out according to Urano et al. (2009). Detected peaks were assigned to known compounds (e.g. organic acids, amino acids, etc.) by theoretical M r or by direct comparison with standard compounds. The intensity of each peak was recorded, and the values were normalized to the fresh weight base. Three independent analyses were carried out for all samples, and statistical analyses were carried out using Excel. Relative values (i.e. ratio of normalized peaks of STOP1-KO/wild type, pH 4.5) of metabolites were integrated on the metabolic pathway map. Raw data are available in Supplemental Table S3.
RT-PCR and Quantitative RT-PCR
RT-PCR was carried out as described previously (Kobayashi et al., 2007), and quantitative RT-PCR analyses were carried out using a real-time PCR system (Applied Biosystems 7300) following the manufacturer's protocol. Transcripts were relatively quantified using UBQ1 transcripts as a control and then compared to that of the wild type. Primer sequences and PCR conditions are shown in Supplemental Table S5.
Hydroponic Culture and Growth Test
Growth experiments in hydroponic culture were carried out as described previously (Iuchi et al., 2007). The longest three root length values from 10 seedlings were used for evaluating root growth of the wild type and KO mutants. On the other hand, those from 20 seedlings were used for complemented lines carrying CaMV35S∷AtALMT1 in the stop1 mutant.
Soil Culture and Soil Analyses
Seedlings were grown on acidic andosol containing large amounts of organic matter and phytotoxic Al (Kawatabi andosol was obtained from the Kawatabi Experimental Farm at Tohoku University). Forest brawn soil (neutral pH and no toxic level of Al) was obtained from Zao in the northern part of Japan. The properties of these soils are well characterized and used in physiological experiments for Al and proton toxicities (Ikka et al., 2007). The soil was fertilized with both macronutrients and micronutrients as described previously (Kobayashi et al., 2005). Kawatabi soil was neutralized by adding CaCO3 (60, 250, and 400 mg per 100 g of dry soil). The soil pH (water) was measured according to the method of Shoji et al. (1964). Exchangeable Al was quantified by the method described by Koyama et al. (2000).
Microarray data are available through the ArrayExpress database (http://www.ebi.ac.uk/microarray-as/ae/) with accession code E-MEXP-1908.
Supplemental Data
The following materials are available in the online version of this article.
Supplemental Figure S1. Comparison of expression levels of known Al-tolerant genes in the stop1 mutant compared with the wild type by competitive microarray.
Supplemental Table S1. List of down-regulated genes in the stop1 mutant among down-regulated genes in the wild type under Al and low-pH conditions.
Supplemental Table S2. Metabolite profile of major carbohydrate metabolic pathways (Fig. 5) of STOP1-KO relative to those determined for the wild type under low-pH conditions.
Supplemental Table S3. Relative expression levels of significantly down-regulated genes in the stop1 mutant among genes involved in major carbohydrate metabolic pathways (Fig. 5) and those of isoforms involved in pH-regulating pathways.
Supplemental Table S4. List of genes rejected during quality control of microarray data analysis, which might contain genes greatly down-regulated in the stop1 mutant under Al and low-pH conditions.
Supplemental Table S5. Primer sequences used for quantitative RT-PCR of the markedly down-regulated genes of the stop1 mutant.
ACKNOWLEDGMENTS
We thank the BioResource Center of RIKEN, the Arabidopsis Biological Resource Center, and the Nottingham Arabidopsis Stock Centre for providing Arabidopsis seeds.
LITERATURE CITED
Hirata T, Kaneko T, Ono T, Nakazato T, Furukawa N, Hasegawa S, Wakabayashi S, Shigekawa M, Chang MH, Romero MF, et al (
Hoekenga OA, Maron LG, Pineros MA, Cancado GM, Shaff J, Kobayashi Y, Ryan PR, Dong B, Delhaize E, Sasaki T, et al (
Ikka T, Kobayashi Y, Tazib T, Koyama H (
Kinraide TB (
Kobayashi Y, Furuta Y, Ohno T, Hara T, Koyama H (
Koyama H, Toda T, Hara T (
Koyama H, Toda T, Yotoka S, Dawair Z, Hara T (
Larsen PB, Geisler MJ, Jones CA, Williams KM, Cancel JD (
Lindberg SL, Strid H (
Liu Q, Kasuga M, Sakuma Y, Abe H, Miura S, Yamaguchi-Shinozaki K, Shinozaki K (
Neumann G, Massonneau A, Martinoia E, Römheld V (
Rangel AF, Mobin M, Rao IM, Horst WJ (
Sakano K (
Shoji S, Miyake M, Takeuchi Y (
Watanabe T, Okada K (
Yokota S, Ojima K (
Zhang W, Kone BC (
Author notes
This work was supported by the Ministry of Economy, Technology, and Industry of Japan (grants to D.S. and H.K.) and the Japan Society for the Promotion of Science (grants to S.I. and H.K.).
These authors contributed equally to the article.
Corresponding author; e-mail koyama@gifu-u.ac.jp.
The author responsible for distribution of materials integral to the findings presented in this article in accordance with the policy described in the Instructions for Authors (www.plantphysiol.org) is: Hiroyuki Koyama (koyama@gifu-u.ac.jp).
Some figures in this article are displayed in color online but in black and white in the print edition.
The online version of this article contains Web-only data.
Open Access articles can be viewed online without a subscription.
