


Abstract
Prenatal arsenic exposure has been associated with reduced thymic index and increased morbidity in infants, indicating arsenic-related impaired immune function. We aimed at elucidating potential effects of pre- and postnatal arsenic exposure on cell-mediated immune function in pre-school aged children. Children born in a prospective mother-child cohort in rural Bangladesh were followed up at 4.5 years of age (n = 577). Arsenic exposure was assessed by concentrations of arsenic metabolites (U-As) in child urine and maternal urine during pregnancy, using high-performance liquid chromatography online with inductively coupled plasma mass spectrometry. For assessment of delayed type hypersensitivity response, an intradermal injection of purified protein derivative (PPD) was given to Bacillus Calmette-Guerin vaccinated children. The diameter (mm) of induration was measured after 48–72 h. Plasma concentrations of 27 cytokines were analyzed by a multiplex cytokine assay. Children's concurrent, but not prenatal, arsenic exposure was associated with a weaker response to the injected PPD. The risk ratio (RR) of not responding to PPD (induration <5 mm) was 1.37 (95% confidence interval (CI): 1.07, 1.74) in children in the highest quartile of U-As (range 126–1228 μg/l), compared with the lowest (range 12–34 μg/l). The p for trend across the quartiles was 0.003. The association was stronger in undernourished children. Children's U-As in tertiles was inversely associated with two out of 27 cytokines only, i.e., IL-2 and TNF-α, both Th1 cytokines (in the highest tertile, regression coefficients (95% CI): −1.57 (−2.56, −0.57) and −4.53 (−8.62, −0.42), respectively), but not with Th2 cytokines. These associations were particularly strong in children with recent infections. In conclusion, elevated childhood arsenic exposure appeared to reduce cell-mediated immunity, possibly linked to reduced concentrations of Th1 cytokines.
Exposure to inorganic arsenic, a well-established carcinogen, through drinking water and certain foods is a major public health problem worldwide. There is increasing evidence that chronic exposure to arsenic, even at fairly low exposure levels, also leads to increased risk of infectious diseases, particularly lower respiratory tract infections, bronchiectasis, tuberculosis, and diarrhea (Farzan et al., 2013; Rahman et al., 2011; Raqib et al., 2009; Smith et al., 2006, 2011, 2013). These are likely due to arsenic-related alterations of the immune function, particularly in the form of immunosuppression. In a cross-sectional study involving 6–10 years old Mexican children, urinary arsenic concentrations were associated with reduced proliferation of peripheral blood mononuclear cells in response to phytohemaglutinin, low numbers of CD4+ cells, and reduced secretion of IL-2 (Soto-Pena et al., 2006). Similarly, urinary arsenic concentrations were inversely associated with the number of T cells and T-regulatory cells, as well as the mitogen-specific proliferative response of T cells in adults (Biswas et al., 2008; Hernandez-Castro et al., 2009). Taken together, these studies suggest that arsenic may alter both the function and the number of T cells, which are of vital importance for cell-mediated immunity. Arsenic exposure may also impair the maturation, differentiation, and phagocytic function of macrophages, which also have a crucial role in cellular immunity (Banerjee et al., 2009; Lemarie et al., 2006).
In recent years it has become increasingly clear that the developing immune system in early life is particularly sensitive to toxic insult and other stressors (DeWitt et al., 2012). We have previously shown that maternal arsenic exposure during pregnancy is associated with reduced number of placental CD3+ T cells, as well as decreased thymic size and function in infants in rural Bangladesh (Ahmed et al., 2010, 2012; Moore et al., 2009; Raqib et al., 2009). In the present study, we have followed up this cohort of children at 4.5 years of age, with the aim to evaluate the potential effects of both pre- and postnatal arsenic exposure on cell-mediated immune function. We measured the delayed type hypersensitivity (DTH) response as a functional measure of cell-mediated immunity and the concentrations of cytokines in plasma.
MATERIALS AND METHODS
Study area
The study was carried out in Matlab, a rural area 53 km southeast of Dhaka, the capital of Bangladesh. In this area, with a population of about 220,000, the International Centre for Diarrhoeal Disease Research, Bangladesh (icddr,b) has been operating a Health and Demographic Surveillance System since 1966. Community health research workers record all vital events, such as deaths, in- and out migration, marriages, pregnancies, and pregnancy outcomes, at regular monthly home visits to the families in the area. More than 95% of the population use tube-well water as their drinking water (Wu et al., 2011). Screening of arsenic in all the functioning tube wells showed a wide range of concentrations, with 30% having arsenic concentrations above 200 μg/l (Rahman et al., 2006; Vahter et al., 2006).
Study design and participants
The present study is part of an ongoing research program concerning effects of arsenic exposure on pregnancy outcomes and child health and development. The study was nested into a randomized, community-based food and micronutrient supplementation trial—the Maternal and Infant Nutrition Interventions, Matlab (“MINIMat”) trial (ISRCTN16581394) (Persson et al., 2012). Women who were identified as pregnant before 14 weeks of gestation from November 2001 to October 2003 were invited to participate in the trial (Persson et al., 2012). The enrolled women (N = 4436) were randomly assigned to one of two food supplementations (early or usual), as well as one of three different micronutrient supplementations: (1) 30 mg iron and 400 μg folic acid, (2) 60 mg iron and 400 μg folic acid, or (3) the UNICEF/WHO/UNU preparation of 15 different micronutrients (Persson et al., 2012).
In total, 2735 of the MINIMat children were followed up at 4.5 years of age for a range of assessments. To reduce the burden of examinations for each child, the children were divided into two groups on the basis of their year of birth (Group A, April 2002 to June 2003; Group B, June 2003 to June 2004). Studies concerning immune function were conducted in Group B (N = 1303) from December 2007 to February 2009. The present study assessing arsenic exposure and immune response included 640 of those children (born in June 2003 to June 2004) with available urine and blood samples (Fig. 1). Parents of 63 children refused to let their children have the purified protein derivative (PPD); thus 577 children participated in the PPD skin test. Out of the 577 studied children, only 181 children had enough plasma left (after other analyses) to enable cytokine analysis.
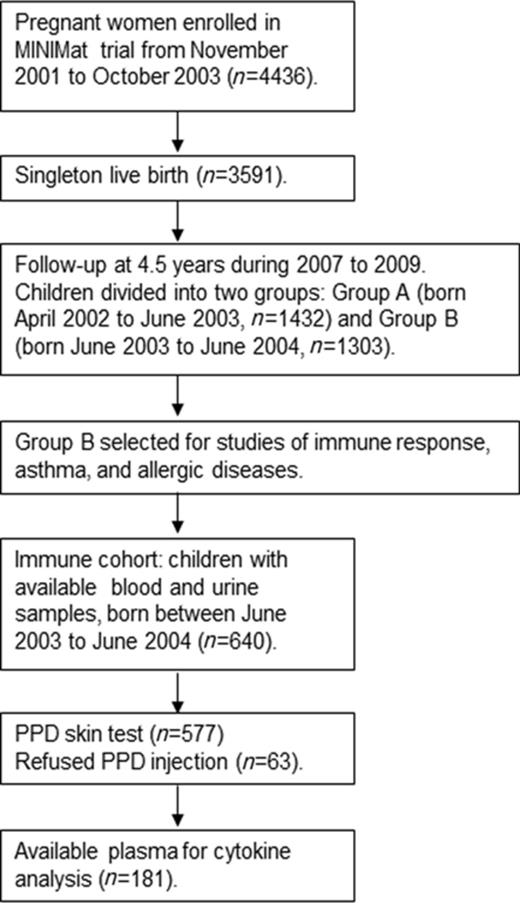
Flow diagram describing the recruitment of children in the current study nested in the MINIMat follow-up study in rural Bangladesh carried out in 2007–2009.
The study was approved by the Ethical Review Committee at icbbr,b, Bangladesh, and the Regional Ethics Committee at Karolinska Institutet, Sweden. Written informed consent was obtained from the legal guardian of each child prior to participation in the study.
Measurements of arsenic exposure
We assessed arsenic exposure by the sum concentration of inorganic arsenic (iAs) and its methylated metabolites (methylarsonic acid (MMA) and dimethylarsinic acid (DMA)) in urine, hereafter referred to as urinary arsenic (U-As). This measure reflects ongoing exposure to inorganic arsenic from all sources, i.e., both drinking water and food (Vahter et al., 2006).
Maternal urine was collected in early pregnancy (on average in GW8) as described previously (Vahter et al., 2006). At 4.5 years of age, a spot urine sample was collected at the health clinics into a metal-free plastic cup from which urine was transferred to a 24-ml trace elements free polyethylene bottle (Gardner et al., 2011). All samples were kept cold until transferred, by the end of the day at the latest, to the Matlab hospital laboratory where they were stored at −70°C. The urine samples were transported frozen to Karolinska Institutet, Sweden, for the analysis of urinary arsenic.
The arsenic metabolite concentrations in maternal and child urine were measured using high-performance liquid chromatography online with hydride generation and inductively coupled plasma mass spectrometry (HPLC-HG-ICPMS) as described previously (Gardner et al., 2011). All the measured arsenic concentrations in maternal urine and child urine were above the limit of detection (LOD) (<1 ug/l). The intra- and inter-assay coefficients of variation were 4% and 3%, respectively, based on the measurements of quality control material (human urine sample; CRM No.18, National Institute for Environmental Studies, Tsukuba City, Japan). For quality control purposes, we analyzed a reference urine sample (CRM No.18, National Institute for Environmental Studies, Tsukuba City, Japan) together with the urine samples collected from the mothers and their children. The certified reference value of DMA was 36 ± 9 μg/l (mean ± SD) and our obtained DMA concentration of the reference material was 43 ± 1.7 μg/l when it was analyzed together with the mother's urine samples and 42 ± 1.2 μg/l when it was analyzed together with the children's urine samples. We also measured total arsenic in child urine using ICPMS (m/z75; helium mode) after 10-fold dilution by 1% nitric acid (65% Suprapur, Merck, Darmstadt, Germany), and found an excellent agreement between total arsenic concentrations measured by ICPMS and the sum metabolite concentrations measured by HPLC-HG-ICPMS (R2 = 0.993). This may be used for quality control purposes as the intake of seafood, which often contains elevated concentrations of organic arsenic compounds, is minimal in the study area.
Urinary arsenic concentrations were adjusted to the average specific gravity, measured by a digital refractometer (RD712 Clinical Refractometer; EUROMEX, Arnhem, the Netherlands), to compensate for variation in dilution (Nermell et al., 2008). The average specific gravity of both maternal urine samples and those of the children at 4.5 years was 1.012 g/ml. Adjustment by specific gravity has been shown to be less affected by body size, age, gender, and season, compared with the more commonly used creatinine adjustment (Nermell et al., 2008).
DTH
To evaluate potential immunotoxicity of environmental chemicals functional immune tests, such as DTH, is a front-line priority as adapted by National Toxicology Program (Dietert et al., 2010). Testing of the DTH response is a standard method for assessing intact functional cell-mediated immunity (Dietert et al., 2010; Janeway et al., 2001; Vukmanovic-Stejic et al., 2006). A DTH reaction in the skin is initiated when antigens are presented by antigen-presenting cells to sensitized memory T cells. The antigen presentation and the subsequent T cell activation complex elicit an influx of macrophages, monocytes, and lymphocytes, which release cytokines such as tumor necrosis factor-α (TNF-α), IL-2, IL-17A, and interferon-gamma (IFN-γ). These cytokines stimulate further influx of immune cells at the site of antigen exposure (Janeway et al., 2001).
All children in the present study had been vaccinated with Bacillus Calmette-Guerin (BCG), on average at 9 weeks of age (range 3–40 weeks), in line with the national vaccination program. To assess the recall cell-mediated immune response at 4.5 years of age, the children were given an intradermal injection of PPD (0.1 ml standard PPD containing 0.5 μg/ml, equivalent to 25 tuberculin units/ml) (Japan BCG laboratory, Tokyo, Japan) into the middle part of the volar surface of the left forearm. Two study physicians were trained for the standardized procedures according to the manufacturer's instructions. In brief, the injection was performed with a tuberculin syringe, with the needle bevel facing upward. A pale elevation in the skin with 6–10 mm in diameter while injecting was considered confirmation of proper injection. After 48–72 h, the study physicians, who were blinded about the children's arsenic exposure, measured the maximum diameters of the induration of the skin (reaction size) in two perpendicular directions using a ruler with millimeter marks. The average of the two measures was calculated. An induration size of <5 mm was defined as a negative test (not responding) and ≥5 mm was defined as a positive test (responding) (Siripassorn et al., 2006; Vukmanovic-Stejic et al., 2006).
Plasma cytokines
Venous blood samples were collected into Lithium-Heparin treated trace element free tubes (Sarstedt Monovette, Uppsala, Sweden) at the health clinics just before the PPD skin test. Samples were kept cold and transported within 4 h to the Matlab hospital laboratory, where plasma was immediately separated and thereafter stored at −70ºC until transported frozen to Karolinska Institutet, Sweden, for the analysis of cytokines. Plasma cytokines were measured by BioPlex multiplex bead-based assay (Bio-Rad) system (Bio-Plex Pro Human cytokine 27-plex Panel) using a Bio-Plex 200 reader (BioRad Laboratories, Hercules, CA), according to the manufacturer's instructions. The following cytokines were analyzed: interleukin (IL)-1β, interleukin-1 receptor agonist (IL-1ra), IL-2, IL-4, IL-5, IL-6, IL-7, IL-8, IL-9, IL-10, IL-12 (p70), IL-13, IL-15, IL-17A, basic fibroblast growth factor, eotaxin, granulocyte colony-stimulating factor (G-CSF), granulocyte macrophage colony-stimulating factor (GM-CSF), IFN-γ, interferon gamma-induced protein 10 (IP-10), monocyte chemotactic protein-1 (MCP-1), macrophage inflammatory protein (MIP)-1α, MIP-1β, platelet-derived growth factor (PDGF)-BB, RANTES (regulated on activation, normal T cell expressed and secreted), TNF-α, and vascular endothelial growth factor (VEGF). The intra- and inter-assay coefficients of variation for these cytokines ranged between 1.0–10.0 and 3.5–12.5%, respectively. The LOD was <1 pg/ml for most of the cytokines (Supplementary Data). For cytokine measurements with values below LOD, particularly for IL-2 (10% of the samples below LOD), the LOD divided by the square root of 2 was used.
Covariates
Data on maternal anthropometry, parity, and morbidity during pregnancy, as well as socioeconomic status (SES) of the families were collected in early pregnancy at the enrollment in the MINIMat trial (Persson et al., 2012). The SES of the families was also appraised during the follow-up of MINIMat children at 4.5 years of age. SES was estimated via an asset score, generated through principal component analysis of household assets (Gwatkin et al., 2000). In the statistical analysis, we used continuous SES that was measured during the follow-up. At 4.5 years of age, body weight was recorded to the nearest 0.1 kg with a digital scale (TANITA HD - 318, Tanita Corporation, Japan) with the child in light clothing and bare feet. The digital scale was regularly calibrated with a standard weight of 20 kg. Height was measured using a free standing stadiometer Leicester Height Measure with millimeter marks (Seca 214, UK). The measured weight and height were converted to weight-for-age (WAZ), height-for-age (HAZ), and weight-for-height (WHZ) Z-scores (standard deviation (SD) scores), using to the WHO Multicentre Growth Reference Study child growth standards (WHO, 2006). Underweight was defined as WAZ <−2 (below minus two SD from median weight for age of reference population), stunting as HAZ <-2 (below minus two SD from median height for age of reference population), and wasting was defined as WHZ <-2 (below minus two SD from median weight for height of reference population). Information on child morbidity (2 weeks recall) was collected by the community health research workers during the monthly home visits. The questionnaire included specific morbidity questions concerning diarrhea (three or more liquid stools in 24 h or stools mixed with blood) and acute respiratory illness (in terms of cold and cough, or difficult breathing with concomitant fever).
Statistical analysis
Statistical analyses were conducted using the software PASW 22.0 (SPSS Inc., Chicago) and Stata/IC, version 12.0 (StataCorp, TX). Data distribution patterns were evaluated using scatter plots, and normality and homogeneity of variances were formally checked by descriptive statistics. Associations between exposures (maternal U-As concentrations at GW8 and child U-As concentrations at 4.5 years of age), outcomes (DTH in terms of induration size and concentrations of cytokines), and covariates (mother's age and body mass index (BMI) in early pregnancy, birth weight, children's height, weight, HAZ, WAZ, SES, gender, diarrhea, and acute respiratory infections) were evaluated using Spearman's rank correlation coefficients (for continuous variables), Mann-Whitney U test or analysis of variance (ANOVA) or Kruskal-Wallis test (for categorical variables), as appropriate.
To evaluate the arsenic-associated risk of not responding to the PPD injection (induration <5 mm), we applied multivariable-adjusted log-binomial regression. Because the association between U-As and induration size was not linear, we categorized the U-As into quartiles. Lowest quartile was used as the reference. Trends across the categories were tested using the median arsenic concentration within categories as a continuous variable. Associations of arsenic exposure with different plasma cytokines were evaluated using multivariable-adjusted linear regression analyses. Because the associations between children's U-As and plasma cytokines were not linear, we categorized the U-As into tertiles. Lowest tertile was used as the reference. We adjusted for the covariates that were significantly associated with the outcome and exposure, and if the covariates changed the effect estimates by 5% or more. Children's age (significantly associated with outcome), SES (significantly associated with exposure and non-significantly associated with outcome), and gender (biologically relevant) were used as covariates in the final model. We additionally adjusted the studied associations for randomization (two food groups and three micronutrient supplementation groups).
Because nutritional status could influence the immune function of the children, we stratified the multivariable-adjusted models by SES (median split) and anthropometric data (underweight/normal weight). We also stratified by gender and infections (diarrhea and/or acute respiratory infections, yes/no).
RESULTS
As presented in Table 1, the studied 577 children included in the PPD study did not differ from the rest of the children in group B (n = 663) or from the children who refused to take the PPD injection (n = 63), or from the children who were included in the cytokines analyses (N = 181) with regard to the basic characteristics (height, weight, and morbidity). However, the percentage of stunting was lower (28.6%) in the studied children compared with the rest of the children in group B (34.5%). The median U-As concentration was similar in the studied children and the children who refused to take PPD injection. Maternal U-As seems to be higher in the children who refused to take PPD injection compared with the studied children. Children U-As seems to be higher in the children with cytokine measures compared with the studied children (Table 1).
Baseline Characteristics of the 577 Children in the Present Study and the Children Who Refused to Take the PPD Injection, As Well As Children Who Were Included in the Cytokine Analysis, and the Rest of the Children Who Were Enrolled in the MINIMat Follow-up Study from December 2007 through February 2009
| Characteristicsa | Studied children (n = 577) | Children refused to take PPD injection (n = 63) | Children included in cytokine analysis (n = 181) | Not studied children (n = 663) |
|---|---|---|---|---|
| Age (years) | 4.58 ± 0.11* | 4.68 ± 0.15* | 4.54± 0.08 | 4.56 ± 0.12 |
| Boys, n (%) | 298 (52) | 29 (45) | 93 (51) | 341 (51) |
| Height (cm) | 100.0 ± 4.0 | 100.6 ± 3.7 | 99.9± 4.2 | 99.59 ± 4.3 |
| HAZ | −1.55 ± 0.86 | −1.55 ± 0.75 | −1.52 ± 0.91 | −1.61 ± 0.93 |
| Stunted, n (%)b | 165 (28.6)* | 18 (28.1) | 48 (27) | 225 (34.5)* |
| Weight (kg) | 13.9 ± 1.6 | 14.0 ± 1.4 | 13.9 ± 1.6 | 13.8 ± 1.6 |
| WAZ | −1.76 ± 0.84 | −1.73 ± 0.73 | −1.73 ± 0.84 | −1.79 ± 0.86 |
| Underweight, n (%)b | 226 (39.2) | 23 (36.0) | 67 (37) | 270 (40.8) |
| Diarrhea, n (%)c | 87 (15.1) | 7 (11.0) | 25(14) | 82 (12.4) |
| Acute respiratory infection, n (%)c | 248 (43.0) | 24 (37.0) | 70 (39) | 286 (43.1) |
| Children U-As (μg/l)d | 57 (21, 393) | 59 (20, 328) | 71 (21, 393) | |
| Maternal U-As (μg/l)d | 77 (21, 692) | 111 (20, 580) | 69 (18, 557) |
Note: MINIMat, Maternal and Infant Nutrition Interventions in Matlab; PPD, purified protein derivative; U-As, sum concentration of urinary arsenic metabolites; HAZ, height-for-age z-score; WAZ, weight-for-age z-score.
aValues are shown as mean ± SD, median (5–95 percentiles), or n (%).
bDefined as children with HAZ or WAZ <-2 SD from the median value of height or weight for age of reference population.
cInformation based on 2 weeks recall.
dAdjusted to average specific gravity of 1.012 g/ml.
*Indicates significant difference between groups (p values were calculated on the basis of Mann-Whitney or Chi-Square tests as appropriate).
| Characteristicsa | Studied children (n = 577) | Children refused to take PPD injection (n = 63) | Children included in cytokine analysis (n = 181) | Not studied children (n = 663) |
|---|---|---|---|---|
| Age (years) | 4.58 ± 0.11* | 4.68 ± 0.15* | 4.54± 0.08 | 4.56 ± 0.12 |
| Boys, n (%) | 298 (52) | 29 (45) | 93 (51) | 341 (51) |
| Height (cm) | 100.0 ± 4.0 | 100.6 ± 3.7 | 99.9± 4.2 | 99.59 ± 4.3 |
| HAZ | −1.55 ± 0.86 | −1.55 ± 0.75 | −1.52 ± 0.91 | −1.61 ± 0.93 |
| Stunted, n (%)b | 165 (28.6)* | 18 (28.1) | 48 (27) | 225 (34.5)* |
| Weight (kg) | 13.9 ± 1.6 | 14.0 ± 1.4 | 13.9 ± 1.6 | 13.8 ± 1.6 |
| WAZ | −1.76 ± 0.84 | −1.73 ± 0.73 | −1.73 ± 0.84 | −1.79 ± 0.86 |
| Underweight, n (%)b | 226 (39.2) | 23 (36.0) | 67 (37) | 270 (40.8) |
| Diarrhea, n (%)c | 87 (15.1) | 7 (11.0) | 25(14) | 82 (12.4) |
| Acute respiratory infection, n (%)c | 248 (43.0) | 24 (37.0) | 70 (39) | 286 (43.1) |
| Children U-As (μg/l)d | 57 (21, 393) | 59 (20, 328) | 71 (21, 393) | |
| Maternal U-As (μg/l)d | 77 (21, 692) | 111 (20, 580) | 69 (18, 557) |
Note: MINIMat, Maternal and Infant Nutrition Interventions in Matlab; PPD, purified protein derivative; U-As, sum concentration of urinary arsenic metabolites; HAZ, height-for-age z-score; WAZ, weight-for-age z-score.
aValues are shown as mean ± SD, median (5–95 percentiles), or n (%).
bDefined as children with HAZ or WAZ <-2 SD from the median value of height or weight for age of reference population.
cInformation based on 2 weeks recall.
dAdjusted to average specific gravity of 1.012 g/ml.
*Indicates significant difference between groups (p values were calculated on the basis of Mann-Whitney or Chi-Square tests as appropriate).
The mean age of the 577 children (52% boys) included in the present study was 4 years and 7 months (range 54–61 months). The mean weight and height of the children were 13.9 kg and 100 cm, respectively (Table 1). Compared with WHO reference standards, about 26% of the boys and 33% of the girls were stunted, 36% of the boys and 43% of the girls were underweight, and 17% of the boys and 18% of the girls were wasted. About 43% of the children had experienced acute respiratory infections and 15% of the children had experienced diarrhea during the past 2 weeks. Almost half of the children had recent infections (diarrhea and/or acute respiratory infections).
The median U-As concentration was 77 μg/l (range 2–2064 μg/l) in the mothers at GW8 (hereafter referred to as the children's prenatal exposure) and 57 μg/l (range 12–1228 μg/l) at 4.5 years of age (concurrent exposure) (Table 1). The U-As did not differ between boys and girls (median in boys 55 μg/l; girls 57 μg/l, p = 0.12). The median U-As concentration was higher in children with recent infections (60 μg/l) compared with those with no infections (50 μg/l, p = 0.01).
The average induration size of the PPD skin test was 5.3 mm (median 5 mm), and it did not differ between boys (5.2 mm) and girls (5.4 mm; p = 0.28). The induration size was larger in children with recent infections (5.49 mm) compared with those with no infections (5.16 mm, p = 0.08). On the basis of the induration size, 46% of the children (48% of the boys and 44% of the girls) were classified as not responding to the PPD (induration <5 mm) (Table 2). Only 5% of the children had an induration size ≥10 mm. They were referred to clinical evaluation, but all of those children were found to be tuberculosis negative.
The Children's Basic Characteristics, Injected PPD Response, and Plasma Cytokine Concentrations in Relation to Quartiles of Their Urinary Arsenic Concentrations at 4.5 Years of Age (n = 577)
| Variablesa | Quartiles of U-As in children at 4.5 years of age | p valuec | |||
|---|---|---|---|---|---|
| 12–34 μg/lb | 35–57 μg/lb | 58–125 μg/lb | 126–1,228 μg/lb | ||
| Age (months) | 55 ± 1.2 | 55 ± 1.4 | 55 ± 1.3 | 55 ± 1.1 | 0.33 |
| Height (cm) | 100 ± 4.3 | 100 ± 4.1 | 100 ± 3.9 | 99.6 ± 3.6 | 0.78 |
| HAZ | −1.52 ± 0.96 | −1.54 ± 0.87 | −1.56 ± 0.81 | −1.59 ± 0.78 | 0.91 |
| Stunted, n (%)d | 40 (28) | 42 (29) | 39 (27) | 44 (31) | 0.92 |
| Weight (kg) | 13.9 ± 1.6 | 13.8 ± 1.5 | 13.9 ± 1.7 | 13.7 ± 1.4 | 0.61 |
| WAZ | −1.71 ± 0.88 | −1.77 ± 0.84 | −1.77 ± 0.85 | −1.80 ± 0.78 | 0.83 |
| Underweight, n (%)d | 59 (41) | 57 (40) | 55 (39) | 55 (38) | 0.97 |
| Diarrhea, n (%)e | 14 (10) | 25 (17) | 24 (17) | 24 (17) | 0.21 |
| Acute respiratory infections, n (%)e | 88 (61) | 84 (58) | 89 (62) | 92 (64) | 0.87 |
| Induration size (mm) | 5.6 ± 2.4 | 5.3 ± 1.9 | 5.3 ± 2.4 | 5.0 ± 2.3 | 0.32 |
| Non-responding (<5 mm), n (%) | 59 (41) | 61 (42) | 64 (44) | 80(56) | 0.04 |
| Maternal U-As at GW8 (μg/l)b | 42 (17, 518) | 57 (22, 574) | 79 (18, 635) | 241 (32, 951) | <0.001 |
| Plasma cytokines (n = 181) | |||||
| IL-2 (pg/ml) | 1.6 (0.24, 12.15) | 2.3 (0.24, 9.78) | 2.0 (0.24, 7.37) | 0.24 (0.24, 6.61) | 0.01 |
| TNF-α (pg/ml) | 22 (10, 53) | 24 (12, 46) | 22 (14, 51) | 20 (11, 36) | 0.15 |
Note: U-As, sum concentration of urinary arsenic metabolites; HAZ, height-for-age z-score; WAZ, weight-for-age z-score; PPD, purified protein derivative; IL-2, interleukin 2; TNF-α, tumor necrosis factor-α.
aValues are shown as mean ± SD, median (5–95 percentiles), or n (%).
bAdjusted to average specific gravity of 1.012 g/ml.
cp values were calculated on the basis of ANOVA or Chi-Square or Kruskal-Wallis tests as appropriate.
dDefined as children with HAZ or WAZ <-2 SDs from the median value of height or weight for age of reference population.
eInformation based on 2 weeks recall.
| Variablesa | Quartiles of U-As in children at 4.5 years of age | p valuec | |||
|---|---|---|---|---|---|
| 12–34 μg/lb | 35–57 μg/lb | 58–125 μg/lb | 126–1,228 μg/lb | ||
| Age (months) | 55 ± 1.2 | 55 ± 1.4 | 55 ± 1.3 | 55 ± 1.1 | 0.33 |
| Height (cm) | 100 ± 4.3 | 100 ± 4.1 | 100 ± 3.9 | 99.6 ± 3.6 | 0.78 |
| HAZ | −1.52 ± 0.96 | −1.54 ± 0.87 | −1.56 ± 0.81 | −1.59 ± 0.78 | 0.91 |
| Stunted, n (%)d | 40 (28) | 42 (29) | 39 (27) | 44 (31) | 0.92 |
| Weight (kg) | 13.9 ± 1.6 | 13.8 ± 1.5 | 13.9 ± 1.7 | 13.7 ± 1.4 | 0.61 |
| WAZ | −1.71 ± 0.88 | −1.77 ± 0.84 | −1.77 ± 0.85 | −1.80 ± 0.78 | 0.83 |
| Underweight, n (%)d | 59 (41) | 57 (40) | 55 (39) | 55 (38) | 0.97 |
| Diarrhea, n (%)e | 14 (10) | 25 (17) | 24 (17) | 24 (17) | 0.21 |
| Acute respiratory infections, n (%)e | 88 (61) | 84 (58) | 89 (62) | 92 (64) | 0.87 |
| Induration size (mm) | 5.6 ± 2.4 | 5.3 ± 1.9 | 5.3 ± 2.4 | 5.0 ± 2.3 | 0.32 |
| Non-responding (<5 mm), n (%) | 59 (41) | 61 (42) | 64 (44) | 80(56) | 0.04 |
| Maternal U-As at GW8 (μg/l)b | 42 (17, 518) | 57 (22, 574) | 79 (18, 635) | 241 (32, 951) | <0.001 |
| Plasma cytokines (n = 181) | |||||
| IL-2 (pg/ml) | 1.6 (0.24, 12.15) | 2.3 (0.24, 9.78) | 2.0 (0.24, 7.37) | 0.24 (0.24, 6.61) | 0.01 |
| TNF-α (pg/ml) | 22 (10, 53) | 24 (12, 46) | 22 (14, 51) | 20 (11, 36) | 0.15 |
Note: U-As, sum concentration of urinary arsenic metabolites; HAZ, height-for-age z-score; WAZ, weight-for-age z-score; PPD, purified protein derivative; IL-2, interleukin 2; TNF-α, tumor necrosis factor-α.
aValues are shown as mean ± SD, median (5–95 percentiles), or n (%).
bAdjusted to average specific gravity of 1.012 g/ml.
cp values were calculated on the basis of ANOVA or Chi-Square or Kruskal-Wallis tests as appropriate.
dDefined as children with HAZ or WAZ <-2 SDs from the median value of height or weight for age of reference population.
eInformation based on 2 weeks recall.
Arsenic Exposure and DTH
The percentage of non-responders (induration <5 mm) increased with increasing children's U-As (Table 2). In the log-binomial regression analysis, we found a significant positive association between the children's U-As in quartiles and the risk ratios (RRs) of not responding to the PPD in the crude model (p for trend = 0.003; Table 3). Adjustment for relevant covariates did not change the RRs (Table 3). Children in the highest quartile of U-As (median 232 μg/l, range 126–1228 μg/l) were more likely to lack a PPD response (RR = 1.37, 95% confidence interval (CI): 1.07, 1.74), compared with the children in the lowest quartile (median 27 μg/l, range 12–34 μg/l). The percentage of not responding to PPD also increased with increasing prenatal exposure (Table 3), but the association was not statistically significant (p for trend 0.092). Including both exposures into the same model (Table 3) showed that the concurrent arsenic exposure, but not the prenatal, was associated with increased risk of not responding to the PPD (RR = 1.37, 95% CI: 1.02, 1.79; p for trend 0.02). To explore the combined effect of the children's prenatal and concurrent arsenic exposure further, we dichotomized both exposures (median split) and then combined the exposures into four groups (low prenatal and low concurrent exposure; high prenatal and low concurrent exposure; low prenatal and high concurrent exposure; and high prenatal and high concurrent exposure) (Supplementary Data). The increased risk of not responding to the PPD was mainly related to the children's arsenic exposure, irrespective of the prenatal exposure. Therefore, we focused on the children's concurrent exposure in the subsequent analyses.
Log-binomial Regression Analysis of the Associations Between Urinary Arsenic Concentrations (μg/l) in Quartiles (Children's Urinary Arsenic Concentrations and the Mothers’ Urinary Arsenic Concentrations at GW8) and Not Responding to the Injected PPD (Induration <5 mm) in Children at 4.5 Years of Age
| Quartiles of U-As; range (median) | All children | ||
|---|---|---|---|
| Cases (non-responders) | Crude RR (95% CI) | Adjusted RR (95% CI)a | |
| U-As at 4.5 years of age (μg/l) (n = 577) | |||
| 12–34 (27), reference | 59 | 1.00 | 1.00 |
| 35–57 (44) | 61 | 1.04 (0.79, 1.37) | 1.03 (0.79, 1.36) |
| 58–125 (84) | 64 | 1.09 (0.84, 1.43) | 1.10 (0.84, 1.43) |
| 126–1228 (232) | 80 | 1.37 (1.07, 1.74) | 1.37 (1.07, 1.74) |
| p for trend | 0.003 | 0.003 | |
| U-As at GW8 (μg/l) (n = 560) | |||
| 2–38 (27), reference | 56 | 1.00 | 1.00 |
| 39–77 (51) | 65 | 1.16 (0.89, 1.52) | 1.15 (0.88, 1.51) |
| 78–211 (128) | 65 | 1.16 (0.89, 1.52) | 1.15 (0.88, 1.51) |
| 212–2064 (418) | 71 | 1.26 (0.98, 1.64) | 1.28 (0.99, 1.67) |
| p for trend | 0.129 | 0.092 | |
| Combined exposure (n = 560)b | |||
| U-As at 4.5 years of age (μg/l) | |||
| 12–34 (27), reference | 55 | 1.00 | 1.00 |
| 35–57 (44) | 61 | 1.09 (0.83, 1.44) | 1.08 (0.82, 1.43) |
| 58–125 (84) | 63 | 1.12 (0.85, 1.48) | 1.12 (0.85, 1.48) |
| 126–1228 (232) | 78 | 1.36 (1.03, 1.80) | 1.36 (1.03, 1.79) |
| p for trend | 0.018 | 0.019 | |
| U-As at GW8 (μg/l) | |||
| 2–38 (27), reference | 56 | 1.00 | 1.00 |
| 39–77 (51) | 65 | 1.13 (0.86, 1.48) | 1.12 (0.85, 1.47) |
| 78–211 (128) | 65 | 1.06 (0.80, 1.41) | 1.06 (0.79, 1.40) |
| 212–2064 (418) | 71 | 1.10 (0.82, 1.47) | 1.11 (0.83, 1.49) |
| p for trend | 0.789 | 0.678 | |
Note: U-As, sum of urinary arsenic metabolites; RR, relative risk; CI, confidence interval; GW, gestational week.
aAdjusted for age, gender, and SES.
bU-As concentrations at 4.5 years of age and GW8 entered in the same model.
| Quartiles of U-As; range (median) | All children | ||
|---|---|---|---|
| Cases (non-responders) | Crude RR (95% CI) | Adjusted RR (95% CI)a | |
| U-As at 4.5 years of age (μg/l) (n = 577) | |||
| 12–34 (27), reference | 59 | 1.00 | 1.00 |
| 35–57 (44) | 61 | 1.04 (0.79, 1.37) | 1.03 (0.79, 1.36) |
| 58–125 (84) | 64 | 1.09 (0.84, 1.43) | 1.10 (0.84, 1.43) |
| 126–1228 (232) | 80 | 1.37 (1.07, 1.74) | 1.37 (1.07, 1.74) |
| p for trend | 0.003 | 0.003 | |
| U-As at GW8 (μg/l) (n = 560) | |||
| 2–38 (27), reference | 56 | 1.00 | 1.00 |
| 39–77 (51) | 65 | 1.16 (0.89, 1.52) | 1.15 (0.88, 1.51) |
| 78–211 (128) | 65 | 1.16 (0.89, 1.52) | 1.15 (0.88, 1.51) |
| 212–2064 (418) | 71 | 1.26 (0.98, 1.64) | 1.28 (0.99, 1.67) |
| p for trend | 0.129 | 0.092 | |
| Combined exposure (n = 560)b | |||
| U-As at 4.5 years of age (μg/l) | |||
| 12–34 (27), reference | 55 | 1.00 | 1.00 |
| 35–57 (44) | 61 | 1.09 (0.83, 1.44) | 1.08 (0.82, 1.43) |
| 58–125 (84) | 63 | 1.12 (0.85, 1.48) | 1.12 (0.85, 1.48) |
| 126–1228 (232) | 78 | 1.36 (1.03, 1.80) | 1.36 (1.03, 1.79) |
| p for trend | 0.018 | 0.019 | |
| U-As at GW8 (μg/l) | |||
| 2–38 (27), reference | 56 | 1.00 | 1.00 |
| 39–77 (51) | 65 | 1.13 (0.86, 1.48) | 1.12 (0.85, 1.47) |
| 78–211 (128) | 65 | 1.06 (0.80, 1.41) | 1.06 (0.79, 1.40) |
| 212–2064 (418) | 71 | 1.10 (0.82, 1.47) | 1.11 (0.83, 1.49) |
| p for trend | 0.789 | 0.678 | |
Note: U-As, sum of urinary arsenic metabolites; RR, relative risk; CI, confidence interval; GW, gestational week.
aAdjusted for age, gender, and SES.
bU-As concentrations at 4.5 years of age and GW8 entered in the same model.
To evaluate the role of the food and micronutrient supplementation ingested by the mothers during pregnancy, we additionally adjusted the full model for the six different groups of supplementation, but that did not change the risk estimates more than 2% (data not shown).
When stratifying the analysis by gender (Fig. 2A), the adjusted RR of not responding to the PPD was similar in boys and girls, although statistically significant only in the girls (Fig. 2A). In underweight children, the adjusted RRs were 1.61 (95% CI: 1.07, 2.44) and 1.72 (95% CI: 1.15, 2.59) in the third and fourth quartiles of urinary arsenic, respectively, compared with the first (p for trend 0.005) (Fig. 2B). No significant association was observed in the children of normal weight (Fig. 2B). Similarly, when stratifying the analysis by SES (median split), the adjusted RRs for the children in low SES families were 1.83 (95% CI: 1.18, 2.86) and 2.06 (95% CI: 1.35, 3.15) in the third and fourth quartiles of urinary arsenic, respectively, compared with the first (p for trend 0.001), whereas no significant association was observed in children in high SES families (Fig. 2C). We additionally stratified the associations by recent infections. In children with recent infections the adjusted RR was 1.55 (95% CI: 1.04, 2.32) in the fourth quartile of U-As compared with the first (p for trend 0.015), whereas no significant association was observed in children without infections (Fig. 2D).
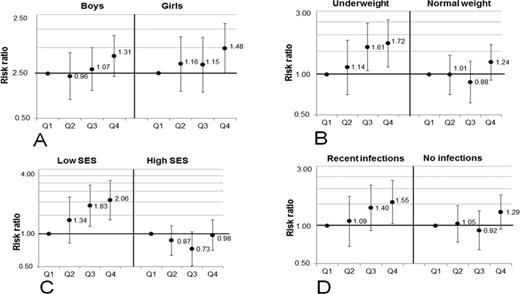
RRs, with 95% CI, for not responding to the PPD skin test (induration size <5 mm) in relation to quartiles of urinary arsenic concentrations in children at 4.5 years of age. The children were stratified by gender (A), nutritional status (B), SES (C), and their recent infections (D). The associations were adjusted for age, gender (except stratified by gender), and SES. Q1, first quartile (12–34 μg/l); Q2, second quartile (35–57 μg/l); Q3, third quartile (58–125 μg/l); and Q4, fourth quartile (126–1228 μg/l).
Arsenic Exposure and Cytokines
A total of 27 cytokines were measured in children's plasma. The concentrations of IL-15 and GM-CSF were below the LOD (7 pg/ml and 1pg/ml) in 90% and 75% of the plasma samples, respectively, and were therefore excluded from further analyses. Out of the remaining 25 cytokines, only two (IL-2 and TNF-α) were associated with arsenic exposure. Descriptive statistics of all 25 cytokines are presented in Supplementary Data. When we compared plasma cytokines levels across quartiles of children's U-As, we observed significantly lower plasma IL-2 concentrations and non-significantly lower TNF-α concentrations in the highest quartiles of U-As compared with all the lower quartiles (Table 2). Non-significantly higher levels of IL-2 and TNF-α were observed in children with infections (2.6 pg/ml and 26.2 pg/ml, respectively) compared with those with no infections (2.1 pg/ml and 23.2 pg/ml, respectively).
In the multi-variable adjusted linear regression analyses, we found significant inverse associations between the children's arsenic exposure in tertiles and the plasma cytokines of IL-2 and TNF-α (Table 4). The associations were stronger in the highest tertile of U-As compared with the lowest (β = −1.57 (95% CI: −2.56, −0.57) and β = −4.53 (95%CI: −8.62, −0.42), respectively (Table 4)). The p for trend across the tertiles was 0.002 for IL-2 and 0.02 for TNF-α. Levels of IL-12 tended to decrease with increasing arsenic exposure, but the association was not statistically significant (Table 4). As Th2 cytokines were not influenced by arsenic, there were the Th1/Th2 cytokine ratios (IL-2/IL-4, IL-2/IL-10, IL-2/IL-13, and TNF-α/IL-4) decreased with increasing U-As (Table 4).
Multivariable-adjusted Linear Regression Analysis of the Associations Between Children's Urinary Arsenic Concentrations (μg/l) in Tertiles and Plasma Cytokines (pg/ml) in Children at 4.5 Years of Age
| Cytokines (pg/ml) | Tertiles of U-As (μg/l); range (median) | ||
|---|---|---|---|
| 12–44 (28), reference | 45–106 (71) | 107–1228 (203) | |
| β (95% CI)a | β (95% CI)a | β (95% CI)a | |
| IL-2 (pg/ml) | 0 | −0.54 (−1.52, 0.43) | −1.57 (−2.56, −0.57) |
| TNF-α (pg/ml) | 0 | −0.65 (−4.64, 3.34) | −4.53 (−8.62, −0.42) |
| IL-12 (pg/ml) | 0 | −5.21 (−12.31, 1.89) | −5.16 (−12.51, 2.19) |
| IL-2/IL-4 | 0 | −.17 (−0.43, 0.08) | −0.44 (−0.71, −0.17) |
| IL-2/IL-10 | 0 | −.08 (−0.20, 0.05) | −0.15 (−0.28, −0.02) |
| IL-2/IL-13 | 0 | −.03 (−0.12, 0.06) | −0.11 (−0.19, −0.01) |
| TNF-α/IL-4 | 0 | −.52 (−1.46, 0.43) | −1.03 (−2.01, −0.06) |
| TNF-α/IL-10 | 0 | −0.91 (−2.54, 0.73) | −1.16 (−2.84, 0.54) |
| TNF-α/IL-13 | 0 | −0.06 (−0.56, 0.44) | −0.43 (−0.94, 0.08) |
Note: U-As, sum of urinary arsenic metabolites; β, regression co-efficient; CI, confidence interval; IL-2, interleukin 2; TNF-α, tumor necrosis factor-α; IL-12, interleukin 12; IL-4, interleukin 4; IL-10, interleukin 10; IL-13, interleukin 13.
aAdjusted for age, gender, and SES.
| Cytokines (pg/ml) | Tertiles of U-As (μg/l); range (median) | ||
|---|---|---|---|
| 12–44 (28), reference | 45–106 (71) | 107–1228 (203) | |
| β (95% CI)a | β (95% CI)a | β (95% CI)a | |
| IL-2 (pg/ml) | 0 | −0.54 (−1.52, 0.43) | −1.57 (−2.56, −0.57) |
| TNF-α (pg/ml) | 0 | −0.65 (−4.64, 3.34) | −4.53 (−8.62, −0.42) |
| IL-12 (pg/ml) | 0 | −5.21 (−12.31, 1.89) | −5.16 (−12.51, 2.19) |
| IL-2/IL-4 | 0 | −.17 (−0.43, 0.08) | −0.44 (−0.71, −0.17) |
| IL-2/IL-10 | 0 | −.08 (−0.20, 0.05) | −0.15 (−0.28, −0.02) |
| IL-2/IL-13 | 0 | −.03 (−0.12, 0.06) | −0.11 (−0.19, −0.01) |
| TNF-α/IL-4 | 0 | −.52 (−1.46, 0.43) | −1.03 (−2.01, −0.06) |
| TNF-α/IL-10 | 0 | −0.91 (−2.54, 0.73) | −1.16 (−2.84, 0.54) |
| TNF-α/IL-13 | 0 | −0.06 (−0.56, 0.44) | −0.43 (−0.94, 0.08) |
Note: U-As, sum of urinary arsenic metabolites; β, regression co-efficient; CI, confidence interval; IL-2, interleukin 2; TNF-α, tumor necrosis factor-α; IL-12, interleukin 12; IL-4, interleukin 4; IL-10, interleukin 10; IL-13, interleukin 13.
aAdjusted for age, gender, and SES.
We additionally adjusted the associations between children's arsenic exposure and the different cytokines for the six different groups of supplementation, but that did not change the estimate more than 3% (data not shown). We did not find any significant associations of children's arsenic exposure with the other cytokines (Supplementary Data). We did not observe any significant associations between prenatal arsenic exposure and plasma cytokines in children at 4.5 years of age (data not shown).
Because plasma cytokines are usually influenced by infections, we compared the associations between arsenic exposure and IL-2 and TNF-α among children with and without recent infections (diarrhea and/or acute respiratory illness). Considerably stronger effects of arsenic on IL-2 and TNF-α were observed in children with infections compared with the healthy children (Fig. 3).
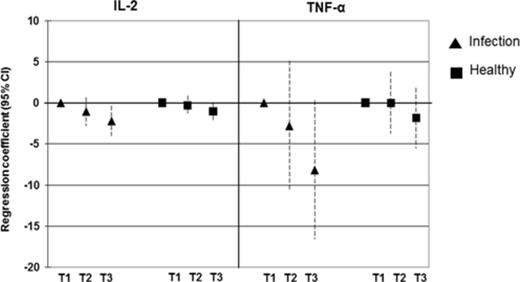
Relationship between children's urinary arsenic concentrations (μg/l) in tertiles and plasma concentrations (pg/ml) of IL-2 and TNF-α. Results are presented as unstandardized regression coefficients and 95% CI. The associations were adjusted for age, gender, and SES. The triangle symbol indicates the group of children with recent infections (diarrhea and/or acute respiratory infections) whereas the square symbol indicates the group of healthy children. T1, first tertile (12–44 μg/l); T2, second tertile (45–106 μg/l); T3, third tertile (107–1228 μg/l).
DISCUSSION
In the present study, we found that the cell-mediated immune function of pre-school aged children decreased with increasing exposure to arsenic, particularly in undernourished children and in children with recent infections. This is an indication of immune suppression, which is likely to reduce the children's ability to fight against both infectious and non-communicable diseases (DeWitt et al., 2012). To our knowledge this is the first report in humans describing impaired cell-mediated immune function in relation to environmental arsenic exposure. Our finding is supported by experimental studies showing that exposure to inorganic arsenic, often at high doses, inversely affects the DTH response in mice, rats, and chickens, as reviewed by Dangleben et al.(2013).
The DTH response against PPD is used clinically to diagnose Mycobacterium tuberculosis infection and to evaluate BCG vaccination response (Burl et al., 2010; Miret-Cuadras et al., 1996). However, DTH assessment using various types of antigens including PPD may also be used to evaluate an individual's cell-mediated immune function (Dietert et al., 2010; Siripassorn et al., 2006; Vukmanovic-Stejic et al., 2006). Most of the previous studies assayed cell-mediated immunity using the Multitest CMI kit (Pasteur Merieux Serums & Vaccines SA, Lyons, France), which is no longer available because of its low potency and the lack of demand (Siripassorn et al., 2006). We chose the PPD as that was one of the antigens in the Multitest CMI kit because all of the children had been vaccinated by BCG during infancy. In the present study, we used PPD according to the Mantoux method to measure DTH response. The DTH response depends on the recruitment of several different leukocyte populations, including T lymphocytes, macrophages, neutrophils, and dendritic cells, to the site of the antigenic challenge (Delves et al., 2011). Immunotoxicants may disrupt the DTH response by impairing any of these functional components.
We observed an increased PPD response in children with recent infections (diarrhea and/or acute respiratory illness). However, this effect decreased markedly with increasing arsenic exposure, indicating that arsenic impaired the immune response to infections. Obviously, such an effect will render the children more susceptible to infections. Indeed, the children with infections had higher urinary arsenic concentrations than those without infections. In the healthy children there was no change in the PPD-response in relation to arsenic exposure. We also observed inverse associations between arsenic exposure and cell-mediated immunity in underweight children and in children from low SES families. Because there was no difference in the PPD response in relation to SES or anthropometric data (WAZ, HAZ), we speculate that the arsenic-related effects on PPD in these sub-groups were mainly driven by higher prevalence of infections. However, the present study did not have the power to test for that.
We previously reported that prenatal arsenic exposure was associated with reduced thymic size and functions in infancy (Ahmed et al., 2012; Raqib et al., 2009). In the present study, we observed the effects of the children's concurrent, but not prenatal, arsenic exposure on the PPD response in the children with recent infections, indicating a continuous arsenic-related immunosuppression due to the persistent exposure (Gardner et al., 2011). Thus, the effect of arsenic in the children was probably on the activation and proliferation of memory T cells, or on the migration of macrophages and other leukocytes to the lymph nodes, rather than on the naive T cells from the thymus.
We found that the children's arsenic exposure was associated with reduced plasma concentrations of Th1 cytokines (IL-2 and TNF-α). Also this effect was restricted to the children with recent infections, which is in line with an arsenic-related immunosuppression. The Th1 cytokines, such as IL-2 and TNF-α, are essential modulators of cell-mediated immune response (O'O’Garra, 1998). IL-2 is mainly involved in T lymphocyte activation, proliferation, and differentiation, whereas TNF-α is mainly involved in activation of macrophages and other leukocytes. Our results are in accordance with previous studies showing that exposure to inorganic arsenic reduced IL-2 and TNF-α secretion in mitogen-stimulated blood mononuclear cells ex vivo (Biswas et al., 2008; Soto-Pena et al., 2006) or in vitro (Morzadec et al., 2012). We did not observe any change in Th2 (IL4, IL5, IL13) cytokines in relation to arsenic exposure. A recent in vitro study showed that inorganic arsenic at low concentrations (75–150 μg/l) reduced secretion of Th1 cytokines (IL-2 and IFN-γ) without altering Th2 response (IL-4 and IL-13) in stimulated human lymphocytes (Morzadec et al., 2012).
The strengths of our study include the prospective design with the use of both prenatal and concurrent arsenic exposure biomarkers, reflecting the exposure to inorganic arsenic from all sources, including water and food. Another strength was the use of DTH assay, an in vivo assay, as a functional measure of cell-mediated immunity. Plasma cytokines are mediators of immune response and here reflected the functional capacity of cellular immunity in children. Cytokines were analyzed using BioPlex multiplex bead-based assay (Bio-Rad) system, which is more sensitive compare with other available techniques, such as ELISA. A limitation of the study was that plasma for cytokine measurements was available from 181 children only and only before the PPD injection. Another limitation of the study was that we did not have the facility (biosafety cabinets or tissue culture hoods, CO2 incubator) in the study area to do sterile cell culture experiments, e.g., lymphocyte proliferation response, antigen stimulation assays to measure cytokines. Another drawback of our study could be a selection bias as the studied children had lower prenatal arsenic exposure compared with the children who had refused to take the PPD injection. Also, the PPD test was performed 4.5 years after the BCG vaccination, over time the memory response could have decreased. This may have increased the probability of getting false negative results. Indeed, arsenic could have affected the memory cells at an earlier age. Another weakness was that we used a single antigen (PPD) for the assessment of cell-mediated immune response. However, it was not feasible from ethical point of view to use multiple injections of single antigen in the children.
In conclusion, the concurrent arsenic exposure appeared to reduce cell-mediated immunity and Th1cytokines in the studied pre-school children in rural Bangladesh, without altering Th2 cytokines. Considering the persistent exposure to arsenic via drinking water and food (Gardner et al., 2011), the found arsenic induced immunosuppression implies an additional cause of susceptibility to infections and other chronic diseases, besides the prevalent malnutrition.
FUNDING
The Swedish Research Council; the Swedish International Development Cooperation Agency (Sida); the U.K. Medical Research Council; the European Commission [PHIME (Public health impact of long-term, low-level mixed element exposure in susceptible population strata)]; University of Tsukuba, Karolinska Institutet; and the core donors of the International Centre for Diarrhoeal Disease Research, Bangladesh (icddr,b). Icddr,b acknowledges with gratitude the commitment of Sida, the European Commission (PHIME), U.K. Medical Research Council, University of Tsukuba and Karolinska Institutet to it's research efforts. The MINIMat supplementation trial was funded by ICDDR,B, UNICEF, Sida, Swedish Research Council, the European Commission (PHIME), DFID, Japan Society for the Promotion of Science (JSPS), Child Health and Nutrition Research Initiative (CHNRI), Uppsala University, and U.S. Agency for International Development (USAID).
We gratefully acknowledge the participation of the women and their children.
The authors certify that all research involving human subjects was done under full compliance with all government policies and the Helsinki Declaration.
REFERENCES

Comments