


Abstract
The purpose of this study was to determine the effects of mat Pilates (MP) versus MP plus aerobic exercise (AE) compared with the effects of no intervention on ambulatory blood pressure (BP) in women with hypertension.
This 3-arm, parallel-group randomized clinical trial assessed 60 women who had hypertension and were 30 to 59 years old. The intervention lasted 16 weeks, and the participants were allocated into 3 groups: MP only (MP group), MP with alternating bouts of AE on a treadmill (MP + AE group), and control group (CG) with no exercises. Primary outcomes were the effects of the interventions on ambulatory BP assessed in the 24-hour, awake, and asleep periods of analysis.
A 2-way analysis of variance did not reveal statistically significant differences in between-group comparisons in the 24-hour period of analysis for systolic BP (CG vs MP = 3.3 [95% CI = −7.1 to 13.8]; MP vs MP + AE = 0.7 [95% CI = −4 to 5.4]; CG vs MP + AE = 4.0 [95% CI = −5.2 to 13.4]), diastolic BP (CG vs MP = 2.2 [95% CI = −5.6 to 10.0]; MP vs MP + AE = 1.1 [95% CI = −4.3 to 6.5]; CG vs MP + AE = 3.3 [95% CI = −3.8 to 10.4]), and heart rate (CG vs MP = 3.4 [95% CI = −2 to 8.8]; MP vs MP + AE = 2.0 [95% CI = −3.4 to 7.5]; CG vs MP + AE = 5.4 [95% CI = −0.8 to 11.8]). The awake and asleep periods of analyses also showed similar behavior and did not reveal statistically significant between-group differences. Furthermore, in the responsiveness analysis based on the minimal clinically important difference, no differences were observed between groups.
The magnitudes of the decrease in systolic BP during the 24-hour period of analysis were −3 and −5.48 mm Hg for the MP and MP + AE groups, without differences for responsiveness between groups. The results suggest that MP supplemented with AE or not may be an alternative adjuvant treatment for women who have hypertension and are using antihypertension medication.
Sixteen weeks of MP training reduced ambulatory BP in women who had hypertension. The MP + AE group displayed a BP reduction similar to that of the MP group. A reduction in ambulatory BP can decrease the risk of cardiovascular disease.
Introduction
Systemic arterial hypertension affects nearly one-third of adults in most communities in developed and developing countries,1 representing a significant risk factor for cardiovascular disease (CVD) onset.2 Regular exercise training has been used to reduce blood pressure (BP) levels.3 For the prevention and treatment of systemic arterial hypertension, the American College of Cardiology and the American Heart Association3,4 recommend aerobic exercise (AE) and resistance exercise (RTE) for 90 to 150 min/wk. It seems that AE and RTE are associated with several mechanisms, such as a reduction in sympathetic activity and peripheral vasoconstriction, playing a crucial role in BP control.5
A previous meta-analysis examining the effects of training with continuous AE and dynamic and isometric RTE found reductions in resting systolic BP (SBP) of 3.5 mm Hg, 1.8 mm Hg, and 10.9 mm Hg, respectively, and in diastolic BP (DBP) of 2.5 mm Hg, 3.2 mm Hg, and 6.2 mm Hg, respectively, in adults with prehypertension and hypertension.6 Moreover, current research indicates that dynamic and isometric RTE may produce BP reductions comparable with or more significant than those produced by AE.7,8 In light of these data, several methods of training, such as concurrent training (which combines AE and RTE in a single session) or high-intensity interval training, have been used to reduce BP. Concurrent training lowered SBP and DBP by 3.2 and 2.5 mm Hg, respectively9; high-intensity interval training lowered SBP and DBP by 6.3 and 3.8 mm Hg, respectively.10 In addition, new treatment therapies, such as mat Pilates (MP), are possible.11
MP is a modality of RTE used worldwide, especially among women who are middle aged and do not regularly practice other physical activities11,12; MP has been recommended by physical therapists for rehabilitation in several areas, including cardiac rehabilitation.11,13 Studies claim that MP improves muscle strength14 and cardiorespiratory fitness.15 Additionally, Pilates training has shown promising effects in reducing BP in short-term (7.4 mm Hg in SBP)16 and long-term (5.8–7.6 mm Hg in SBP and 3.3–3.6 mm Hg in DBP) follow-up assessments in women with hypertension17,18; these data warrant research regarding the use of MP in people with hypertension.
Previous studies verified that chronic reductions in BP of 1 to 20 mm Hg are associated with reduced cardiovascular events and stroke risk.19–22 However, BP can be influenced by several factors, such as stress, use of antihypertension drugs, and inaccuracies in the measurement of BP.23 Thus, reductions in BP, even in the range of 1 to 20 mm Hg, may not reflect a minimal clinically important difference (MCID) but a typical measurement error. Furthermore, no studies to our knowledge have established the MCID in BP control after MP training alone or supplemented with AE. Furthermore, reductions in SBP that occur in participants who exhibit favorable responses (responders)24 compared with those with modest responses (nonresponders) remain to be determined after MP training. Therefore, the aim of the present study was to determine the effects of MP versus MP plus AE (MP + AE) compared with the effects of no intervention (control group [CG]) on ambulatory BP in women with hypertension. We hypothesized that MP + AE would have a superior effect on reducing BP compared with MP training alone.
Methods
Study Design
This randomized, controlled, single-blind clinical trial was carried out for 16 weeks. The study was performed in the School Clinic of the Catholic University of Brasília and conducted according to the Declaration of Helsinki. Approval for the project was obtained from the local ethics committee (CAAE: 99221818.9.0000.0029). The trial was registered at the clinical trial platform (https://clinicaltrials.gov: NCT03791307). All participants were informed of the study’s objective, procedures, benefits, and potential risks before participation. Afterward, participants signed the informed consent form. The study is reported according to the Consolidated Standards of Reporting Trials Statement for Randomized Trials of Nonpharmacologic Treatments and the Template for Intervention Description and Replication.25,26
Randomization and Allocation Concealment
This 3-arm parallel-group randomized clinical trial (RCT) had a 1:1 intervention allocation. Computer-generated randomization lists were prepared using the website www.random.org, which sequentially distributed the participants into the group receiving MP, the group receiving MP supplemented with aerobic exercise (MP + AE), or the CG. One researcher prepared sealed, opaque, numbered envelopes. At the time when each participant enrolled in the study, the investigator opened the envelope with the smallest item number containing the group.
Masking
All assessments were performed by 1 researcher (A.M.M.S.), who was masked regarding the participants’ allocation. Because of the nature of the interventions, it was impossible to mask the participants and the Pilates instructors.
Participants
The participants were recruited through advertising on social networks and flyers. The inclusion criteria for the study were women aged 30 to 59 years, sedentary or irregularly active for at least 6 months,27 clinically diagnosed with systemic arterial hypertension according to the VII Brazilian Society of Hypertension Guidelines,2 use of antihypertension medication of any class, with medical permission to perform the exercise. The exclusion criteria were orthopedic problems that compromised the performance of the proposed exercises. Moreover, drug treatment changes, exertion angina, heart palpitations, or any cardiovascular events or symptoms that limited the participant from continuing the program and frequencies below 75% in exercise sessions were considered study discontinuity criteria.
Study Flow
The participants were randomized into 3 groups: the MP group performed traditional MP exercises; the MP + AE group performed traditional MP exercises with additional bouts of AE; and the CG did not perform physical training throughout the experimental period. Outcome measures were assessed before the 16-week intervention period and 48 hours after the last intervention session. Outcomes were evaluated across 3 different days. An ambulatory blood pressure monitor (ABPM) was donned on the first day and removed after 24 hours on the second day of assessments (Fig. 1). In addition, clinical BP and heart rate (HR), HR variability, and quality of life were assessed on the first day of the assessment; on the third day, participants performed strength, flexibility, and functional task tests and a cardiorespiratory exercise test, and an anthropometric analysis was performed. Details of these results are presented in Supplementary Appendix 1.
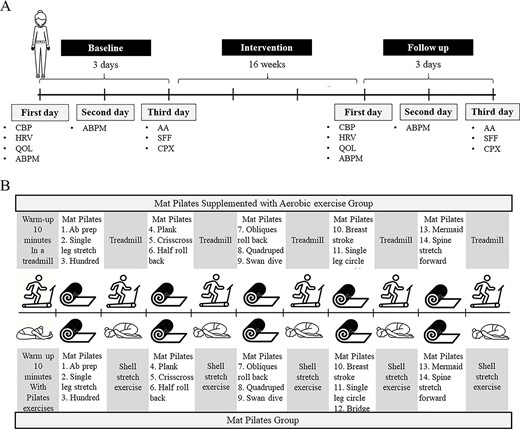
Experimental designs. (A) The order of each evaluation procedure is represented. Clinical blood pressure and heart rate (CBP); heart rate variability (HRV); quality of life (QOL); ambulatory blood pressure monitor (ABPM); anthropometric analysis (AA); strength, flexibility, and functional tasks (SFF); and a cardiorespiratory exercise test (CPX) were performed in the baseline and follow-up evaluations. The ABPM was donned on the first day and removed after 24 hours on the second day of assessments. (B) Design of experimental sessions.
All participants were evaluated at the same time of the day (always between 8 am and 12 pm) to minimize possible interference of the circadian cycle, with controlled temperature (22°C–24 °C) and relative humidity (40%–60%). Participants were instructed not to consume caffeine or any other stimulants for 12 hours and refrain from intense physical activity 48 hours before the evaluations.
Training Protocol
The sessions were administered for 16 weeks, twice per week. The sessions lasted 40 to 50 minutes, divided into the warm-up and stretching, MP exercises, stretching, and cooling-down phases.17 MP sessions for both groups were intermittent, using a work-to-rest ratio of 1:0.5.28 The sessions were performed following the design of 3 MP exercises (approximately 4–6 minutes) alternated with bouts of AE on a treadmill (MP + AE group) or periods performing a traditional MP exercise named the shell stretch (MP group) (approximately 2–3 minutes). The MP group performed a typical Pilates session, like clinical practice, including only traditional Pilates exercises. MP sessions were similar for both groups,29 differing only in the type of warm-up used and the inclusion of bouts of AE on a treadmill (MP + AE group) (Fig. 1).
The degree of difficulty of the exercises increased from the third week using variations in the exercises and objects (ball and elastic band). HR was monitored during all sessions, and participants were instructed to report their perception of effort. The intensity of the MP exercises was the same for both groups according to the rate of perceived effort on the Borg Scale, ranging from 11 to 13 during weeks 1 to 8 and 13 to 15 during weeks 9 to 16. The intensity of the AE on the treadmill ranged from 80% to 85% of the second ventilatory threshold (VT2) during weeks 1 to 8 and 85% to 95% of the VT2 during weeks 9 to 16, monitored using an HR monitor (FT1 model; Polar, Kempele, Finland).
The first ventilatory threshold and VT2 were identified by the ventilatory equivalents method30 in a maximum symptom-limited cardiorespiratory exercise test using a treadmill (model Super ATL; Inbramed, Porto Alegre, Brazil) with gas analysis (model Vo2000; MGC Diagnostics, MN, USA) and electrocardiographic monitoring (Wincardio model; Micromed, São Paulo, Brazil) using Ergo PC Elite software (Micromed) according to the criteria proposed by Balady et al.30 The test was composed of increasing loads, with speeds from 3.0 to 6.0 km/h and inclinations of 4% to 14%, without pauses between stages until the participant’s exhaustion.31
Minute ventilation, oxygen uptake, and carbon dioxide output were acquired breath-by-breath and averaged over 10-second intervals. Subjective perceived effort and BP were measured continuously every 3 minutes. The following criteria were adopted as the maximum test: HR > 85% of the maximum predicted HR and respiratory exchange ratio of >1.10.30 The test was also interrupted at the discretion of the cardiologist responsible for the examination if the participant manifested electrocardiographic abnormalities or abnormal BP response.
Adherence was defined as the percentage of completed sessions calculated for all experimental groups who started and completed the 16-week intervention period. A standardized form was used to record the occurrence of adverse events during the intervention period. In each session, participants were questioned by the Pilates instructors about muscle pain or spasms, joint pain, dizziness, cramps, exertion angina, and heart palpitations. All participants were also asked about changes in antihypertension drug treatment during the 16 weeks, and a standardized form was used to record the information.
Outcomes
Primary outcomes were the effect of MP training on ABPM parameters. To collect preliminary data to support future RCTs, clinical BP and HR analysis, HR variability, quality of life, functional task tests, anthropometric variables, and cardiorespiratory fitness were measured. The data from these outcomes are presented in Supplementary Appendix 1. No changes occurred in the trial outcomes after the trial commenced.
Body weight (kilograms) was measured using a calibrated digital scale (W300 model; Welmy, São Paulo, Brazil), height (meters) was measured using a stadiometer (Sanny, São Paulo, Brazil), and body mass index was calculated as the weight (kilograms) divided by the height squared (meters squared).
Ambulatory BP was measured using an oscillometric ABPM (Dyna-Mapa model; Cardios, São Paulo, Brazil). The measurements were performed every 15 minutes during the awake period and every 30 minutes during the asleep period for 24 hours. The participants were instructed to complete a report containing the activities performed during the period they were using the device and were guided to maintain their daily routine, avoiding physical activities. SBP, DBP, mean BP (MBP) (mm Hg), and double product (beats per minute × mm Hg) were analyzed for the following periods: 24-hour (average of all measurements during the 24 hours), awake (average of all measurements while participants reported being awake), and asleep (average of all measurements while participants reported being asleep).
Data Analyses and Sample Size
The quantitative variables to characterize the sample are respectively expressed as mean and SD or frequency distribution. The Levene test was used to evaluate the homogeneity of variances. Accordingly, mainly parametric statistics were performed. A 2-way analysis of variance was used to assess all outcomes with time (2 levels: before and after) and groups (3 levels: MP, MP + AE, and CG) as factors. Post hoc analyses (Tukey honestly significant difference test) were performed when the threshold of significance was reached, and homoscedasticity was assumed. No Bonferroni correction was performed.32 Effect sizes were determined using generalized η2 (ηG2) for the analysis of variance.33 The Cohen d was used for effect sizes. Cohen34 provided benchmarks to define small (ηG2 > 0.01), medium (ηG2 > 0.06), and large (ηG2 > 0.14) effects. The statistical software used was STATISTICA (version 12; StatSoft Inc, OK, USA). In addition, SPSS statistical software (version 20; IBM SPSS, Chicago, IL, USA) was used to obtain the CI for within-group (follow-up minus baseline) and between-group differences at follow-up. All statistical tests were 2-sided, and the significance level was set at P < .05. An intention-to-treat analysis was performed for all randomized participants. Missing data were replaced using the expectation–maximization method.
In addition, for the MCID analyses, 0.80 (large effect) was multiplied by the SD of the preexercise SBP and DBP values for the treatment groups35–37 during the ABPM analysis in the 24-hour period. The MCIDs of SBP and DBP for the CG, MP + AE group, and MP group were 8.43 and 5.54 mm Hg, respectively. Given the previously reported information, for a difference to be considered an MCID, the participant was required to show decrements in SBP and DBP of ≥8.43 and ≥5.54 mm Hg, respectively.35–37 responders for SBP and DBP were classified on the basis of the MCID. High responders were classified as showing SBP and DBP declines of ≥8.43 and ≥5.54 mm Hg, respectively.
We determined the magnitude-based inference (MBI) for SBP and DBP to draw conclusions about the probability that the population effect was substantial or trivial rather than null.21,22,38,39 First, the technical error was calculated for SBP and DBP during the ABPM analysis in the 24-hour period. The confidence interval width of 50% was used to calculate the true score change for SBP and DBP.37 The MBI was determined on the basis of the CI (represented by the values on an Excel [Microsoft, Redmond, WA, USA] spreadsheet; Suppl. Appendix 2) for an MCID previously calculated for CG and both experimental groups. Thus, any increase or decrease larger than the MCID was considered relevant, whereas all changes smaller than the MCID were considered too small to be of practical relevance (ie, trivial).37,39,40
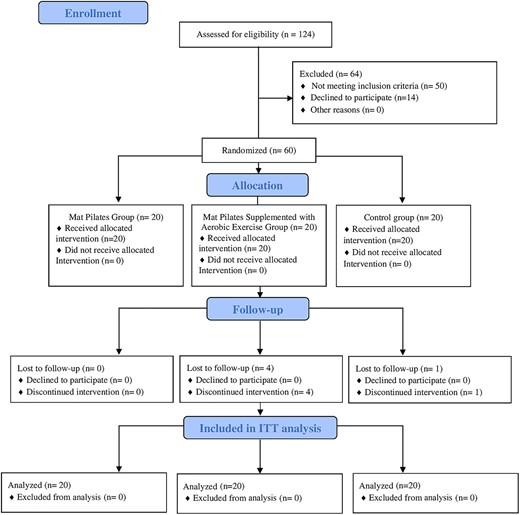
CONSORT flow diagram.
Considering that MBI might increase the risk of false-positive results and some statistics experts have raised concerns regarding the validity of MBI,41,42 an additional statistic with good error control—second-generation P value (SGPV)—was included. The SGPV indicates when the data are compatible with the null hypothesis (SGPV = 1) or with alternative hypotheses (SGPV = 0) or when the data are inconclusive (0 < SGPV < 1).43,44 We also calculated the number needed to treat to facilitate the development of clinical guidelines45 for future management of SBP.
The sample size was determined a priori using G*Power (version 3.1.3; University of Heinrich-Heine, Düsseldorf, Germany) with the level of significance set at P = .05 and a power (1 − β) of 0.80 to detect a large effect (F-test2 > 0.45). We conducted a pilot study with 5 participants to evaluate the effect size to detect a significant difference of 6 mm Hg in ambulatory SBP in the 24-hour period (primary outcome) and an SD of 12 mm Hg. Based on these calculations, a final sample size of 60 participants was estimated.
Role of the Funding Source
The funders played no role in the design, conduct, or reporting of this study.
Results
Between April 2019 and December 2019, 124 women with hypertension were assessed for eligibility. Of these, 60 were eligible according to the inclusion criteria and were equally randomized into 3 groups for the study (age: 50.1 [SD = 6.2] years; body mass: 77.9 [SD = 17.7] kg; height: 159.0 [SD = 6.3 cm]; body mass index: 30.5 [SD = 6.2] kg/m2). Four participants from the MP + AE group and 1 participant from the CG did not complete the intervention and declined to attend the postintervention assessments. The intention-to-treat analysis was applied as described above. The recruitment process and follow-up are described in the Consolidated Standards of Reporting Trials flow diagram (Fig. 2). The clinical characteristics of the participants are shown in Table 1.
Baseline Characteristics of Participantsa
| Characteristic | CG | MP Group | MP + AE Group | P |
|---|---|---|---|---|
| Age, y | 49.9 (6.6) | 49.0 (7.4) | 51.6 (4.2) | .42 |
| Body mass, kg | 79.9 (16.7) | 78.1 (20.3) | 74.3 (16.6) | .60 |
| Height, cm | 158.6 (7.3) | 160.9 (4.7) | 157.4 (6.4) | .21 |
| BMI, kg/m2 | 31.6 (5.7) | 30.0 (7.3) | 29.9 (5.6) | .63 |
| SBP rest, mm Hg | 118.5 (7.4) | 117.7 (8.4) | 122.2 (10.5) | .24 |
| DBP rest, mm Hg | 76.3 (10.5) | 76.4 (6.9) | 76.9 (9.1) | .97 |
| MBP rest, mm Hg | 90.4 (7.6) | 90.2 (6.6) | 92.0 (8.4) | .70 |
| HR rest, bpm | 70.9 (8.1) | 71.2 (12.6) | 68.7 (8.6) | .68 |
| DP rest, mm Hg × bpm | 8386.5 (893.1) | 8356.6 (1353.9) | 8403.2 (1353.0) | .99 |
| Postmenopause, yes/no, no. of participants | 14/6 | 14/6 | 15/5 | |
| Antihypertensive drugs, % of participants | ||||
| Diuretics | 55.0 | 50.0 | 70.0 | |
| Calcium channel blockers | 20.0 | 10.0 | 25.0 | |
| Beta-blockers | 20.0 | 40.0 | 35.0 | |
| Antagonists of angiotensin II receptor | 80.0 | 85.0 | 60.0 | |
| ACE inhibitors | 15.0 | 5.0 | 0 | |
| Risk factors/diseases, % of participants | ||||
| Diabetics mellitus | 25.0 | 20.0 | 20.0 | |
| Dyslipidemia | 50.0 | 40.0 | 35.0 | |
| Smoking | 5.0 | 0 | 0 |
aData are reported as mean (SD) unless otherwise indicated. ACE = angiotensin-converting enzyme; BMI = body mass index; bpm = beats per minute; CG = control group; DP rest = double product at rest; DBP rest = diastolic blood pressure at rest; HR rest = heart rate at rest; MBP rest = mean blood pressure at rest; MP = mat Pilates; MP + AE = mat Pilates supplemented with aerobic exercise; SBP rest = systolic blood pressure at rest.
Adherence and Adverse Events
Adherence to the 32 treatment sessions was high (31.2 [SD = 1.5] sessions). The number of missed sessions did not differ significantly between the experimental groups (P = .5). Four participants in the MP + AE group missed between 3.1% and 12.5% of the sessions. In the MP group, 6 participants missed between 3.1% and 18.7% of the sessions. The most common reasons given were illness or doctor appointments, followed by private interests. No adverse effects or changes in antihypertension drug treatment were reported.
Exercise Session Intensity
The mean HR values obtained in the cardiorespiratory exercise test at VT2 were 137.3 (SD = 17.2), 138 (SD = 16.7), and 147.3 (SD = 14.8) beats per minute for the MP group, the MP + AE group, and the CG, respectively, and did not differ significantly between the groups (P = .1). The Supplemental Figure shows the SBP, DBP, mean, and peak HR responses of the MP and MP + AE groups in each quartile (each 8 sessions) of the entire protocol (32 sessions).
The mean HR values in the sessions for the MP and MP + AE groups corresponded, respectively, to 62.7% and 73.4% of the VT2 in the first quartile, 66.7% and 78.1% in the second, 64.8% and 78.5% in the third, and 66.3% and 77.3% in the fourth. In addition, the peak HR values in the sessions for the MP and MP + AE groups were, respectively, 81.7% and 90% of the VT2 in the first quartile, 86.3% and 93.7% in the second, 84.9% and 94.7% in the third, and 86.3% and 95.5% in the fourth.
Ambulatory BP
Tables 2 and 3 present the ABPM data for within-group and between-group comparisons at baseline and follow-up in the 24-hour, awake, and asleep periods. The between-group comparisons did not reveal a statistical difference for any analyzed variables (P > .05).
ABPM Data for Groups and Within-Group and Between-Group Comparisonsa
| Mean (SD) for: | Mean Within-Group Differenceb (95% CI) | Mean Between-Group Difference at Follow-Up (95% CI) | ||||||||||
|---|---|---|---|---|---|---|---|---|---|---|---|---|
| CG (n = 20) | MP Group (n = 20) | MP + AE Group (n = 20) | ||||||||||
| ABPM Outcome | Baseline | Follow-Up | Baseline | Follow-Up | Baseline | Follow-Up | CG (n = 20) | MP Group (n = 20) | MP + AE Group (n = 20) | CG vs MP Group | MP Group vs MP + AE Group | CG vs MP + AE Group |
| 24-h period | ||||||||||||
| SBP, mm Hgc | 123.3 (11.7) | 123.0 (12.6) | 122.6 (12.0) | 119.6 (11.5) | 124.4 (8.9) | 118.9 (8.0) | —0.28 (−5.6 to 5.0) | −3 (−7.1 to 1.1) | −5.48 (−8.4 to −2.5) | 3.3 (−7.1 to 13.8) | 0.7 (−4 to 5.4) | 4.0 (−5.2 to 13.4) |
| DBP, mm Hgc | 78.6 (8.9) | 78.4 (8.9) | 78.3 (7.6) | 76.2 (7.2) | 77.8 (6.3) | 75.1 (6.0) | −0.1 (−3.5 to 3.2) | −2.1 (−4.6 to 0.4) | −2.6 (−4.2 to −1.1) | 2.2 (−5.6 to 10.0) | 1.1 (−4.3 to 6.5) | 3.3 (−3.8 to 10.4) |
| MBP, mm Hgc | 93.5 (8.9) | 93.3 (9.5) | 93.1 (8.4) | 90.7 (8.3) | 93.3 (5.9) | 89.7 (5.2) | −0.2 (−4.1 to 3.7) | −2.4 (−5.2 to 0.4) | −3.6 (−5.3 to −1.8) | 2.6 (−5.7 to 10.9) | 0.9 (−3.6 to 5.6) | 3.5 (−3.6 to 10.7) |
| HR, bpm | 79.5 (6.2) | 81.1 (5.7) | 77.9 (5.6) | 77.7 (6.7) | 76.1 (5.4) | 75.6 (6.8) | 1.5 (−0.6 to 3.7) | −0.1 (−2.9 to 2.5) | −0.5 (−2.8 to 1.9) | 3.4 (−2 to 8.8) | 2.0 (−3.4 to 7.5) | 5.4 (−0.8 to 11.8) |
| DP, bpm × mm Hg | 9811.3 (1194.4) | 9980.9 (1244.2) | 9573.4 (1300.1) | 9306.5 (1246.6) | 9477.7 (1013.4) | 9009.5 (1088.8) | 169.6 (−368.9 to 708.1) | −266.9 (−802.7 to 268.8) | −468.2 (−879.5 to −56.7) | 674.4 (−291.0 to 1639.8) | 296.9 (−493.7 to 1087.6) | 971.3 (−161.6 to 2104.3) |
| Awake period | ||||||||||||
| SBP, mm Hgc | 125.5 (11.2) | 125.3 (12.7) | 125.0 (12.1) | 121.7 (11.6) | 126.3 (9.3) | 120.0 (7.2) | −0.2 (−5.4 to 5.1) | −3.3 (−7.6 to 1.0) | −6.3 (−8.6 to −4.1) | 3.5 (−7.2 to 14.3) | 1.7 (−3.8 to 7.3) | 5.3 (−3.2 to 13.8) |
| DBP, mm Hgc | 80.5 (8.9) | 80.3 (8.8) | 80.3 (7.7) | 78.4 (7.6) | 79.6 (6.6) | 76.8 (6.5) | −0.2 (−3.5 to 3.0) | −1.9 (−4.5 to 0.7) | −2.8 (−4.4 to −1.1) | 1.8 (−6.2 to 9.9) | 1.5 (−4.2 to 7.4) | 3.4 (−3.9 to 10.8) |
| MBP, mm Hgc | 95.5 (8.8) | 95.3 (9.5) | 95.2 (8.5) | 92.8 (8.5) | 95.2 (6.1) | 91.2 (5.4) | −0.2 (−4 to 3.6) | −2.4 (−5.3 to 0.6) | −4 (−5.6 to −2.3) | 2.4 (−6.1 to 11) | 1.6 (−3.4 to 6.7) | 4.0 (−3 to 11.1) |
| HR, bpm | 81.6 (6.7) | 83.7 (5.7) | 80.7 (5.8) | 80.2 (7.0) | 77.5 (5.9) | 77.5 (7.1) | 2.1 (−0.4 to 4.5) | −0.5 (−3.6 to 2.5) | 0 (−3.2 to 3.3) | 3.5 (−2.2 to 9.2) | 2.6 (−3.3 to 8.6) | 6.1 (−0.4 to 12.7) |
| DP, bpm × mm Hg | 10,247.2 (1201.3) | 10,493.6 (1307.3) | 10,114.8 (1360.8) | 9771.3 (1306.1) | 9811.8 (1157.8) | 9323.1 (1099.0) | 246.4 (−321.4 to 814.1) | −343.5 (−953 to 265.9) | −488.7 (−995.2 to 17.8) | 722.2 (−306.7 to 1751.2) | 448.2 (−423.2 to 1319.7) | 1170.4 (4.3 to 2336.6) |
| Asleep period | ||||||||||||
| SBP, mm Hg | 115.0 (15.93) | 115.1 (15.3) | 113.2 (13.3) | 111.7 (13.0) | 116.8 (9.2) | 110.5 (6.8) | 0.1 (−6.6 to 6.9) | −1.5 (−5.6 to 2.6) | −6.3 (−8.9 to −3.3) | 3.4 (−7.8 to 14.6) | 1.1 (−6.3 to 8.5) | 4.5 (−5.9 to 15) |
| DBP, mm Hgc | 73.2 (10.6) | 71.5 (10.5) | 70.9 (8.9) | 69.7 (8.0) | 72.0 (7.2) | 68.2 (5.5) | −1.7 (−7.2 to 3.7) | −1.2 (−4.3 to 1.9) | −3.8 (−6.1 to −1.4) | 1.7 (−6.9 to 10.5) | 1.5 (−3.9 to 6.9) | 3.2 (−4.1 to 10.7) |
| MBP, mm Hgc | 87.1 (11.0) | 86.0 (11.6) | 85.0 (9.7) | 83.7 (9.1) | 86.9 (7.1) | 82.3 (4.9) | −1.1 (−6.7 to 4.5) | −1.3 (−4.3 to 1.7) | −4.6 (−6.9 to −2.2) | 2.3 (−6.9 to 11.6) | 1.3 (−4.1 to 6.8) | 3.7 (−4.3 to 11.7) |
| HR, bpm | 71.9 (7.1) | 72.8 (8.1) | 67.9 (7.2) | 68.0 (6.9) | 68.6 (4.6) | 68.5 (6.4) | 0.9 (−2.6 to 4.5) | 0.1 (−2.2 to 2.5) | −0.1 (−2.2 to 2.1) | 4.8 (−0.8 to 10.4) | −0.5 (−6 to 4.9) | 4.2 (−2.7 to 11.3) |
| DP, bpm × mm Hg | 8276.5 (1460.9) | 8358.6 (1240.2) | 7688.8 (1280.5) | 7613.1 (1264.2) | 8032.0 (953.7) | 7597.7 (971.4) | 82.1 (−533.2 to 697.6) | −75.7 (−418.6 to 267.3) | −434.3 (−766.5 to −102.1) | 745.5 (−78.2 to 1569.3) | 15.4 (−793.4 to 824.3) | 760.9 (−274.2 to 1796.1) |
aABPM = ambulatory blood pressure monitor; CG = control group; DBP = diastolic blood pressure; DP = double product; HR = heart rate; MBP = mean blood pressure; MP = mat Pilates; MP + AE = mat Pilates supplemented with aerobic exercise; SBP = systolic blood pressure.
bCalculated as follow-up minus baseline.
cWithin-group effect (P < .05).
Between-Group and Within-Group Comparisons for ABPM Outcomesa
| ABPM Outcome | Within Group | Between Group | ||||||||
|---|---|---|---|---|---|---|---|---|---|---|
| F(1) | Power | Effect Sizeb | P | F(2) | Power | Effect Sizeb | P | |||
| 24-h period | ||||||||||
| SBP, mm Hg | 6.259 | 0.69 | 0.01 | .01c | 1.650 | 0.33 | 0.009 | .20 | ||
| DBP, mm Hg | 5.422 | 0.62 | 0.01 | .02c | 1.131 | 0.23 | 0.005 | .32 | ||
| MBP, mm Hg | 6.393 | 0.70 | 0.01 | .01c | 1.468 | 0.30 | 0.008 | .23 | ||
| HR, bpm | 0.21 | 0.07 | 0.0006 | .65 | 0.91 | 0.19 | 0.005 | .40 | ||
| DP, bpm × mm Hg | 1.877 | 0.27 | 0.006 | .17 | 1.872 | 0.37 | 0.01 | .16 | ||
| Awake period | ||||||||||
| SBP, mm Hg | 8.159 | 0.80 | 0.02 | .005c | 2.415 | 0.46 | 0.01 | .09 | ||
| DBP, mm Hg | 5.118 | 0.60 | 0.01 | .02c | 1.049 | 0.22 | 0.004 | .35 | ||
| MBP, mm Hg | 7.129 | 0.74 | 0.01 | .009c | 1.758 | 0.35 | 0.009 | .18 | ||
| HR, bpm | 0.42 | 0.09 | 0.001 | .51 | 0.93 | 0.20 | 0.007 | .40 | ||
| DP, bpm × mm Hg | 1.582 | 0.23 | 0.006 | .21 | 2.096 | 0.41 | 0.01 | .13 | ||
| Asleep period | ||||||||||
| SBP, mm Hg | 3.646 | 0.46 | 0.01 | .06 | 2.066 | 0.40 | 0.01 | .13 | ||
| DBP, mm Hg | 4.287 | 0.53 | 0.01 | .04c | 0.538 | 0.13 | 0.004 | .58 | ||
| MBP, mm Hg | 4.641 | 0.56 | 0.01 | .03c | 1.104 | 0.23 | 0.007 | .33 | ||
| HR, bpm | 0.220 | 0.07 | 0.0007 | .64 | 0.155 | 0.07 | 0.001 | .85 | ||
| DP, bpm × mm Hg | 1.322 | 0.20 | 0.003 | .25 | 1.517 | 0.30 | 0.008 | .22 | ||
aABPM = ambulatory blood pressure monitor; DBP = diastolic blood pressure; DP = double product; HR = heart rate; MBP = mean blood pressure; SBP = systolic blood pressure.
bEffect size = generalized η2 (ηG2).
cP < .05.
Regarding the within-group comparisons, the 24-hour period of analysis revealed a significant reduction in SBP (P = .01), DBP (P = .02), and MBP (P = .01). There was no significant within-group effect in HR (P = .65) and double product (P = .17). Similar behavior was also observed in the awake period of analysis, which showed a significant within-group effect, with a reduction in SBP (P = .005), DBP (P = .02), and MBP (P = .009). There was no significant within-group effect in HR (P = .51) and double product (P = .21). Finally, the asleep period of analysis revealed a significant within-group effect, with a reduction in DBP (P = .04) and MBP (P = .03). In addition, there was no significant within-group effect in SBP (P = .06), HR (P = .64), and double product (P = .25).
Responsiveness Based on MCID
For the responsiveness based on MCID (Fig. 3), 5, 6, and 4 responders displayed an MCID for SBP in the MP group, the MP + AE group, and the CG, respectively. However, 2, 1, and 4 participants in the MP group, MP + AE group, and CG, respectively, displayed an adverse response. For DBP, 4, 5, and 2 responders in the MP group, MP + AE group, and CG, respectively, displayed an MCID. However, 1 participant in the MP group and 4 participants in the CG displayed an adverse response for DBP.
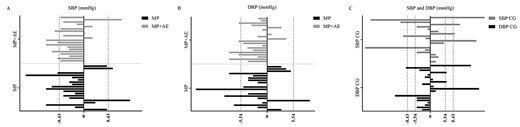
Minimal clinically important difference (MCID) in the 24-hour period. (A) MCID for systolic blood pressure (SBP) in the 24-hour period for the group receiving mat Pilates supplemented with aerobic exercise (MP + AE) and the group receiving mat Pilates (MP). (B) MCID for diastolic blood pressure (DBP) in the 24-hour period for the MP + AE group and the MP group. (C) MCID for SBP and DBP in the 24-hour period for the control group (CG).
Magnitude-Based Inference
With respect to the MBI for SBP in the CG, 2 individuals had responses in the direction of improvement, 16 displayed no changes, and 2 showed worsening. For DBP, the CG had 1 participant who displayed a response in the direction of improvement, 17 who displayed no changes, and 2 who showed worsening. For SBP in the MP group, 1 participant displayed a response in the direction of improvement, 18 displayed no changes, and 1 showed worsening. For DBP in the MP group, 1 participant displayed a response in the direction of improvement and 19 displayed no changes. For SBP in the MP + AE group, 1 participant displayed a response in the direction of improvement, 18 displayed no changes, and 1 displayed worsening. For DBP in the MP + AE group, 2 participants displayed a response in the direction of improvement and 18 displayed no changes.
Second-Generation P Value
Both experimental groups displayed an SGPV of 0.74, meaning that 74% of the data-supported hypotheses were null hypotheses compared with the CG.
Number Needed to Treat
The percentages of participants not receiving the treatment benefit (reduction in SBP beyond the MCID) were 80% (16/20) for the CG, 75% (15/20) for the MP group, and 70% (14/20) for the MP + AE group. Thus, it would be necessary to give the MP + AE intervention to 10 participants for just 1 person to receive the benefit (reduction in SBP beyond the MCID) compared with the CG event rate. For the MP group, it would be necessary to give the intervention to 20 participants for just 1 person to receive the benefit compared with the CG event rate.
Discussion
To the best of our knowledge, this is the first RCT to assess the effects of 16 weeks of traditional MP and MP + AE in women who have hypertension and are using antihypertension medications. Our findings will help to provide information for physical therapists on how best to use MP or MP + AE to control BP in women with hypertension; this discussion is important because the reduction of BP levels is associated with decreased risk of CVD.19,20 The magnitudes of decrease in SBP during the 24-hour period of analysis were −3 and −5.48 mm Hg, respectively, for the MP and MP + AE groups. The reductions in SBP and DBP found in the present study seem to be similar to those found with high-intensity interval training10 and concurrent training.9 Moreover, MP has shown positive results in lowering BP after long-term training. Martins-Meneses et al17 also found reductions in SBP (5.8–7.1 mm Hg), DBP (3.3–3.6 mm Hg), and MBP (4.3–4.8 mm Hg) after 16 weeks of MP training in both 24-hour ABPM and the clinical assessment at rest. Marinda et al18 reported a reduction in SBP (7 mm Hg) at rest after 8 weeks of MP training in older women with prehypertension. In addition, Guimarães et al13 also showed a reduction in DBP (6 mm Hg) at rest after 16 weeks of MP training in patients with heart failure.
Although the reduction in BP found in the present study is less expressive than the values in the literature,13,17,18 it is essential to highlight that our protocol and session design differed from other studies. In addition, in previous studies,13,18 the BP monitoring was performed using the auscultation method. Although this method is used and recommended for BP monitoring, ABPM has greater diagnostic and prognostic capability because it enables multiple measurements for 24 hours.46,47 Furthermore, new recommendations have pointed out that standardization of the auscultation method is challenging to follow in clinical settings, and measurement errors can be related to the auscultation, suggesting the use of validated electronic oscillometric upper arm devices.46
No differences between groups were observed regarding 3 statistical tests. For the MBI based on MCID values, no differences between groups were observed. The SGPV also agrees with the results from the analysis of variance and MBI, demonstrating that 74% of data-supported hypotheses are null hypotheses. This means no differences between CG and experimental groups. However, considering that 26% of data-supported hypotheses are alternative hypotheses, the difference between statistical and scientific significance and the routine misinterpretation of nonsignificant P values must be considered.44 Because of this, responsiveness based on MCID was performed and confirmed the results previously obtained from the analysis of variance, SGPV, and MBI.
The number needed to treat was also calculated to demonstrate how many participants need to be treated for a specific period to prevent 1 additional bad outcome and to provide information on the clinical usefulness of treatments.45 As displayed by our study, we need to give the MP + AE intervention to 10 patients for just 1 person to receive the benefit (reduction in SBP beyond MCID). Although this is important information, we need to bear in mind that the number needed to treat provides only a point estimate of the treatment effect based on the RCT from which it is derived.45
Another important statistical tool that may affect the meaning of the results in studies is the MCID. The MCID calculation has 2 general approaches: anchor-based methods and distribution-based methods.35 For the anchor-based method, a change in an outcome score reported by a person (ie, BP) is compared with another measure of change (anchor or external criterion) from another study.35 Thus, reductions of 1 mm Hg,19 2 mm Hg,20 10 mm Hg,21 and 20 mm Hg22 in SBP are considered as the MCID. For the distribution-based approach, a change in patient-reported outcome scores is compared with some variability measures, such as the standard error of measurement, SD, and effect size. Although we used the distribution-based approach for our study, the specific choice of approach will dictate the type of change measured and interpretation of the results.35
Considering the MCID of 8.43 mm Hg displayed in our study for SBP, a previous report including >40 RCTs on lowering BP demonstrated that each 10-mm Hg reduction in SBP was associated with a decrease of 34% in the relative risk of stroke in people who were 60 to 69 years old.21 Therefore, the MCID might depend on the anchor, the severity of the disease, and the intervention.48,49 For the DBP, a previous study demonstrated that a decrement of 2 mm Hg reduces the risk of coronary heart disease by 6% and stroke by 15%.50 Taking into consideration the magnitudes of decrease in BP observed in our study and the anchor-based method, it is possible that MP supplemented with AE or not can have an impact on the reduction in CVD.19,20,50 In fact, MP is a type of RTE, which combines dynamic and static RTE with the recruitment of large muscle groups.11,16,17 The reduction in BP with RTE has already been shown in a previous meta-analysis.6
The mechanisms involved in reduced BP resulting from the practice of MP are still not well elucidated. Some hypotheses have been suggested, such as the decrease in peripheral vascular resistance, such as occurs in response to AE, with increased bioavailability of nitric oxide.8,17 Additionally, changes in the autonomic control, with a decrease in sympathetic and an increase in parasympathetic activity, can also be suggested. Furthermore, Martins-Meneses et al17 suggested that the long-term BP decrease may be the result of successive BP reductions after acute Pilates sessions. Indeed, Rocha et al16 showed an acute BP decrease during recovery after Pilates sessions. Future studies are needed to clarify the hypotensive mechanisms involved in the practice of the Pilates method.
Nevertheless, we should consider the technical error, which may affect the value of the measurement or the true score as normal biological variability.51 Consequently, reductions of 2 mm Hg for DBP and 10 mm Hg for SBP do not always reflect the MCID but may reflect measurement error. Moreover, the technical errors for SBP in the present study in the MP and MP + AE groups were 6.20 and 4.44 mm Hg, respectively; the technical errors for DBP in the MP and MP + AE groups were 3.86 and 2.33 mm Hg, respectively. Technical error assessment enables us to better understand the individual reductions that may be related to bias in the measurement and should not necessarily be interpreted as MCID, as statistically significant, or as individual variation in the MP training response.23,52,53
Another important factor is the existence of adverse responders (participants who had increased of BP) in our study. The responsiveness might be influenced by external factors such as nutritional status, readiness to train, sleep, and stress.23 For example, in a previous study, older participants who had hypertension and carried the D/D genotype of the angiotensin-converting enzyme showed an impaired (increase) BP response following an AE session, especially during sleep.54 Thus, further research is required to clarify the effect of nutritional factors, angiotensin-converting enzyme polymorphism, and exercise recovery on the variability in BP response to an MP program. In addition, it is essential to mention that the participants in the present study were taking antihypertension medication and their BP was well controlled; therefore, the fact that the BP had little room to decrease may have influenced the responders and nonresponders.7
Of note, the adherence to the Pilates sessions found in our study was high, and no adverse effects were reported. This is important because physical exercise is largely recommended for health maintenance and as a tool for controlling BP,3,4 and the adherence of patients with hypertension to physical exercise programs has been shown to be lower than to other treatments.55 Thus, MP can be seen as a promising modality of exercise to control BP, given the safety and the great popularity of the method, especially among people who are middle aged and do not practice other forms of exercise.12
Limitations
Some limitations must be acknowledged; the age group of 30 to 59 years used as an eligibility criterion can be considered a limitation because, in this age interval, it is possible to find women with an active menstrual cycle, climacteric, and menopause. However, the available studies used a similar age group.16,17 The difficulty in maintaining intensity during MP exercises should be mentioned because, although the Borg Scale was used, the characteristic of MP exercises makes it challenging to maintain the target intensity throughout the exercise. Although the present study followed the frequency proposed by Martins-Meneses et al,17 2 sessions per week are below the recommended frequency.4 In addition, in this study, for ethical reasons and participants’ safety, only women who used antihypertension medication were included, as in other studies.16,17 Thus, the BP had little room to decrease, and the results cannot be generalized to those who do not use antihypertension medication.7 In addition, it was not possible to perform a follow-up of the primary outcomes, as stated in the guideline.26 Finally, there are few studies available on this topic, so further well-designed RCTs are needed to better understand the effects of the Pilates method on BP.
The magnitudes of decrease in SBP during the 24-hour period of analysis were −3 and −5.48 mm Hg, respectively, for the MP and MP + AE groups, without differences verified for responsiveness between groups. Thus, our results suggest that MP supplemented with AE or not may be an alternative adjuvant treatment for women who have hypertension and are using antihypertension medications.
Author Contributions
Concept/idea/research design: I. da Silva Almeida, L. de Souza Andrade, A.M. Melo de Sousa, G. Cipriano Jr, Y.L. Mota, J.L.Q. Durigan
Writing: I. da Silva Almeida, A.M. Melo de Sousa, G. Cipriano Jr, N. Turri-Silva, D. da Cunha Nascimento, Y.L. Mota, J.L.Q. Durigan
Data collection: I. da Silva Almeida, L. de Souza Andrade, A.M. Melo de Sousa, Y.L. Mota, J.L.Q. Durigan
Data analysis: I. da Silva Almeida, A.M. Melo de Sousa, D. da Cunha Nascimento, Y.L. Mota, J.L.Q. Durigan
Project management: I. da Silva Almeida, L. de Souza Andrade, Y.L. Mota, J.L.Q. Durigan
Fund procurement: Y.L. Mota, J.L.Q. Durigan
Providing participants: J.L.Q. Durigan
Providing facilities/equipment: Y.L. Mota, J.L.Q. Durigan
Providing institutional liaisons: Y.L. Mota, J.L.Q. Durigan
Clerical/secretarial support: Y.L. Mota
Consultation (including review of manuscript before submitting): I. da Silva Almeida, A.M. Melo de Sousa, G. Cipriano Jr, N. Turri-Silva, D. da Cunha Nascimento, Y.L. Mota, J.L.Q. Durigan
Acknowledgments
The authors thank Raynan dos Santos Ribeiro Santarém for carrying out the randomization of the participants, Milena Calado Santana and Michelle Raími Figueiredo de Sousa for training the participants, and the staff and teachers of the course of physical therapy and the Physical Evaluation and Training Laboratory of the Catholic University of Brasilia. The authors also thank Robin Hambly for reviewing the English language usage.
Ethics Approval
Approval for the project was obtained from the local ethics committee (CAAE: 99221818.9.0000.0029).
Funding
Financial support was provided by the Conselho Nacional de Desenvolvimento Científico e Tecnológico (CNPq - 312136/2018–8), Coordenação de Aperfeiçoamento de Pessoal de Nível Superior, Brasil (CAPES Finance Code 001), and Fundação de Apoio à Pesquisa do Distrito Federal (FAPDF – 9869.56.36441.10042016).
Clinical Trial Registration
This study was registered at Clinicaltrials.gov (NCT03791307).
Disclosures
The authors completed the ICMJE Form for Disclosure of Potential Conflicts of Interest and reported no conflicts of interest with respect to the research, authorship, or publication of this article.

Comments