


Abstract
Aggregation of islet amyloid polypeptide (IAPP) into islet amyloid results in β-cell toxicity in human type 2 diabetes. To determine the effect of islet amyloid formation on gene expression, we performed ribonucleic acid (RNA) sequencing (RNA-seq) analysis using cultured islets from either wild-type mice (mIAPP), which are not amyloid prone, or mice that express human IAPP (hIAPP), which develop amyloid. Comparing mIAPP and hIAPP islets, 5025 genes were differentially regulated (2439 upregulated and 2586 downregulated). When considering gene sets (reactomes), 248 and 52 pathways were up- and downregulated, respectively. Of the top 100 genes upregulated under two conditions of amyloid formation, seven were common. Of these seven genes, only steroidogenic acute regulatory protein (Star) demonstrated no effect of glucose per se to modify its expression. We confirmed this differential gene expression using quantitative reverse transcription polymerase chain reaction (qRT-PCR) and also demonstrated the presence of STAR protein in islets containing amyloid. Furthermore, Star is a part of reactomes representing metabolism, metabolism of lipids, metabolism of steroid hormones, metabolism of steroids and pregnenolone biosynthesis. Thus, examining gene expression that is differentially regulated by islet amyloid has the ability to identify new molecules involved in islet physiology and pathology applicable to type 2 diabetes.
Introduction
Type 2 diabetes in humans is characterized by islet β-cell secretory dysfunction and deposition of islet amyloid (Hull et al., 2004; Kahn et al., 2006). These islet amyloid deposits contain as their unique peptide component islet amyloid polypeptide (IAPP), which is normally co-secreted with insulin and is capable of forming fibrils that are cytotoxic to β-cells (Cooper et al., 1988; Kahn et al., 1990; Westermark et al., 1987). In animal models frequently used to study diabetes (e.g. rats and mice), the IAPP peptide sequence diverges from that of human IAPP (hIAPP) at a number of critical amino acids so that it is non-amyloidogenic and thus does not contribute to β-cell death (Westermark et al., 1990).
Given the lack of propensity for endogenous rodent IAPP to form amyloid and to study the cytotoxic effects of amyloidogenic hIAPP on β-cells, two approaches have typically been taken. Either synthetic hIAPP has been applied exogenously to cultured cells (Zhang et al., 2003; Fan et al., 2010) or transgenic rodent models expressing hIAPP in their β-cells have been utilized (Janson et al., 1996; Verchere et al., 1996; Höppener et al., 1999; Butler et al., 2004). Using these models for both in vitro and in vivo studies, progressive deposition of islet amyloid and β-cell loss have been observed, thereby providing some insight into the molecular basis for the human disease (Couce et al., 1996; Janson et al., 1996; Verchere et al., 1996; Höppener et al., 1999; Andrikopoulos et al., 2000; Kahn et al., 2000; Butler et al., 2004; Hull et al., 2005, 2009; Zraika et al., 2009; Aston-Mourney et al., 2011; Subramanian et al., 2012; Shigihara et al., 2014; Templin et al., 2017).
To provide a broader understanding of the molecular events that may result from islet amyloid deposition, we performed ribonucleic acid (RNA) sequencing (RNA-seq) on islets that expressed either hIAPP or mouse IAPP (mIAPP). As the induction of islet amyloid formation in vitro requires culturing islets in elevated glucose concentrations, the approach we used allowed not only for the determination of genes that were up- or downregulated by islet amyloid, but also for the role of glucose per se on islet gene expression.
Materials and Methods
Islet isolation and culture
Transgenic mice expressing wild-type hIAPP that replaced the endogenous mouse IAPP locus were produced by homologous recombination (Hiddinga et al., 2012). These mice, along with their wild-type mIAPP littermates, were bred on a C57BL/6NHsd background (Harlan, Indianapolis, IN, USA) and maintained at the VA Puget Sound Health Care System (VAPSHCS). Islets were isolated from pancreata of a 10-week-old male and female mice by collagenase digestion, purified by gradient separation and hand-picked prior to being recovered overnight in RPMI 1640 medium containing 11.1 mmol/l glucose, 10% fetal bovine serum, 1% sodium pyruvate and 1% penicillin/streptomycin. Thereafter, islets were cultured for 48 h in the same RPMI media containing either 11.1 or 16.7 mmol/l glucose (Zraika et al., 2007). The VAPSHCS Institutional Animal Care and Use Committee approved the studies.
The study design encompassed four different sample groups. Two groups comprised hIAPP islets, cultured either at 11.1 or 16.7 mmol/l glucose, and two groups comprised mIAPP islets cultured under the same two glucose conditions. Eight separate sets of experiments were performed, each comprising the four different sample groups. At the end of each experiment, islets were handpicked, 50 were set aside for histology and the remainder prepared for RNA-seq by washing twice in phosphate-buffered saline (PBS), and resuspending in 100 μl of PBS for storage at −80°C prior to further processing. Fig. 1 provides an overview of this process.
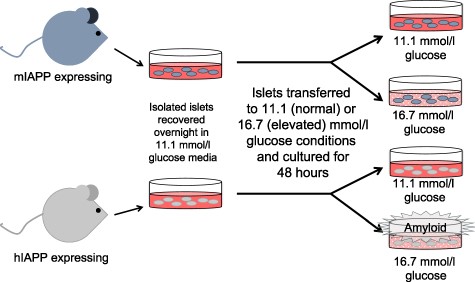
Schematic of the islet culture approach used to generate samples to examine the effect of islet amyloid formation on gene expression. Islets from mice containing the wild-type IAPP (mIAPP) or human IAPP (hIAPP) gene were cultured at either 11.1 or 16.7 mmol/l glucose for 48 h. Only islets containing the hIAPP gene that were cultured at 16.7 mmol/l glucose develop islet amyloid. Samples from each set of islets were collected and processed for histology, RNA-seq and RNA quantification.
In a second series of six experiments, islets were cultured similarly and harvested for histology and RNA quantification by quantitative reverse transcription polymerase chain reaction (qRT-PCR).
Histological assessment of islet amyloid area
Islets were fixed overnight in 10% neutral buffered formalin, rinsed and then embedded in agar to form an islet pellet. Thereafter, they were refixed in neutral buffered formalin for 3 h after which they were embedded in paraffin and processed for histology. Islet pellets were sectioned at 10 μm thickness and sections 100 μm apart were mounted on slides and stained for amyloid with thioflavin S (0.5% g/v; Sigma-Aldrich) and nuclei with Hoechst 33258 (2 μg/ml; Sigma-Aldrich). Islet β-cells were identified using an antiserum against insulin (20 μg/ml; clone K36AC10; Sigma-Aldrich, St. Louis, MO) for 18 h, followed by a 1-h incubation with secondary antisera (5.6 μg/ml; Jackson ImmunoResearch, West Grove, PA) conjugated with indocarbocyanine (Cy3).
An average of 22 ± 2 islets per condition from each experiment were assessed using fluorescence microscopy (Eclipse E800; Nikon, Japan) with thioflavin S and insulin-positive images captured with a camera (Retiga 1300; QImaging, Surrey, Canada) using the appropriate filters. From these images, amyloid prevalence was calculated as the number of amyloid-positive islets/total number of islets × 100 and amyloid severity as amyloid area/islet area × 100 (Meier et al., 2015). These measurements were performed by a single observer (M.F.H.) who was blinded to islet genotype and glucose culture conditions.
RNA isolation and mRNA sequencing library preparation
Islets were disrupted by homogenization in PBS and resuspended in 1 ml of TRIzol solution. Ribonucleic Acid (RNA) was extracted using the Direct-zol RNA mini-prep kit according to the manufacturer’s protocol, with DNase I treatment in the column to remove genomic DNA contamination (Zymo Research, Irvine, CA, USA). RNA was eluted in 30 μl TE buffer, and the quantity and quality of RNA examined on a MultiNA bioanalyzer (Shimadzu, Tokyo, Japan).
A NEBNext® Poly(A) mRNA Magnetic Isolation Module (New England Biolabs, Ipswich, MA) was used to enrich messenger RNA (mRNA) from 1 μg of total RNA. The NEBNext® Ultra™ Directional RNA Library Prep Kit for Illumina® was then used to generate barcoded libraries according to the manufacturer’s protocol, and these libraries were then quantified on the MultiNA bioanalyzer and pooled to equimolar ratios for sequencing.
mRNA sequencing and bioinformatics analysis
Cluster generation was performed at a concentration of 13 pmol/l with an HiSeq SR Cluster Kit v4-cBot-HS (Illumina, San Diego, CA), and the flow cell was run on Illumina HiSeq2500 using TruSeq v4 SBS reagents generating 60 nucleotide (nt) reads.
mRNA-seq data processing
Low-quality bases (Q score < 10) were removed from the 3′ end with Skewer 0.2.2 (Jiang et al., 2014). Mouse genome cDNA sequences were retrieved from Ensembl version 96 (Cunningham et al., 2019). Reads were mapped to transcripts using Kallisto v0.45.0 (Bray et al., 2016). Transcript counts were aggregated to gene-level counts with the sum function in R. Genes with an average of fewer than 10 reads per sample were omitted from downstream analysis. Data are available online at NCBI under accession number GSE135276.
Statistical analysis of RNA-seq gene expression
DESeq2 version1.20.0 was used to perform statistical analysis correcting for experimental batch (Love et al., 2014) with the false discovery rate (FDR) controlled at 5% using the method of Benjamini and Hochberg (Robinson et al., 2010).
Pathway analysis
Gene regulation was scored according to the signed P-value metric, and these preranked data were subject to GSEA-P analysis using the ‘classic’ algorithm with REACTOME gene sets (Subramanian et al., 2007; Fabregat et al., 2016).
Quantification of isolated RNA (qRT-PCR)
Total islet RNA was isolated and reverse transcribed. Messenger RNA (mRNA) expression was determined in triplicate using TaqMan gene expression assays (Life Technology, Foster City, CA, USA). mRNA levels are expressed relative to 18S or cyclophilin (housekeeping genes) and mIAPP islets cultured at 11.1 mmol/l glucose, using the ΔΔCt method. The housekeeping gene was chosen based on its average Ct value being lower than that of the gene of interest.
Statistical analysis
Non-RNA-seq data are displayed as mean ± SEM, unless otherwise indicated. Statistical significance was determined using Student’s t test or Mann–Whitney U test for non-parametric data on prespecified comparisons.
Unless otherwise specified, a P < 0.05 was considered statistically significant.
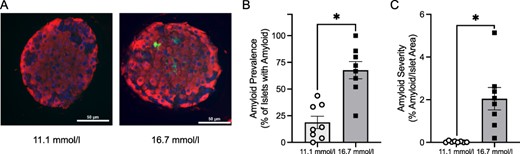
(A) Representative photomicrographs of mIAPP and hIAPP islets cultured at 11.1 or 16.7 mmol/l glucose for 48 h and stained for amyloid with thioflavin S (green) and for β-cells with an insulin antibody (red). Quantification of (B) amyloid prevalence and (C) amyloid severity of mIAPP and hIAPP islets cultured at 11.1 or 16.7 mmol/l glucose. n = 8 per condition.
Results
Histological characteristics of islet preparations
Quantification of islet amyloid prevalence (proportion of islets containing amyloid) and severity (proportion of islet area occupied by amyloid) for the first series of eight experiments that were used for RNA-seq are illustrated in Fig. 2. Amyloid was present in 67.7 ± 8.1% of hIAPP islets cultured at 16.7 mmol/l glucose and 18.8 ± 5.8% at 11.1 mmol/l glucose (P = 0.0156). The severity of amyloid deposition was greater in hIAPP islets cultured at 16.7 mmol/l glucose (2.05 ± 0.52 vs. 0.03 ± 0.12%; P = 0.0078). As expected, islet amyloid was not present in mIAPP islets cultured at either glucose concentration.
In the second series of six experiments used for qRT-PCR, amyloid prevalence and amyloid severity were also greater in hIAPP islets cultured at 16.7 mmol/l glucose. Again, no amyloid was present in mIAPP islets (data not shown).
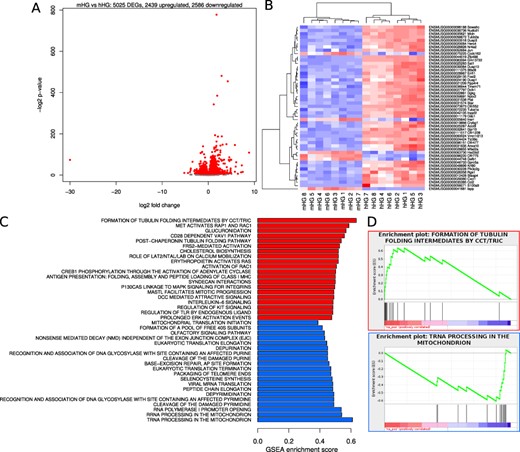
Gene expression differences due to glucose and amyloid. The effect of glucose and amyloid was determined by comparing gene expression profiles in mIAPP and hIAPP islets cultured for 48 h at elevated (16.7 mmol/l) glucose. (A) Smear plots of differential gene expression. Red points denote statistical significance (FDR < 0.05). (B) Heatmap of 50 genes with most significant P values. (C) Barplot of reactome pathway regulation. The most extreme 20 gene sets by enrichment score after filtering for significance (FDR < 0.05). Red bars denote upregulation and blue bars downregulation. (D) GSEA enrichment plots for tubulin folding intermediates by CCT/TRIC and tRNA processing in mitochondria.
Transcriptome sequence data
mRNA-seq was performed with n = 8 replicates, with each data set containing 26–59 million reads (mean = 37.4 M; SD = 7.45 M). A high proportion of reads mapped uniquely (mean = 76.6%; SD = 0.08%). The number of assigned reads varied between 16 and 43 million per sample (mean = 23.8 M; SD = 5.7 M).
Analysis of the differential effects of glucose and amyloid
We undertook three comparisons to identify genes and reactomes that are differentially expressed by amyloid or glucose. The results of these comparisons are presented in the following sections.
Contrast in gene expression between hIAPP and mIAPP islets cultured at 16.7 mmol/l glucose—effect of amyloid in the absence of glucose differences
This analysis examined the effect of amyloid per se by comparing mIAPP and hIAPP islets cultured at 16.7 mmol/l glucose, i.e. the presence of amyloid without a difference in glucose. Under these conditions, we found 5025 genes were changed, with 2439 upregulated and 2586 downregulated as shown in a smear plot (Fig. 3A). A heatmap of 50 genes with the most significant P values revealed that in hIAPP islets, 44 of the genes were upregulated (red) and just six were downregulated (blue) (Fig. 3B). The reactome pathway analysis revealed that this represented 334 upregulated and 54 downregulated pathways. Barplots of the most extreme 20 gene sets filtered for significance (FDR < 0.05) that were upregulated (red) and downregulated (blue) by amyloid (in the absence of differences in glucose) are illustrated in Fig. 3C. The most upregulated pathway was the formation of tubulin folding intermediates by CCT/TRIC and most downregulated pathway being the tRNA processing in the mitochondria. The Gene Set Enrichment Analysis (GSEA) for these two pathways are illustrated in Fig. 3D.
Contrast in gene expression between hIAPP islets cultured at 11.1 and 16.7 mmol/l glucose—effect of amyloid in the presence of elevated glucose
To determine the effect of amyloid and elevated glucose together, we compared gene expression in hIAPP islets cultured at 11.1 vs. 16.7 mmol/l glucose. We found 10976 genes were altered, of which 5371 were upregulated and 5605 downregulated (Fig. 4A). Of the 50 genes with the most significant P values, 46 were upregulated (red) and only 4 were downregulated (blue) by amyloid and high glucose (Fig. 4B). In this instance, reactome pathway analysis showed that 248 gene sets were upregulated and 52 downregulated. The top 20 gene sets that were up- and downregulated are illustrated in Fig. 4C). Rho GTPases that activate IQGAPs was the most extreme upregulated pathway by enrichment score, while viral mRNA translation was the most downregulated (Fig. 4D).
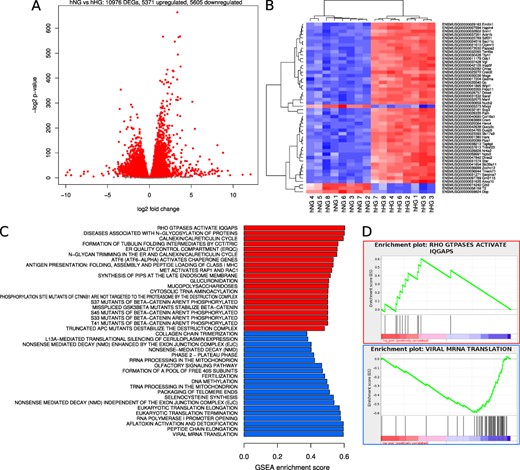
Gene expression differences due to amyloid. The effect of amyloid was determined by comparing gene expression profiles in hIAPP islets cultured for 48 h at normal (11.1 mmol/l) glucose to those cultured at elevated (16.7 mmol/l) glucose. (A) Smear plots of differential gene expression. Red points denote statistical significance (FDR < 0.05). (B) Heatmap of 50 genes with most significant P values. (C) Barplot of reactome pathway regulation. The most extreme 20 gene sets by enrichment score after filtering for significance (FDR < 0.05). Red bars denote upregulation and blue bars downregulation. (D) GSEA enrichment plots for Rho GTPases that activate IQGAPS and viral mRNA translation.
Contrast in gene expression between mIAPP islets cultured at 11.1 and 16.7 mmol/l glucose—effect of glucose in the absence of amyloid
We examined the effect of glucose per se by comparing mIAPP islets cultured at 11.1 and 16.7 mmol/l glucose. Differential changes were observed in 7494 genes, of which 3782 were upregulated and 3712 downregulated (Fig. 5A). A heatmap of the 50 genes with the most significant P values showed that in islets cultured at 16.7 mmol/l glucose, 49 were upregulated (red) and just 1 was downregulated (blue; Fig. 5B). Considering the reactomes, this represented 255 upregulated and 57 downregulated gene sets. The top 10 for each are illustrated in Fig. 5C). Gene sets with the most extreme enrichment scores were calnexin/calreticulin cycle (positive regulation) and peptide chain elongation (negative regulation; Fig. 5D).
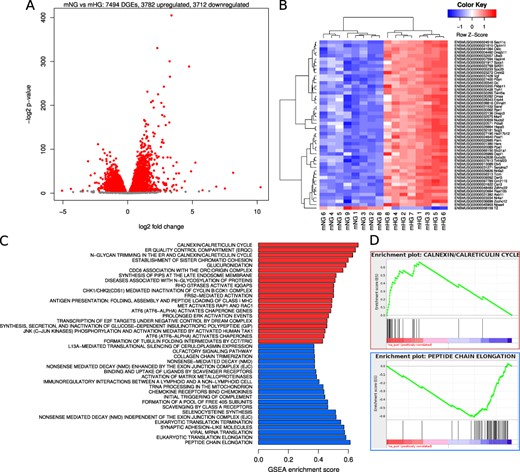
Gene expression differences due to glucose. The effect of glucose was determined by comparing gene expression profiles in mIAPP islets cultured for 48 h at normal (11.1 mmol/l) glucose to those cultured at elevated (16.7 mmol/l) glucose. (A) Smear plots of differential gene expression. Red points denote statistical significance (FDR < 0.05). (B) Heatmap of 50 genes with most significant P values. (C) Barplot of reactome pathway regulation. The most extreme 20 gene sets by enrichment score after filtering for significance (FDR < 0.05). Red bars denote upregulation and blue bars downregulation. (D) GSEA enrichment plots for calnexin/calreticulin and peptide chain elongation.
Evaluation of novel genes selectively upregulated by amyloid
Based on a comparison of RNA-seq data for each set of 50 genes, we identified seven that were common to comparisons of amyloid in the absence of difference in glucose and amyloid in the presence of elevated glucose, but were not in the top 50 genes identified in the comparison of glucose in the absence of amyloid. Of these seven genes, steroidogenic acute regulatory protein (Star) was one of the two most highly upregulated genes, with it alone demonstrating no evidence of an effect of glucose independent of amyloid to increase gene expression.
In the RNA-seq analysis comparing the effect of amyloid in the absence of glucose differences (16.7 mmol/l for both genotypes; Fig. 3B), Star was differentially upregulated 3.0 log2-fold (P = 6.76 E − 56), with the average number of reads in hIAPP islets being 4345 and in mIAPP islets 417. Under conditions examining the effect of amyloid in the presence of elevated glucose (Fig. 4B), expression of Star was differentially increased by 3.9 log2-fold (P = 7.17 E − 128), with an average number of 4345 reads in hIAPP islets cultured at 16.7 mmol/l glucose and 210 at 11.1 mmol/l glucose.
qRT-PCR confirmed the selective increase in expression of this cholesterol transport protein with amyloid formation (Fig. 6A). Furthermore, we found STAR protein to be detectable in both mIAPP and hIAPP islets at 11.1 mmol/l glucose, with the amount increased only in hIAPP islets under amyloidogenic conditions (Fig. 6B).
Confirmation of differentially regulated genes identified by RNA-seq
To confirm our RNA-seq observations that had highlighted the upregulation of Star, we used qRT-PCR to validate genes that had previously been described to be either upregulated, downregulated or not altered by islet amyloid formation or long-term elevated glucose. The genes we selected had also been identified by comparisons in the RNA-seq analysis, but were not necessarily amongst the 50 genes that had changed most significantly.
Genes differentially regulated by amyloid
Amyloid fibril formation by hIAPP is known to increase the expression of a number of genes, including c-Jun (Jun), chemokine (C-X-C motif) ligand 1 (Cxcl1) and tumor necrosis factor-alpha (Tnf) (Westwell-Roper et al., 2011, 2014b; Subramanian et al., 2012; Meier et al., 2014; Templin et al., 2017). The RNA-seq analysis comparing amyloid in the absence of glucose differences (mIAPP and hIAPP islets at 16.7 mmol/l glucose) demonstrated log2-fold changes in these three genes in keeping with increased gene expression. The log2-fold changes were quantified as 1.37 (P = 6.34 E − 40), 5.90 (P = 6.83 E − 119) and 1.69 (P = 0.0001) for Jun, Cxcl1 and Tnf, respectively. Additionally, RNA-seq examining the effect of amyloid in the presence of elevated glucose (hIAPP islets at 11.1 and 16.7 mmol/l glucose) demonstrated log2-fold changes in Jun of 1.12 (P = 7.87 E − 23), Cxcl1 6.63 (P = 1.98 E − 100) and Tnf 1.46 (P = 6.00 E − 5).
Fig. 7A–C illustrates the mRNA expression levels quantified by qRT-PCR in mIAPP and hIAPP islets cultured at 11.1 and 16.7 mmol/l glucose for each of these genes. In keeping with our RNA-seq data and the literature (Westwell-Roper et al., 2011, 2014b; Subramanian et al., 2012; Meier et al., 2014; Templin et al., 2017), amyloid formation independent of glucose (mIAPP vs. hIAPP at 16.7 mmol/l glucose) was associated with increases in Jun (Fig. 7A), Cxcl1 (Fig. 7B) and Tnf (Fig. 7C). Furthermore, amyloid formation in the presence of elevated glucose increased Jun and Cxcl1 expressions. However, under these conditions, Tnf expression did not increase with amyloid formation as glucose independently decreased Tnf expression in the absence (mIAPP in 11.1 vs. 16.7 mmol/l glucose) and presence of amyloid (hIAPP in 11.1 vs. 16.7 mmol/l glucose).
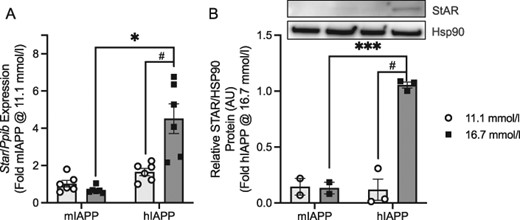
Steroidogenic acute regulatory protein (STAR). (A) mRNA levels quantified by qRT-PCR relative to the housekeeping gene cyclophilin (Ppib) and (B) protein. An example of STAR protein expression on western blot is provided along with quantification of its levels in mIAPP and hIAPP islets cultured at 11.1 or 16.7 mmol/l glucose for 48 h. n = 6 for mRNA and n = 2–3 for protein. The primary comparison (***P < 0.0005) is hIAPP and mIAPP islets cultured at 16.7 mmol/l glucose (dark bars), and the secondary comparison (#P < 0.05) is hIAPP islets cultured at 11.1 and 16.7 mmol/l glucose (light and dark bars, respectively).
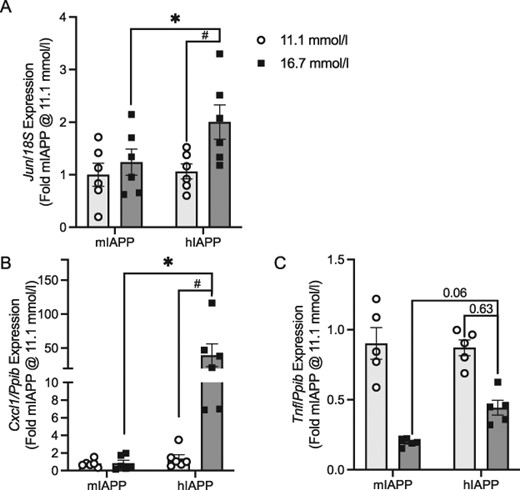
Confirmation of RNA-seq identified genes differentially regulated by amyloid. Panels (A–C) illustrate fold changes in gene expression as measured by qRT-PCR. Each mRNA expression level is calculated relative to a housekeeping gene (18S or cyclophilin, Ppib) and expressed as fold change relative to mIAPP islets cultured at 11.1 mmol/l glucose for 48 h. The primary comparison (*P < 0.05) is hIAPP and mIAPP islets cultured at 16.7 mmol/l glucose (dark bars), and the secondary comparison (#P < 0.05) is hIAPP islets cultured at 11.1 and 16.7 mmol/l glucose (light and dark bars, respectively). n = 6. Jun = c-Jun, Cxcl1 = chemokine (C-X-C motif) ligand 1 and Tnf = tumor necrosis factor-alpha.
Genes differentially regulated by glucose
Prohormone convertase 1/3 (Pcsk1) is involved in propeptide processing in endocrine cells including islet cells, and its expression is known to increase when glucose is elevated (Moran et al., 2012; Ottosson-Laakso et al., 2017). According to the RNA-seq analysis comparing mIAPP islets at 11.1 and 16.7 mmol/l glucose, the log2-fold change in this gene was 2.31 (P = 8.41 E − 24), in keeping with an increase in expression. Fig. 8A illustrates the fold increase in gene expression for Pcsk1 as measured by qRT-PCR for mIAPP and hIAPP islets cultured at 11.1 and 16.7 mmol/l glucose. These results confirm that glucose modifies expression of this gene, with the change in mIAPP islets representing the effect of glucose independent of amyloid.
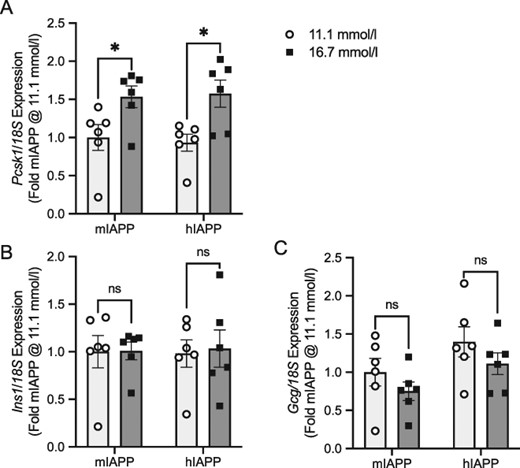
Confirmation of RNA-seq identified genes differentially regulated by glucose. Panels (A–C) illustrate fold changes in gene expression as measured by qRT-PCR. Each mRNA expression level is calculated relative to a housekeeping gene (18S or cyclophilin, Ppib) and expressed as fold change relative to mIAPP islets cultured at 11.1 mmol/l glucose for 48 h. The primary comparison (*P < 0.05) is mIAPP islets cultured at 11.1 mmol/l glucose (light bars) and 16.7 mmol/l glucose (dark bars). The secondary comparison (#P < 0.05) is hIAPP islets cultured at 11.1 mmol/l glucose (light bars) and 16.7 mmol/l glucose (dark bars). n = 5–6. Pcsk1 = Prohormone convertase 1/3, Ins1 = insulin 1, Gcg = glucagon.
Production of insulin and glucagon (Ins1 and Gcg) is known to be transcriptionally and translationally regulated. Acute exposure to elevated glucose (<2 h) is known to increase insulin gene transcription (Leibiger et al., 1998), while more long-term exposure (>24 h) of β-cell lines to glucose typically results in no change or decreased mRNA levels (Poitout and Robertson, 2008). Regulation of glucagon gene expression by glucose has been difficult to separate from the effect of insulin, with studies suggesting that insulin may be a more critical determinant than glucose (Philippe, 1989; Magnan et al., 1995; Dumonteil et al., 1998). In keeping with these observations, the RNA-seq analysis did not identify these genes to be significantly altered by glucose and we confirmed this with qRT-PCR (Fig. 8B for Ins1 and Fig. 8C for Gcg).
Discussion
We report for the first time a comprehensive RNA-seq analysis of the effect of amyloid to modify islet gene expression. Simultaneously, given our study design, we were also able to discern the effect of elevated glucose per se to change gene expression in islets. With this approach, we have identified reactomes that are unique to both amyloid and glucose. These data provide the basis for better understanding the molecular and genetic mechanisms by which amyloid exerts positive and negative effects on the islet.
The power of RNA-seq to identify previously unrecognized changes in gene expression is exemplified by our observation that steroidogenic acute regulatory protein (Star) was increased by islet amyloid, which we confirmed quantitatively in separate experiments with both RT-PCR and protein measurements. This member of the Star related lipid transfer domain containing (STARD) family of lipid transport proteins is well recognized as critically important in moving cholesterol from the outer to inner mitochondrial membrane for subsequent metabolism by Cyp11a1 to pregnenolone (Clark et al., 1994; Anuka et al., 2013). Aside from typical steroid producing tissues where it results in production of glucocorticoids, mineralocorticoids and sex steroids (Payne and Hales, 2004), it is also found in several non-classical steroidogenic tissues. Examples include the liver where the result is bile acid production (Hall et al., 2005; Pikuleva and Waterman, 2013), the brain where it enables de novo neurosteroid synthesis (Mensah-Nyagan et al., 1999) and macrophages where it leads to the production of oxysterol metabolites that ultimately increase Abca1 transcription and cholesterol efflux (Fu et al., 2001). Thus, our gene expression and protein data provide the first evidence that this protein is in islets and its expression can be differentially regulated. Further work is now required to better understand what role it plays in normal islet function and under pathophysiological conditions such as type 2 diabetes.
We also observed differences in gene expression when grouped into biological pathway sets, often referred to as reactomes. Amongst these were immune system pathways, which included changes in reactomes representing the adaptive immune response and cytokine signaling, both of which have been invoked with amyloid formation in islets (Westwell-Roper et al., 2011, 2014a; Meier et al., 2014). We also identified the reactome comprising genes involved in mitochondrial function, which is of interest as islet amyloid is known to adversely affect mitochondrial health (Zraika et al., 2009; Fan et al., 2010). Star was identified in metabolism, metabolism of lipids, metabolism of steroid hormones, metabolism of steroids and pregnenolone biosynthesis reactomes, which are keeping with its known role in other tissues (Anuka et al., 2013). Based on these observations, we believe analysis of gene expression profiles and their integration into biological networks has the potential to identify previously unrecognized molecular pathways that may be activated or suppressed by islet amyloid and contribute to its deleterious consequences.
The effects of amyloid and glucose on mRNA and protein expression of a number of different molecules have been described. We chose to determine the veracity of our RNA-seq approach using qRT-PCR to confirm the differential expression of some of these genes, which we and others have previously reported. With this multistepped approach, we found agreement with the literature for genes that have previously been shown to change, for example Jun, Cxcl1 and Tnf (Westwell-Roper et al., 2011, 2014b; Subramanian et al., 2012; Meier et al., 2014; Templin et al., 2017). In other instances, such as the insulin gene, we found no change. Interestingly, we were also able to identify changes in genes that are not specifically islet endocrine cell related, but more typically arise from other cell types that are more sparsely represented in the islet. An example is macrophages, which participate in the immune response to amyloid deposition both in vitro and in vivo (Westwell-Roper et al., 2011, 2014b; Meier et al., 2014).
For these studies, we purposefully used islets from mice expressing mIAPP or hIAPP, both driven by the endogenous mouse IAPP promoter, as this allowed us to explicitly determine the effect of islet amyloid deposition to up- and downregulate genes. Including glucose in the experimental paradigm was vital as in vitro induction of amyloid formation in islets typically requires that they be cultured in an elevated glucose concentration (Zraika et al., 2007). Given that we included mIAPP islets with no potential to form amyloid, we were able to assess the independent role of glucose to alter gene expression and thus delineate genes that would appear to be amyloid specific. This approach using mouse islets is important since human islets normally produce amyloidogenic hIAPP, which is co-secreted with insulin, and have the propensity to form amyloid (Kahn et al., 1990; Westermark et al., 1990). Thus, using only human islets would not allow for the discernment of the effect of amyloid from that of increased glucose per se. As human and mouse islets differ in some ways morphologically and functionally (Dai et al., 2012; Brissova et al., 2015), it is possible that certain of our observations may not be applicable to human islets. Thus, we believe the potential for species differences must be considered when extrapolating findings to humans.
Our approach using mouse islets and RNA-seq to identify differences in gene expression could also be used to identify other changes in the transcriptional machinery that could result from amyloid formation or elevated glucose. Examples of these could be epigenetic changes such as DNA methylation, histone modification and microRNA expression, which are known to be important modifiers of gene expression (Thorrez et al., 2011; Keating et al., 2018). Further work is clearly required to better understand whether such epigenetic changes are occurring with islet amyloid deposition and if they could be involved in determining some of the differences in the gene expression profiles we observed.
In conclusion, we have used RNA-seq to determine differential gene expression in islets in response to amyloid deposition and elevated glucose and found a number of different genes and gene sets that are modified. These data provide an opportunity for further exploration to determine whether they act to enhance, protect, or harm the β-cell.
Author contributions
All authors researched data. M.F.H. and S.E.K. drafted the manuscript, and all other authors reviewed/edited the manuscript.
Conflict of interest
There are no relevant dualities of interest.
Funding
This study was supported by a Merit Review [I01 BX001060] from the Department of Veterans Affairs [to S.E.K.], Dick and Julia McAbee Endowed Fellowship in Diabetes Research from the University of Washington and an American Diabetes Association Fellowship Award [1-18-PDF-174] [to M.F.H.], Belgian American Educational Foundation Postdoctoral Fellowship and French Society of Diabetes Young Francophone Researcher Postdoctoral Fellowship [to N.E.], and NIH grant [F32 DK107022] and a [CDA-2 IK2 BX004659] from the Department of Veterans Affairs [to A.T.T.]. Assam El-Osta is a National Health and Medical Research Council (NHMRC) Senior Research Fellow [1154650] supported by NSFC-NHMRC International Joint Call [1113188]. We acknowledge the University of Washington Diabetes Research Center funded by National Institutes of Health grant [P30 DK017047] for islet isolations and immunohistochemistry, and the Australian Genome Research Facility supported by the Australian Government for high-throughput sequencing.
Acknowledgments
The authors wish to thank N.L.E. (Mayo Clinic and Foundation, Rochester, MN, USA) for providing the transgenic mice, C.W.-S., S.M. and D.H for technical assistance, and members of the Metabolism Group at VAPSHCS for critical input during the preparation of this manuscript.
References
Author notes
Meghan F. Hogan and Mark Ziemann contributed equally to this work.
