


Abstract
Mechanisms of fractional crystallization with simultaneous crustal assimilation (AFC) are examined for the Kutsugata and Tanetomi lavas, an alkali basalt–dacite suite erupted sequentially from Rishiri Volcano, northern Japan. The major element variations within the suite can be explained by boundary layer fractionation; that is, mixing of a magma in the main part of the magma body with a fractionated interstitial melt transported from the mushy boundary layer at the floor. Systematic variations in SiO2 correlate with variations in the Pb, Sr and Nd isotopic compositions of the lavas. The geochemical variations of the lavas are explained by a constant and relatively low ratio of assimilated mass to crystallized mass (‘r value’). In the magma chamber in which the Kutsugata and Tanetomi magmas evolved, a strong thermal gradient was present and it is suggested that the marginal part of the reservoir was completely solidified. The assimilant was transported by crack flow from the partially fused floor crust to the partially crystallized floor mush zone through fractures in the solidified margin, formed mainly by thermal stresses resulting from cooling of the solidified margin and heating of the crust. The crustal melt was then mixed with the fractionated interstitial melt in the mushy zone, and the mixed melt was further transported by compositional convection to the main magma, causing its geochemical evolution to be characteristic of AFC. The volume flux of the assimilant from the crust to the magma chamber is suggested to have decreased progressively with time (proportional to t−1/2), and was about 3 × 10⁻² m/year at t = 10 years and 1 × 10⁻² m/year at t = 100 years. It has been commonly considered that the heat balance between magmas and the surrounding crust controls the coupling of assimilation and fractional crystallization processes (i.e. absolute value of r). However, it is inferred from this study that the ratio of assimilated mass to crystallized mass can be controlled by the transport process of the assimilant from the crust to magma chambers.
INTRODUCTION
It has been widely recognized that magmas undergoing fractional crystallization can simultaneously assimilate the surrounding crust, as a consequence of heat transfer from hot magmas to the cool crust. Because of the importance of, and interest in, the geochemical and dynamical phenomena associated with assimilation and fractional crystallization (AFC), the underlying physics (Campbell & Turner, 1987; Huppert & Sparks, 1988; Kaneko & Koyaguchi, 2004; Leitch, 2004) and the geochemical consequences of the required mass and energy balance (DePaolo, 1981; Spera & Bohrson, 2001; Thompson et al., 2002) have received considerable attention. AFC has also been investigated extensively from a geological approach (Grove et al., 1988; Davidson & Wilson, 1989; Grunder, 1992; Reiners et al., 1996; Caffe et al., 2002). However, there is still a shortage of good field examples constrained by geological observations and detailed geochemistry, which can be used to test the various hypotheses for AFC.
Laboratory experiments, with associated theoretical analyses, can provide a framework for understanding the fundamentals that control dynamics in magma chambers. However, it is difficult to understand natural magmatic processes solely with this approach, when the phenomenon under consideration proceeds through couplings of several fundamental processes, such as crystallization, crystal–melt separation, melting of the crust and transport of the crustal melt. This is because analogue materials used in laboratory experiments obviously have very different physical properties from those of silicate magmas, and it is impossible to fit the scalings of physical properties of the materials to those of magmas that are appropriate for all of the fundamental processes.
On the other hand, a geological approach has the potential to extract direct information on AFC involved in individual magmatic systems, through careful examination of the couplings of the fundamental processes. However, few studies have elucidated the mechanisms responsible for AFC processes. The previous studies have used geochemical data to evaluate AFC in terms of the well-known model of DePaolo (1981). This model gives a useful quantitative index of AFC, as represented by an r value (the ratio of assimilated mass to crystallized mass). However, the AFC model considers the mass balance solely from a mathematical point of view, and does not predict the mechanism of the process (Jaupart & Tait, 1995). In addition, magmatic evolution commonly involves processes other than AFC, such as repeated injection of primitive magmas, and, therefore, it is not easy to restore the information on AFC from rocks by removing the information overprinted by the other processes.
In this study, we investigate mechanisms of AFC processes involved in the evolution of the Kutsugata and Tanetomi lavas, an alkali basalt–dacite suite erupted sequentially from Rishiri Volcano, northern Japan. The Kutsugata and Tanetomi lavas have been the subject of detailed petrological studies, and it has been shown that variations in major element compositions of the two lava types can be explained principally by fractional crystallization, accompanied by minor magma replenishment (Kuritani, 1999b, 2001). In addition, it has been found in this study that these lavas have undergone low levels of crustal assimilation. They therefore provide an excellent opportunity to investigate the mechanisms of the low-r AFC. To detect accurately the variations of isotopic compositions and trace element concentrations of the lavas, high-quality geochemical data have been obtained for the lavas, using advanced analytical techniques developed in our laboratory.
This study tries to elucidate mechanisms of AFC for the case of low r value, and concentrates on (1) how the assimilant was transported from the partially fused crust to molten magmas through the completely solidified margin of the magma chamber, and (2) how the geochemical signature of crustal assimilation was coupled to fractional crystallization in the magma chamber. Factors that control the ratio of assimilated mass to crystallized mass (i.e. absolute value of r) are also considered.
GEOLOGICAL SETTING
Rishiri is an island stratovolcano located west of Hokkaido, northern Japan (Fig. 1). Quaternary alkali basalt and calc-alkaline andesite make up a large part of the volcano (Kobayashi, 1987; Ishizuka, 1999). The geology of Rishiri Volcano was described in detail by Ishizuka (1999). The Kutsugata and Tanetomi lavas have erupted sequentially from the western flank of the volcano (Fig. 1), and are high Na/K alkali basalt and trachytic andesite, respectively. The activity of these lavas belongs to the L-1 stage of Ishizuka (1999), and is clearly discriminated from the former activity of calc-alkaline andesite magmas (Middle stage) and the later activity of low Na/K alkali basalt magmas (L-2 stage) (Ishizuka, 1999). The Kutsugata lava is dated at 37 ka bp (Miura & Takaoka, 1993). Although the eruption age of the Tanetomi lava has not been determined, the lava directly overlies the Kutsugata lava without any clear hiatus.
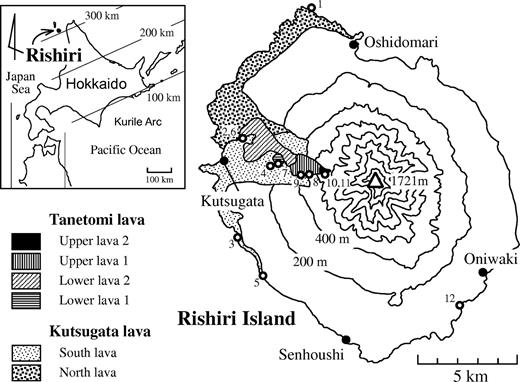
Inset map showing the location of Rishiri Island, and a geological map of the Kutsugata and Tanetomi lavas showing sampling localities (numbers in Table 1). Parallel lines in the inset map indicate the depth of the Wadati–Benioff zone beneath Hokkaido. The sampling locality of the crustal granodioritic rocks is also shown (number 12).
The Kutsugata lava is exposed on the northwestern and western part of Rishiri Island and is also distributed on the sea floor, with a total volume of about 3 km3 (Ishizuka, 1999) (Fig. 1). The lava is widely covered by fan deposits, especially those distributed on the northwestern and western flank of the volcano. The lava consists of numerous pahoehoe lava flow units, 0·2–5 m thick, and no clinker is present between the flows. In relatively thick flow units (>3 m), segregation veins, which formed after eruption (Yoshida et al., 1981), are observed. On the basis of chemical and petrographic criteria, the Kutsugata lava has been divided into the North and South lavas, distributed in the northern and southern parts of the Kutsugata lava field, respectively (Fig. 1). Although direct contact between the North and South lavas is not exposed, the boundary delineated by dense sampling and topographic features in the vicinity of the boundary suggests that the North lava pre-dates the South lava (Kuritani, 1998).
The Tanetomi lava, with a volume of about 0·1 km3, consists of two main flow units, the Lower and Upper lavas (Fig. 1). The Upper lava is terminated with a cliff ∼50 m in height and directly overlies the Lower lava. The Lower lava is composed of Lower lava 1 and Lower lava 2, with the latter overlying the former. The Upper lava has also been further divided into Upper lava 1 and Upper lava 2 on the basis of the chemistry (Kuritani, 2001). No air-fall or pyroclastic-flow deposits are found in the Tanetomi lava.
In addition to samples of the Kutsugata and Tanetomi lavas, boulders of granodiorite, up to 15 cm in diameter, were collected from fan deposits on the southeastern coast of the island (sample locality 12 in Fig. 1). They may have originally been exposed on the island before the main activity of Rishiri Volcano started. Similar rocks to the collected granodiorite samples are believed to have constituted the crust beneath Rishiri Volcano and were a potential source of crustal contamination in magma chambers beneath the volcano.
ANALYTICAL METHODS
Whole-rock major and trace elements, and Sr, Nd, Pb and B isotopic compositions were measured at the Pheasant Memorial Laboratory (PML), Institute for Study of the Earth's Interior, Okayama University at Misasa (Nakamura et al., 2003). Rock specimens were crushed by a jaw crusher to coarse chips 3–5 mm in diameter, from which fresh chips were carefully hand-picked. The chips were rinsed with deionized water in an ultrasonic bath at least three times, and then they were dried at 100°C for 12 h. The washed chips were ground using an alumina puck mill.
Concentrations of major elements, Ni and Cr were obtained by X-ray fluorescence spectrometry (XRF) on glass beads containing a lithium tetraborate flux (10 to 1 dilution of sample) using a Phillips PW2400 instrument (Takei, 2002). Loss on ignition (LOI) was obtained gravimetrically, and the FeO content was determined by the titration method of Yokoyama & Nakamura (2002). Trace elements were analyzed by inductively coupled plasma mass spectrometry (ICP-MS) using a Yokogawa PMS2000 system fitted with a flow injection system, by the methods of Makishima & Nakamura (1997), Makishima et al. (1997, 1999), Yokoyama et al. (1999) and Moriguti et al. (2004). Boron, Li, Zr and Hf were determined by isotope dilution (ID) and other trace elements by the calibration-curve method. Concentrations of Pb were also obtained by isotope dilution thermal ionization mass spectrometry (ID-TIMS) using a modified Finnigan MAT261 instrument (Nakano & Nakamura, 1998) with the NBS983 standard. Trace element concentrations in the granodiorite sample were determined by the Mg-addition method using Teflon bombs (Takei et al., 2001). All of the major and trace elements analyses were duplicated for each sample, and replicate analyses always had <0·5 relative % and 3–5 relative % difference, for major and trace elements, respectively. The analytical reproducibility for the determination of Pb concentration by ID-TIMS is better than 0·5%.
The analytical procedures for chemical separation and mass spectrometry followed Yoshikawa & Nakamura (1993) for Sr isotope measurements, Makishima & Nakamura (1991) for Nd, Kuritani & Nakamura (2002) for Pb and Nakamura et al. (1992) for B. To remove the effect of sea-water alteration, powders of Kutsugata lava samples that were collected from coastal areas were leached with 6N HCl at 100°C for about 8 h, before acid digestion. For isotopic analysis of granodiorite samples, acid digestion was performed also using the Mg-addition method of Takei et al. (2001). Mass spectrometry was carried out with the same TIMS system as described above, in static multi-collection mode. Normalizing factors to correct isotopic fractionation during spectrometer analysis are 86Sr/88Sr = 0·1194 for Sr and 146Nd/144Nd = 0·7219 for Nd. The isotopic compositions of NBS987 and LaJolla standards are 87Sr/86Sr = 0·710240 and 143Nd/144Nd = 0·511839, respectively (Makishima & Masuda, 1994). For Pb isotope analysis, the correction of mass fractionation was carried out by the normal double spike method using a 207Pb–204Pb spike, as described by Kuritani & Nakamura (2003). The recommended isotopic composition of NBS981 standard in our laboratory is 206Pb/204Pb = 16·9424, 207Pb/204Pb = 15·5003, and 208Pb/204Pb = 36·7266 (Kuritani & Nakamura, 2003). The average isotopic composition of NBS951 boric acid, measured in the course of this study, is 11B/10B = 4·0511. Analytical reproducibility (2σ) for natural rock samples is typically 0·002% for 87Sr/86Sr, 0·0004% for 143Nd/144Nd, 0·008%, 0·006%, and 0·006% for 206Pb/204Pb, 207Pb/204Pb, and 208Pb/204Pb, respectively, and 0·06% for 11B/10B.
WHOLE-ROCK COMPOSITION
Whole-rock major and trace element contents for representative samples numbered in Fig. 1 are listed in Table 1. Figure 2 shows Harker variation diagrams for some major element oxides (TiO2, MgO, CaO, K2O) and Pb plotted against SiO2 content, and trace element concentrations normalized to the values of normal-type mid-ocean ridge basalt (N-MORB) (Sun & McDonough, 1989). The products of both the Kutsugata and Tanetomi lavas form a series of smooth compositional trends. Compared with the Tanetomi lava, the compositions of the Kutsugata lava show slightly more scatter. This is considered to reflect the modification of whole-rock compositions by formation of segregation veins after eruption (Yoshida et al., 1981), although this effect has been removed as much as possible by the method described by Kuritani (1998). The MgO and CaO contents decrease with increasing SiO2 content, more so in the Kutsugata lava than in the Tanetomi lava. The rate of increase in K2O and Pb contents with increase of SiO2 content is slightly higher in the Kutsugata lava than in the Tanetomi lava. A small compositional gap is present between the North and South lavas of the Kutsugata lava (inset in the CaO–SiO2 diagram).
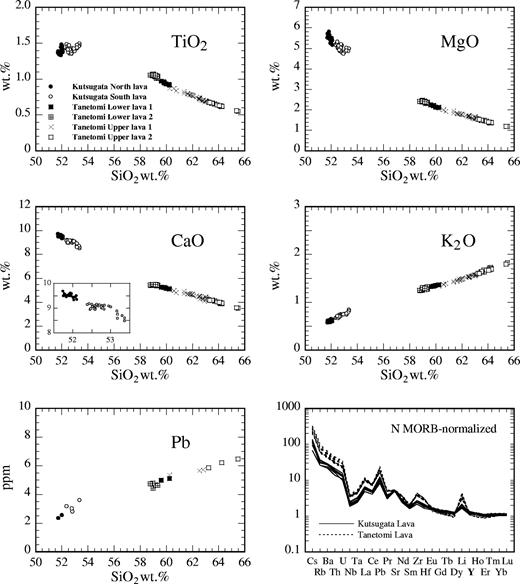
SiO2 variation diagrams for some major element oxides (TiO2, MgO, CaO, K2O) and Pb, and N-MORB-normalized trace element patterns of the Kutsugata and Tanetomi lavas. Trace element concentrations of N-MORB are from Sun & McDonough (1989). An enlarged diagram for the Kutsugata lava samples is shown in the CaO–SiO2 diagram.
Representative whole-rock compositions of the Rishiri lavas and a sample of basement granodiorite
| Kutsugata lava | Tanetomi lava | Granodiorite | ||||||||||||||||||||||
|---|---|---|---|---|---|---|---|---|---|---|---|---|---|---|---|---|---|---|---|---|---|---|---|---|
| North lava | South lava | Lower 2 | Lower 1 | Upper 1 | Upper 2 | |||||||||||||||||||
| 1 | 2 | 3 | 4 | 5 | 6 | 7 | 8 | 9 | 10 | 11 | 12 | |||||||||||||
| Sample: | Fm-15 | Ta-26 | Km-8 | Kr-28 | Km-6 | Ta-29 | Kr-74 | Kr-72 | Kr-64 | Kr-47 | Kk-31 | Nm-3 | ||||||||||||
| Major elements (wt %) | ||||||||||||||||||||||||
| SiO2 | 52·06 | 52·00 | 52·43 | 53·03 | 53·61 | 58·52 | 60·03 | 62·57 | 63·26 | 63·95 | 65·41 | 65·87 | ||||||||||||
| TiO2 | 1·39 | 1·40 | 1·42 | 1·43 | 1·50 | 1·05 | 0·91 | 0·72 | 0·68 | 0·61 | 0·55 | 0·52 | ||||||||||||
| Al2O3 | 17·63 | 17·57 | 17·50 | 17·33 | 16·61 | 17·86 | 17·61 | 17·46 | 17·41 | 17·23 | 17·07 | 15·97 | ||||||||||||
| Fe2O3 | 2·61 | 2·84 | 1·68 | 3·14 | 1·63 | 3·77 | 2·48 | 1·63 | 1·58 | 1·45 | 1·30 | 3·21 | ||||||||||||
| FeO | 5·69 | 5·46 | 6·49 | 5·34 | 6·98 | 2·97 | 3·56 | 3·39 | 3·15 | 2·86 | 2·51 | 1·08 | ||||||||||||
| MnO | 0·16 | 0·16 | 0·16 | 0·16 | 0·17 | 0·15 | 0·15 | 0·14 | 0·14 | 0·13 | 0·13 | 0·10 | ||||||||||||
| MgO | 5·74 | 5·50 | 5·23 | 5·16 | 5·01 | 2·41 | 2·11 | 1·68 | 1·55 | 1·38 | 1·20 | 1·61 | ||||||||||||
| CaO | 9·56 | 9·33 | 9·19 | 8·99 | 8·53 | 5·43 | 5·10 | 4·47 | 4·24 | 3·88 | 3·51 | 4·29 | ||||||||||||
| Na2O | 4·23 | 4·18 | 4·22 | 4·14 | 4·47 | 5·34 | 5·47 | 5·70 | 5·73 | 5·74 | 5·87 | 4·60 | ||||||||||||
| K2O | 0·62 | 0·63 | 0·67 | 0·74 | 0·84 | 1·25 | 1·36 | 1·55 | 1·61 | 1·70 | 1·83 | 1·50 | ||||||||||||
| P2O5 | 0·28 | 0·29 | 0·30 | 0·31 | 0·34 | 0·49 | 0·47 | 0·39 | 0·36 | 0·30 | 0·25 | 0·12 | ||||||||||||
| H2O+ | 0·46 | 0·38 | 0·63 | 0·63 | 0·46 | 1·00 | 0·94 | 0·52 | 0·51 | 0·64 | 0·52 | 1·62 | ||||||||||||
| Total | 100·42 | 99·74 | 99·92 | 100·42 | 100·15 | 100·25 | 100·20 | 100·21 | 100·20 | 99·87 | 100·14 | 100·51 | ||||||||||||
| Trace elements (ppm) | ||||||||||||||||||||||||
| Cr* | 158 | 128 | 128 | 108 | 70·4 | 1·5 | 0 | 0 | 0 | 0 | 0 | 0·6 | ||||||||||||
| Ni* | 59·7 | 53·2 | 45·0 | 36·7 | 28·2 | 1·4 | 1·3 | 0 | 0 | 0 | 0 | 1·6 | ||||||||||||
| Li | 7·17 | 8·27 | 8·67 | 7·12 | 8·69 | 12·9 | 13·9 | 16·9 | 17·3 | 18·3 | 19·2 | 19·2 | ||||||||||||
| B | 5·38 | 3·96 | 5·52 | 6·13 | 6·04 | 9·74 | 10·5 | 11·5 | 12·1 | 12·4 | 13·2 | 11·8 | ||||||||||||
| Rb | 14·7 | 14·5 | 17·0 | 19·9 | 20·1 | 35·0 | 35·3 | 43·4 | 42·5 | 48·5 | 55·0 | 47·2 | ||||||||||||
| Sr | 444 | 454 | 466 | 481 | 446 | 509 | 467 | 481 | 431 | 446 | 429 | 436 | ||||||||||||
| Y | 31·2 | 33·3 | 35·0 | 32·4 | 38·5 | 37·0 | 34·7 | 31·8 | 29·8 | 30·2 | 30·7 | 18·5 | ||||||||||||
| Zr | 160 | 180 | 184 | 185 | 199 | 274 | 295 | 314 | 310 | 318 | 325 | 105 | ||||||||||||
| Nb | 4·32 | 4·60 | 5·16 | 5·10 | 5·65 | 7·74 | 8·26 | 8·75 | 8·80 | 8·85 | 9·20 | 4·85 | ||||||||||||
| Cs | 0·47 | 0·79 | 0·77 | 0·95 | 0·86 | 1·49 | 1·54 | 1·87 | 1·84 | 1·99 | 2·21 | 2·45 | ||||||||||||
| Ba | 139 | 148 | 170 | 176 | 181 | 287 | 307 | 342 | 322 | 360 | 403 | 366 | ||||||||||||
| La | 12·1 | 13·9 | 15·2 | 15·8 | 16·5 | 25·5 | 25·4 | 26·6 | 25·9 | 27·8 | 29·2 | 10·9 | ||||||||||||
| Ce | 30·6 | 33·8 | 36·4 | 36·8 | 38·0 | 57·0 | 56·2 | 59·7 | 55·1 | 58·4 | 60·5 | 25·8 | ||||||||||||
| Pr | 3·97 | 4·41 | 4·60 | 4·62 | 5·10 | 6·80 | 6·66 | 7·00 | 6·33 | 6·70 | 6·65 | 3·31 | ||||||||||||
| Nd | 17·5 | 19·6 | 20·5 | 21·0 | 21·4 | 28·5 | 26·5 | 26·7 | 24·5 | 25·2 | 24·1 | 13·2 | ||||||||||||
| Sm | 4·20 | 4·49 | 4·76 | 4·82 | 4·74 | 5·73 | 5·22 | 5·40 | 4·55 | 4·61 | 4·49 | 2·68 | ||||||||||||
| Eu | 1·50 | 1·66 | 1·67 | 1·66 | 1·75 | 1·83 | 1·70 | 1·59 | 1·47 | 1·45 | 1·37 | 0·81 | ||||||||||||
| Gd | 4·64 | 5·00 | 5·41 | 5·33 | 5·43 | 5·90 | 5·30 | 4·84 | 4·48 | 4·45 | 4·31 | 2·56 | ||||||||||||
| Tb | 0·77 | 0·85 | 0·94 | 0·96 | 0·89 | 0·96 | 0·86 | 0·77 | 0·71 | 0·71 | 0·69 | 0·42 | ||||||||||||
| Dy | 5·19 | 5·57 | 5·78 | 5·51 | 5·63 | 5·81 | 5·18 | 4·90 | 4·40 | 4·38 | 4·16 | 2·62 | ||||||||||||
| Ho | 1·12 | 1·19 | 1·25 | 1·20 | 1·21 | 1·26 | 1·10 | 1·06 | 0·95 | 0·97 | 0·91 | 0·58 | ||||||||||||
| Er | 2·83 | 3·20 | 3·33 | 3·31 | 3·26 | 3·37 | 3·06 | 3·03 | 2·62 | 2·68 | 2·63 | 1·73 | ||||||||||||
| Tm | 0·45 | 0·47 | 0·53 | 0·51 | 0·50 | 0·54 | 0·48 | 0·49 | 0·43 | 0·45 | 0·42 | 0·27 | ||||||||||||
| Yb | 3·13 | 3·30 | 3·50 | 3·24 | 3·42 | 3·85 | 3·46 | 3·56 | 3·21 | 3·27 | 3·22 | 2·23 | ||||||||||||
| Lu | 0·48 | 0·46 | 0·50 | 0·50 | 0·52 | 0·57 | 0·53 | 0·54 | 0·50 | 0·50 | 0·50 | 0·33 | ||||||||||||
| Hf | 3·37 | 3·66 | 3·88 | 3·87 | 4·09 | 5·44 | 5·72 | 5·91 | 6·04 | 6·26 | 6·36 | 2·91 | ||||||||||||
| Ta | 0·32 | 0·34 | 0·37 | 0·38 | 0·42 | 0·56 | 0·61 | 0·65 | 0·65 | 0·65 | 0·70 | 0·60 | ||||||||||||
| Pb† | 2·35 | 2·56 | 3·18 | 2·81 | 3·59 | 4·74 | 5·11 | 5·66 | 5·88 | 6·22 | 6·46 | 11·3 | ||||||||||||
| Th | 1·63 | 1·91 | 2·15 | 2·25 | 2·30 | 3·74 | 3·85 | 4·52 | 4·32 | 4·91 | 5·32 | 6·16 | ||||||||||||
| U | 0·51 | 0·47 | 0·59 | 0·64 | 0·66 | 1·11 | 1·16 | 1·37 | 1·35 | 1·49 | 1·60 | 4·79 | ||||||||||||
Determined by XRF.
Determined by isotopic dilution method with TIMS.
The trace element concentration pattern diagram is characterized by negative anomalies of Nb and Ta, and positive spikes in Pb, Sr and Li, which are characteristic of island-arc magmas. It is notable that the concentration patterns of the Kutsugata lava and Tanetomi lava are remarkably similar. Highly incompatible trace elements, such as Cs, Rb and light rare earth elements (LREE), are more enriched in the Tanetomi lava than in the Kutsugata lava. The concentrations of middle REE (MREE) and heavy REE (HREE) in the Tanetomi lava are similar to or slightly lower than those of the Kutsugata lava.
Table 2 lists 87Sr/86Sr, 143Nd/144Nd, 206Pb/204Pb, 207Pb/204Pb, 208Pb/204Pb and 11B/10B ratios of the representative samples of the Kutsugata and Tanetomi lavas in addition to the granodiorite sample, and selected isotopic ratios (87Sr/86Sr, 143Nd/144Nd, 206Pb/204Pb and 207Pb/204Pb) are plotted against SiO2 content in Fig. 3. 87Sr/86Sr, 206Pb/204Pb and 207Pb/204Pb ratios increase and 143Nd/144Nd ratio decreases systematically with increasing SiO2 content, throughout the compositional variation of the Kutsugata and Tanetomi lavas. On the other hand, the 11B/10B ratio of the samples is essentially constant within analytical error (Table 2).
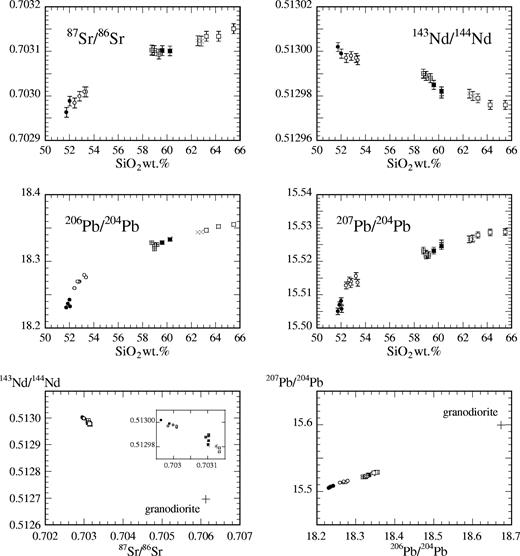
87Sr/86Sr, 143Nd/144Nd, 206Pb/204Pb and 207Pb/204Pb ratios of lava samples plotted against their whole-rock SiO2 contents, and isotopic compositions of lava samples and the granodiorite sample shown in 143Nd/144Nd–87Sr/86Sr and 207Pb/204Pb–206Pb/204Pb diagrams (symbols as in Fig. 2). An enlarged diagram for the lava samples is shown in the 143Nd/144Nd–87Sr/86Sr diagram. Error bars indicate the typical analytical error (2σ). The analytical error of the 206Pb/204Pb ratio is smaller than the symbols.
Whole-rock isotopic compositions of the representative samples
| Sample | 87Sr/86Sr | 143Nd/144Nd | 206Pb/204Pb | 207Pb/204Pb | 208Pb/204Pb | 11B/10B |
|---|---|---|---|---|---|---|
| Fm-15 | 0·702963 | 0·513002 | 18·2306 | 15·5050 | 38·0899 | |
| Ta-26 | 0·702988 | 0·512999 | 18·2423 | 15·5081 | 38·1046 | 4·0368 |
| Km-8 | 0·702984 | 0·512997 | 18·2597 | 15·5128 | 38·1287 | |
| Kr-28 | 0·702999 | 0·512998 | 18·2695 | 15·5139 | 38·1377 | |
| Km-6 | 0·703009 | 0·512996 | 18·2756 | 15·5136 | 38·1387 | |
| Ta-29 | 0·703103 | 0·512990 | 18·3279 | 15·5232 | 38·1957 | |
| Kr-74 | 0·703101 | 0·512982 | 18·3329 | 15·5246 | 38·2026 | |
| Kr-72 | 0·703124 | 0·512981 | 18·3432 | 15·5266 | 38·2152 | |
| Kr-64 | 0·703134 | 0·512979 | 18·3464 | 15·5279 | 38·2204 | 4·0362 |
| Kr-47 | 0·703134 | 0·512976 | 18·3521 | 15·5287 | 38·2267 | |
| Kk-31 | 0·703151 | 0·512976 | 18·3553 | 15·5288 | 38·2296 | 4·0365 |
| Nm-3 | 0·706121 | 0·512696 | 18·6730 | 15·5992 | 38·5166 | |
| 2sd* | 0·000011 | 0·000002 | 0·0014 | 0·0010 | 0·0023 | 0·0027 |
2sd indicates typical standard deviation (2σ) of measured ratios for natural samples.
Figure 3 also shows 143Nd/144Nd–87Sr/86Sr and 207Pb/204Pb–206Pb/204Pb diagrams on which the isotopic compositions of the granodiorite sample are plotted. The granodiorite sample has much higher 87Sr/86Sr and lower 143Nd/144Nd ratios than the samples of the two lavas, and the 87Sr/86Sr ratios of the lava samples correlate negatively with the 143Nd/144Nd ratios. In addition, it is remarkable that the Pb isotopic compositions of the granodiorite sample lie on the linear extrapolation of the trends formed by those of the lava samples. These observations support the idea that similar rocks to the granodiorite samples were a potential source of crustal contamination in magma chambers beneath Rishiri (note that the granodiorite data need not lie on the linear extrapolation of the lava trend in the 143Nd/144Nd–87Sr/86Sr diagram).
PETROGRAPHY AND MINERALOGY
Petrographic and mineralogical features of the Kutsugata and Tanetomi lavas have been described in detail by Kuritani (1998, 1999a, 1999b) and Kuritani (2001), respectively, and they are summarized below. In addition to these descriptions, the petrography of the granodiorite sample is also given.
Kutsugata lava
The Kutsugata lava is porphyritic with total phenocryst contents generally >30 vol. %. The phenocryst assemblage of the North lava is olivine and plagioclase, and that of the South lava is olivine, plagioclase and augite. Plagioclase is the dominant phase, ranging from 25 to 35 vol. %. All phenocryst phases commonly exhibit homogeneous distribution in texture and chemical composition throughout the crystals, except for the outermost rims. Rarely, phenocrysts have a central core with distinctive chemical compositions from the main volume of phenocrysts. The main volume of phenocrysts, excluding the core (<10% of phenocrysts), is inferred to have crystallized at a very shallow level during eruption (Kuritani, 1999a) and the cores to have formed in the magma chamber (Kuritani, 1999b).
On the basis of An content [100 × Ca/(Ca + Na + K)], the cores of plagioclase phenocrysts can be divided into An-rich cores and Ab-rich cores. The An-rich cores, which occur throughout the Kutsugata lava, are characterized by relatively high An content (An71–90) and have a modal abundance of 0·1–0·3 vol. % as a whole. The Ab-rich cores (An55–67) occur only in the South lava and have a modal abundance that is commonly <3 vol. %. Similarly, the cores of olivine phenocrysts can be divided into those with low NiO contents and those with high NiO contents. The modal abundance of the high-Ni cores is commonly <0·4 vol. %, and that of the low-Ni core is <0·2 vol. % throughout the Kutsugata lava. The augite cores, with higher or lower Cr contents than the main volume of augite phenocrysts, occur only in the South lava with a modal abundance of <0·2 vol. %. Further details of mineralogy have been given by Kuritani (1999b).
Tanetomi lava
The Tanetomi lava is aphyric with total phenocryst contents generally <3 vol. %. The phenocryst assemblage of the Tanetomi lava is hornblende, plagioclase and titanomagnetite. Olivine and augite phenocrysts are also present, particularly in the Lower lava 2. In addition to the phenocrysts, microphenocrysts of olivine, orthopyroxene, pigeonite, augite, titanomagnetite, hornblende and plagioclase are present, especially in the Lower lava, and they are considered to have formed during magma ascent to the surface (Kuritani, 2001).
The cores of plagioclase phenocrysts, believed to have formed in the magma chamber, can roughly be divided into clear cores, An-rich cores and Ab-rich cores. The clear cores are present throughout the Tanetomi lava. The An content of the clear core ranges from 55 to 64 in the Lower lava, and from 48 to 58 in the Upper lava. The An-rich cores, with An contents of 60–85, occur mainly in the Lower lava 2, and they are rarely in direct contact with olivine phenocrysts. The Ab-rich cores commonly form crystal aggregates with hornblende, titanomagnetite and apatite crystals, and are present throughout the Tanetomi lava. The An content of the Ab-rich cores is commonly from 30 to 50. More detailed mineralogical information on the Tanetomi lava has been given by Kuritani (2001).
Granodiorite
The granodioritic rocks consist of plagioclase, quartz, hornblende and K-feldspar, with a modal proportion of approximately 55:25:10:10. Although the hornblende crystals preserve their original texture, they commonly exhibit secondary alteration. Plagioclase and K-feldspar are also slightly altered. The An content of plagioclase ranges from 20 to 30. The K-feldspars show little compositional variation, with a Ca:Na:K ratio of about 0:5:95.
PREVIOUSLY ESTABLISHED CONSTRAINTS ON MAGMATIC PROCESSES
The pre-eruption magmatic history of the Kutsugata and Tanetomi lavas has been investigated by detailed petrological studies, mainly using major element constraints (Kuritani, 1998, 1999a, 1999b, 2001). Before further constraining these processes using the trace element and isotopic data obtained in this study, the conclusions of the previous work are summarized.
Kutsugata lava
The pressure in the evolving magma chamber was estimated from the phase relations between plagioclase and the silicate melt to have been about 2 kbar (Kuritani, 1998). During residence of the North lava magma in the magma chamber, high-Ni olivine was the sole crystallizing phase. Plagioclase (An-rich cores) and low-Ni olivine crystallized in the low-temperature mushy boundary layer along the chamber walls. When the South lava occupied the magma chamber, plagioclase (Ab-rich cores) and augite appeared as crystallizing phases in the main magma body.
Compositional trends in the whole-rock major elements of both the North and South lavas can be explained by fractionation of crystals grown in the mushy boundary layer, rather than those crystallized in the main part of the magma body (Kuritani, 1999b). This suggests that the compositional variations were established, not by settling of crystals present in the main part of the magma body, but by extraction of the low-density fractionated interstitial melt from the floor mush zone and its subsequent mixing with the main magma (boundary layer fractionation; e.g. Langmuir, 1989), probably through compositional convection.
Tanetomi lava
In the Tanetomi Lower lava 2, olivine phenocrysts, augite phenocrysts and plagioclase with An-rich cores, which cannot have coexisted with the erupted magma compositions, were interpreted to have been inherited through magma mixing. The estimated fraction of basaltic magma mixed in the Lower lava 2 is <8%. The other lavas are principally free from evidence of mixing with basaltic magmas.
The pressure condition for the magma chamber in which broad compositional variations in the Tanetomi lava were established has been estimated at about 1·5–2·5 kbar. The main part of the magma chamber was mostly free of crystals, except for the plagioclase crystals with clear cores. The mushy zones along the walls of the magma chamber consisted of hornblende, plagioclase with Ab-rich cores, titanomagnetite and apatite. Analysis of the compositional trends of the whole-rock major elements has revealed that separation of plagioclase with Ab-rich cores, rather than clear cores, was required. Thus, it is suggested that boundary layer fractionation played a principal role in the formation of the compositional variations of the Tanetomi lava (Kuritani, 2001), and in this respect it is similar to the Kutsugata lava.
DISCUSSION
Genetic relationship between the Kutsugata and Tanetomi lavas
Origin of the Tanetomi magma
The Kutsugata and Tanetomi lavas were erupted sequentially from the volcano at the same stage of volcanic activity (L-1 stage; Ishizuka, 1999). Although the positions of the vent cannot be specified exactly, as a result of vegetation and overlying fan deposits, both lavas were erupted from the western flank of the volcano (Fig. 1). In addition, the estimated pressure of the magma chamber is similar for both the Kutsugata and Tanetomi magmas at about 1·5–2·5 kbar. These lines of evidence strongly suggest that the Kutsugata and Tanetomi magmas were derived from the same magma chamber.
Campbell & Turner (1987) showed through laboratory experiments that silicic melt generated by melting of the roof crust by heat flux from the underlying basaltic magma can form a separate layer above the basaltic magma in a magma chamber. One plausible genetic relationship between the two lavas is, therefore, that the Tanetomi magma represented the silicic layer of the crustal melt and the Kutsugata magma was the underlying hot magma. This hypothesis may be consistent with the large compositional gap between the two lavas (Fig. 2). In this case, however, it is expected that the Tanetomi magma, present in the upper part of the magma chamber, would have been erupted before the eruption of the Kutsugata magma, contrary to the observation. In addition, the isotopic compositions of the Tanetomi lava are much closer to those of the Kutsugata lava than those of the granodiorite (Fig. 3), which is a potential source of crustal contamination. This observation suggests that the Tanetomi magma did not represent the silicic layer of the crustal melt. From these considerations, the genetic relationship between the Kutsugata and Tanetomi magmas is not the case shown by Campbell & Turner (1987).
Another possible genetic relationship is that the Kutsugata and Tanetomi lavas represent a series of magmas evolved in the same magma reservoir. Contrary to the above hypothesis, the isotopic compositions of the Tanetomi lava can be very different from those of the granodiorite sample in this case. In addition, this hypothesis is consistent with the order of eruptions of the two lavas: eruption of the less evolved Kutsugata magma pre-dates eruption of the more evolved Tanetomi magma. The systematic changes of the geochemical variations in major element, trace element and isotopic compositions of the two lavas (Figs 2 and 3), and the similarity of the trace element concentration patterns between the Kutsugata and Tanetomi lavas (Fig. 2), also support the idea that the Tanetomi magma was essentially a derivative of the Kutsugata magma. Although the trace element patterns of the two lavas are not exactly parallel and the concentrations of MREE and HREE in the Tanetomi lava are lower than those of the Kutsugata lava, this feature can be explained by fractionation of hornblende, as is shown below. In the following discussion, the magmatic system, which evolved to produce the Kutsugata and Tanetomi lavas, is referred to as the ‘Kutsugata magma system’.
Mechanism of fractional crystallization in the Kutsugata magma system
During residence of the Kutsugata North lava magma in the magma chamber, the main magma is estimated to have had a temperature of about 1100–1110°C (Kuritani, 1999a). The magmatic temperature of the most differentiated magma in the Kutsugata lava (sample Km-6 in Table 1) is estimated to have been about 1070°C from olivine–melt thermodynamic equilibria using the solution models of olivine by Hirschmann (1991) and silicate melt by Ghiorso & Sack (1995). Magmatic temperatures estimated by plagioclase–melt thermodynamic equilibria using the models for plagioclase by Elkins & Grove (1990) and silicate melt by Ghiorso & Sack (1995) are 970°C for the Upper lava 1 and 940°C for the Upper lava 2 (Kuritani, 2001). Thus, the magmatic temperature falls progressively from 1110°C to 940°C with increasing whole-rock SiO2 content from 51·5 to 65·5 wt %.
The previous studies have shown that the whole-rock major element variations of the Kutsugata and Tanetomi lavas were produced principally through boundary layer fractionation, and that the influence of magma replenishment is confined to the compositional variations of the Tanetomi Lower lava 2 (Kuritani, 1999b, 2001). On the other hand, the fractionation mechanism of the magmas corresponding to the compositional gap between the Kutsugata and Tanetomi lavas (SiO2 53·5–58·5 wt %) is not clear. To examine the mechanism of fractional crystallization, the major element variations for the gap are roughly modeled.
The samples Km-6 (the most differentiated samples in the Kutsugata lava; Table 1) and Kr-74 (Tanetomi lava; Table 1) are assumed to be the parent and daughter magmas, respectively, for the modeling. Plagioclase, augite, hornblende, titanomagnetite and apatite are used as fractionation phases (Table 3), because plagioclase, hornblende, titanomagnetite and apatite are found in the Tanetomi lava and augite is one of the phenocryst phases of the Kutsugata lava. Olivine is not included in the fractionation phases, because olivine is rare in the sample Km-6 and, therefore, olivine is considered to have been no longer stable in magmas with more differentiated compositions than the Km-6 magma. Each mass balance equation (10 major elements) is weighted by dividing by the analytical error of the XRF analysis (Table 3), and the amounts of fractionation phases are optimized by least-squares calculation (Bryan et al., 1969). The result shows that the whole-rock major element variations can be explained by separation of 15·7 wt % of plagioclase, 8·7 wt % of augite, 17·1 wt % of hornblende, 2·7% of titanomagnetite and 0·2 wt % of apatite. The calculated composition of the daughter magma is in good agreement with its actual composition (Table 3).
Compositions of minerals and magmas used for crystal fractionation modeling
| Sample | SiO2 | TiO2 | Al2O3 | FeO* | MnO | MgO | CaO | Na2O | K2O | P2O5 | ||||||||||
|---|---|---|---|---|---|---|---|---|---|---|---|---|---|---|---|---|---|---|---|---|
| Mineral compositions (wt %) | ||||||||||||||||||||
| Plagioclase | 53·9 | 0 | 29·0 | 0·51 | 0 | 0·19 | 12·0 | 4·30 | 0·11 | 0 | ||||||||||
| Augite | 52·7 | 0·73 | 1·62 | 7·61 | 0·26 | 16·7 | 20·0 | 0·32 | 0·01 | 0 | ||||||||||
| Hornblende | 42·7 | 3·59 | 11·9 | 13·5 | 0·31 | 13·8 | 11·0 | 2·84 | 0·31 | 0 | ||||||||||
| Titanomagnetite | 0 | 11·6 | 4·01 | 82·2 | 0·54 | 1·66 | 0 | 0 | 0 | 0 | ||||||||||
| Apatite | 0 | 0 | 0 | 0 | 0 | 0 | 56·8 | 0 | 0 | 43·2 | ||||||||||
| Magma compositions (wt %) | ||||||||||||||||||||
| Parent magma | 53·9 | 1·51 | 16·7 | 8·48 | 0·17 | 5·03 | 8·57 | 4·49 | 0·85 | 0·34 | ||||||||||
| Daughter magma | 60·6 | 0·92 | 17·8 | 5·85 | 0·15 | 2·13 | 5·15 | 5·52 | 1·37 | 0·48 | ||||||||||
| Calculated magma | 60·2 | 0·94 | 17·7 | 5·82 | 0·14 | 2·07 | 5·31 | 5·94 | 1·39 | 0·48 | ||||||||||
| Analytical error† | 0·041 | 0·004 | 0·016 | 0·028 | 0·001 | 0·015 | 0·013 | 0·013 | 0·003 | 0·002 | ||||||||||
Total Fe is given as FeO.
Analytical error for XRF analysis is used as weights for mass balance equations in the modeling.
Hornblende and apatite did not appear as crystallization phases of the main magma in both the Kutsugata and Tanetomi magmas, and are considered to have crystallized only in the low-temperature mushy zones of the chamber in which the Tanetomi magmas evolved (Kuritani, 2001). The requirement of significant fractionation of hornblende and apatite, therefore, suggests that the magmas for the gap may also have differentiated by boundary layer fractionation. During the evolution of the Kutsugata magma system, the fractionated interstitial melts transported from the mushy zones caused depression of the liquidus of the main magma, thereby the crystallinity of the main magma was kept low throughout its evolution, in spite of its progressive fall in temperature.
Incorporation of crustal materials into the magma chamber
Although the major element variations of the Kutsugata magma system can be principally explained by fractional crystallization, marked variations of whole-rock Pb, Sr and Nd isotopic compositions are present (Fig. 3). This observation requires that the magmas were mixed with materials derived from outside the magma chamber, simultaneously with fractional crystallization (assimilation and fractional crystallization; AFC). Variation in 143Nd/144Nd accompanied by lack of variation in 11B/10B precludes the possibility that the assimilant was a hydrothermal fluid circulating in the crust, and therefore, the contaminant must have been crustal material. There are essentially two mechanisms by which crustal materials can be incorporated into magma chambers undergoing AFC: (1) xenolith assimilation; (2) melt assimilation from the surrounding crust (e.g. Grove et al., 1988; Green, 1994). In this section, the mechanism responsible for the assimilation process in the magmas is discussed.
Crustal xenolith assimilation vs crustal melt assimilation
It may not be easy for crustal xenoliths to be incorporated directly in a magma chamber, because the magma is cooled by the surroundings and a chilled margin and a mushy boundary layer form along the chamber walls, which separates spatially the crust from the molten magma. One possible mechanism by which the magmas can directly incorporate crustal xenoliths may be through turbulent thermal convection. Large convective heat flux from the magma inhibits formation of a mushy zone at the chamber roof and causes extensive melting of the overlying crust (e.g. Huppert & Sparks, 1988). Although low-density silicic liquid generated by such crustal melting would form a separate layer that does not significantly mix with the underlying magma (Campbell & Turner, 1987), blocks of crustal materials falling from the partially fused roof crust can be incorporated in the magma.
If extensive melting of the roof crust occurred, however, it would be expected that eruption of the silicic crustal melt would have been associated with the eruption of the Kutsugata and Tanetomi magmas. The lack of eruption of such silicic magmas may suggest that extensive melting of the roof crust did not occur, probably because of the low temperature of the crust surrounding the magma chamber, which was emplaced at shallow levels (∼2 kbar). In addition to this observation, no xenocrysts or fused crustal xenoliths were found in the Kutsugata and Tanetomi lavas. These considerations suggest that xenolith assimilation was not the principal process in the Kutsugata magma system, and, therefore, that melt from the partially fused crust played an important role in the assimilation process.
Mechanism of crustal melt assimilation
Assimilation, which proceeds through melting of the crust and subsequent melt transport into the magma chamber, can occur effectively at the floor of the magma chamber, because of the low density of the crustal melt (e.g. Campbell & Turner, 1987; Kaneko & Koyaguchi, 2004). In this assimilation process, interaction of the crustal melt with the interstitial melt of the mush zones is a natural consequence, because the crustal melt cannot reach the main magma without passing through the mush zones developed along the chamber floor. During the evolution of the Kutsugata magma system, fractional crystallization proceeded through extraction of fractionated interstitial melt from the floor mush zone and its subsequent mixing with the main magma (boundary layer fractionation) (Kuritani, 1999b, 2001; this study). Therefore, there are three end-member components that control the compositional evolution of the magmas: (1) the main magma; (2) the interstitial melt in the mush zone; (3) the crustal melt.
To examine the extent of the interaction between the crustal melt and the interstitial melt of the mush zone, the compositions of the lava samples are compared with those of the three end-member components, including the main magma (large filled circles), the mush melt (open squares) and the crustal melt (filled square), in Fig. 4 for both the Kutsugata and Tanetomi magmas. The samples with the least differentiated compositions in both lavas (Fm-15 and Kr-74, respectively) are used as the component of the main magma. In the North lava magma of the Kutsugata lava, the fractionated interstitial melt is suggested to have been extracted from mush zones with an average crystallinity of ∼30 vol. % (Kuritani, 1999b). Therefore, the mush melt is assumed to be ∼(0·7)−1 times enriched in Pb compared with the main magma component in both lavas. The isotopic compositions of the mush melt are the same as those of the main magma. This is clear from the consideration that the mush melt component is present even when the magma chamber is closed (i.e. only fractional crystallization). The Pb content of the crustal melt component is assumed to be 20 ppm and its 206Pb/204Pb ratio to be 18·663. This assumption does not affect the argument in this section, but these compositions will be evaluated further in a later section.
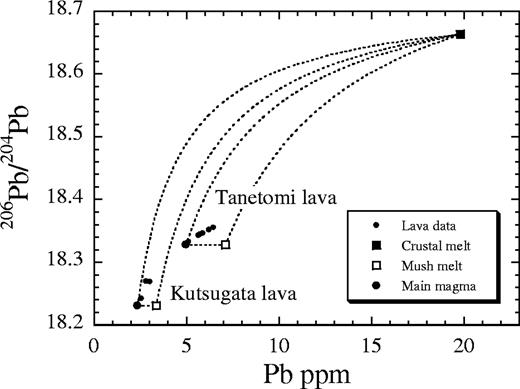
Compositions of the three end-member components (main magma, mush melt and crustal melt) controlling the geochemical evolution of the magmas, in addition to the lava data, shown in a 206Pb/204Pb vs Pb concentration diagram. Mixing lines between the end-member components are shown by dashed lines for both the Kutsugata and Tanetomi lavas. The data for the Tanetomi Lower lava 2 are not plotted, because the Lower lava 2 magma experienced a mixing event with a replenished batch of basaltic magma. Also, samples Km-8 and Km-6 are not shown, because their Pb contents may not represent the original ones as a result of sea-water alteration. In these two samples, the 207Pb/204Pb ratio of the whole-rock powders before processing by acid leaching is significantly higher than that of the leached powders.
In Fig. 4, the lava samples do not lie on the mixing lines between the main magma component and the crustal melt component for either lava. This observation reconfirms the suggestion that the compositional variations were produced not by simple binary mixing between the magmas and the crustal melt, but by fractional crystallization with simultaneous crustal assimilation. Therefore, two-component mixing processes, such as incorporation of crustal melt present in the roof crust into the homogeneous magmas during tapping of the magma chamber, cannot explain the observed compositional variations.
The lava data form relatively tight trends for both the Kutsugata and Tanetomi lavas. This observation suggests that geochemical evolution involves coupling of two components. Combined with the inference of the interaction between the mush melt and the crustal melt mentioned above, the crustal melt is suggested to have mixed well with the fractionated interstitial melt of the floor mush zone, and then the mixed melt was transported so that it mixed with the main magma, causing the geochemical signature to be characteristic of AFC (Fig. 5). If the crustal melt was not effectively mixed with the interstitial melt of the mush zone and was directly transported to the main magma, the resulting compositional variations of the main magma would be scattered in the compositional space formed by the three end-member components. The coupling of the mush melt and the crustal melt is also supported by systematic changes of whole-rock Sr, Nd and Pb isotopic compositions with major element compositions (Fig. 3).
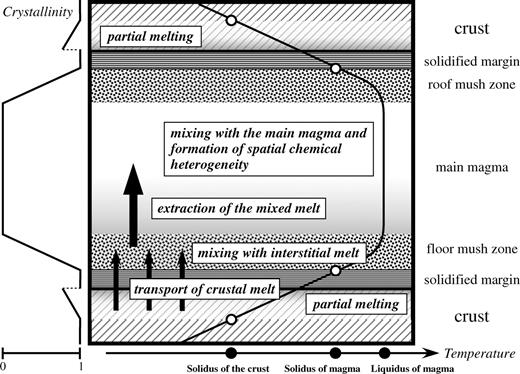
Schematic illustration of a magma chamber, showing the inferred mechanisms of the AFC process in the magma chamber beneath Rishiri Volcano. Schematic temperature and crystallinity profiles are also shown. (See text for details.)
Some lava flow units, such as the Tanetomi Upper lava 1, have wide compositional variations that must reflect the spatial compositional heterogeneity of the main magma in the chamber. The spatial heterogeneity of the main magma could have been produced by a process in which a well-mixed melt, consisting of the interstitial melt and the crustal melt extracted from the mushy zones, was heterogeneously mixed with the main magma (e.g. Kuritani, 2004).
Assimilation and boundary layer fractionation model
The AFC model of DePaolo (1981) has widely been used for quantitative evaluation of simultaneous assimilation and fractional crystallization processes that occur in magma reservoirs (e.g. Grove et al., 1988; Davidson & Wilson, 1989; Smith et al., 1996). The mass balance equations of the AFC model describe the situation that crystals are fractionated instantly from a well-stirred homogeneous magma (i.e. homogeneous fractionation) in which crustal melt is continuously supplied. On the other hand, in the situation of the Kutsugata magma system, the crustal melt is not directly supplied to the main magma but is transported to the mush zone and mixes well with the fractionated interstitial melt of the mush zone. AFC proceeds through mixing of the main magma with a melt mixture comprising the mush melt and the crustal melt (Fig. 5). Because of the difference of the situations, the AFC model of DePaolo (1981) cannot be applied to the Kutsugata magma system to estimate physically meaningful values of the parameters such as the ratio of assimilated mass to crystallized mass. For this reason, we have developed an AFC model that includes boundary layer fractionation [referred to as the Assimilation–Boundary Layer Fractionation (ABLF) model]. AFC processes are evaluated quantitatively using the estimated model parameters for the Kutsugata magma system.
Model descriptions
The ABLF model is based on the boundary layer fractionation model of Langmuir (1989) and the open magmatic system models of Neumann et al. (1954) and DePaolo (1981). The model considers the mechanism of the AFC process envisaged above: the crustal melt is supplied to the mush zone and mixes with the original interstitial melt, and then the mixed melt is transported to mix with the main magma, causing its chemical evolution (Fig. 5). Apart from the difference in the fractional crystallization process, the main difference between the ABLF model and the AFC model is that coupling of crustal assimilation and fractional crystallization occurs in the main part of the magma body in the AFC model, whereas it occurs in the mushy zone in the ABLF model. Equations describing assimilation and simultaneous boundary layer fractionation in which the assimilant is directly supplied to the main magma have been developed by Ozawa (2001) and are also essentially similar to those developed by O'Hara & Fry (1996).
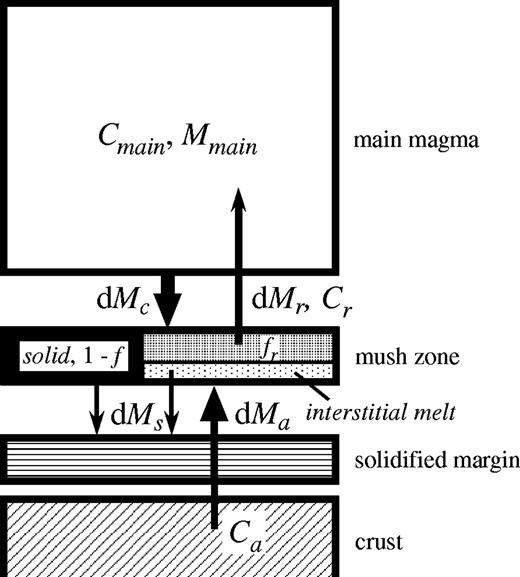
Box model representation of the assimilation and simultaneous boundary layer fractionation (ABLF) process for which equations (1)–(6) are developed. Magma with a composition Cmain is separated with a mass dMc from the main magma to form a mush zone, to which a crustal melt with a composition Ca is added with a mass dMa. The mush zone is then crystallized by a fraction 1 − f, and the interstitial melt, with a composition Cr, is separated with a fraction fr and returns to the main magma, with a mass of dMr.
There are two parameters that do not appear in the normal AFC model. One parameter is a melt fraction of the mush zone, f. The other is fr, the fraction of the interstitial melt (relative to the total mass of the mush zone) added to the main body of magma. The definition of the ratio of the mass of assimilant (dMa), to the mass separated from the main magma (dMc), R, is also different from that of r in the AFC model. In the case of the ABLF model, the solidified mass, dMs, includes the melt phase (interstitial melt) of the mush zone, whereas only solid phase is separated in the AFC model.
Parameters of the ABLF model
The ABLF calculation requires the following input parameters: the compositions of the initial magma (C0), those of the assimilant (Ca), distribution coefficient of element i between melt and bulk fractionating phases (Di), the melt fraction of the mush zone (f) and the fraction of the interstitial melt added to the main magma (fr). By comparing the calculated results with the observed compositional variations, the R value (the ratio of mass assimilated to mass crystallized) may be estimated as a function of F value (the fraction of liquid remaining after crystallization), as in the normal AFC model.
It should be noted that the ABLF model assumes the main magma to be chemically homogeneous. On the other hand, the Upper lava 1, for example, suggests that the main magma was spatially heterogeneous in composition in the Rishiri magma chamber. In this case, a physically meaningful value of R can be obtained only when the R value is constant throughout the magmatic evolution. Fortunately, as is shown below, this condition is met in the Kutsugata magma system.
The composition of the initial magma is taken to be that of the sample Fm-15, the least differentiated sample in the Kutsugata magma system. On the other hand, the compositions of the assimilant and the bulk distribution coefficients can vary with the parameter F. In this study, Pb isotopic compositions and Pb and K2O contents give the most reliable results in the calculation, because Pb and K2O behave as highly incompatible elements throughout the Kutsugata magma system. The variation of the partition coefficients of these elements between melt and fractionation phases with the parameter F is minimal, because fractionation of K-feldspar, one of the main possible reservoirs of these elements, did not contribute to produce the variations of the whole-rock major elements in the Kutsugata magma system (Kuritani, 1999b, 2001).
The bulk distribution coefficients of K2O and Pb, DK2O and DPb, respectively, are evaluated. Among the fractionating phases in the Kutsugata magma system, including olivine, augite, plagioclase, hornblende, titanomagnetite and apatite, plagioclase is the most important reservoir of both K2O and Pb. Partition coefficients of K2O and Pb between silicate melt and plagioclase are about 0·1 and 0·4, respectively (e.g. Ewart et al., 1973; McKenzie & O'Nions, 1991; Dunn & Sen, 1994). Throughout the evolution of the Kutsugata magma system, the weight fraction of plagioclase in the fractionation phases lies in the range from 0·4 to 0·6 (Kuritani, 1999b, 2001; this study). Therefore, the bulk distribution coefficients of DK2O = 0·05 and DPb = 0·2 are adopted in the ABLF calculation, irrespective of the parameter F.
Figure 7a shows a whole-rock Pb–K2O diagram for the Kutsugata magma system. If the concentrations of the crustal melt change greatly during the evolution of the Kutsugata magma system, the variation of the observed data would be significantly curved in the Pb–K2O diagram (note that the bulk distribution coefficients of these elements were mostly constant, as discussed above). This is supported by the inference that the concentration of elements in the assimilant significantly affects the resulting compositional evolution (Fig. 7a), as is shown below. However, the data are linear in the Pb–K2O diagram, as a first-order approximation. This observation suggests that the variation of the K2O and Pb contents of the assimilant did not change greatly during the evolution of the magma chamber. It is therefore assumed that the elemental and isotopic compositions of the assimilant were constant throughout the AFC process.
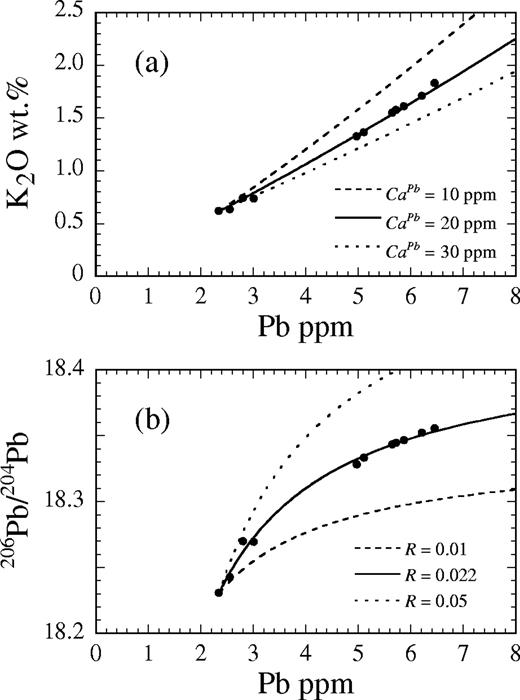
(a) Comparison of the observed data with modeled AFC trends for different Pb concentrations in the assimilant (10 ppm, 20 ppm and 30 ppm) at a given R of 0·022 shown in a K2O–Pb diagram, and (b) comparison of the lava data with modeled trends for different values of R (R = 0·01, 0·022 and 0·05) at a given Pb concentration of 20 ppm shown in a 206Pb/204Pb vs Pb diagram.
As described above, we collected a sample of granodioritic rocks that might have constituted the upper crust beneath Rishiri Volcano. The observed variations of the isotopic compositions of the Kutsugata magma system require that the crustal materials have significantly higher 87Sr/86Sr, 206Pb/204Pb, 207Pb/204Pb and 208Pb/204Pb ratios and lower 143Nd/144Nd ratio than those of the lava samples. The granodiorite sample satisfies these conditions, and, therefore, rocks similar to the granodiorite sample could have constituted the wall rocks to the magma chamber. This argument is supported by the observation that the Pb isotopic composition of the granodiorite lies close to the linear extrapolation of the trend formed by the lava data (Fig. 3). The actual assimilant must have a Pb isotope composition lying on the extrapolation of the linear array of the compositions of the lava samples. The Pb isotopic composition of the assimilant is estimated to be 206Pb/204Pb = 18·663, 207Pb/204Pb = 15·586 and 208Pb/204Pb = 38·568: these compositions lie on the linear extrapolation of the lava data and are the closest to the isotopic compositions of the granodiorite sample (Table 2) in the 206Pb/204Pb–207Pb/204Pb–208Pb/204Pb compositional space, and were obtained by error minimization.
The ABLF calculation also requires the Pb concentration in the assimilant,
In the North lava magma of the Kutsugata lava, it is suggested that the fractionated interstitial melt was extracted from a floor mush zone with an average crystallinity of ∼30 vol. % (Kuritani, 1999b). A value for f = 0·7 is therefore adopted in this study. The parameter fr represents the efficiency of the melt transport from the floor mush zone to the body of main magma. Although this parameter controls the rate of the geochemical evolution of the main magma, it does not significantly affect the resulting geochemical trends itself, and a value of fr = 0·5 was used in this study.
Results of the ABLF calculations
The concentration of Pb in the assimilant,
Figure 8 shows the χ2 surface displayed in
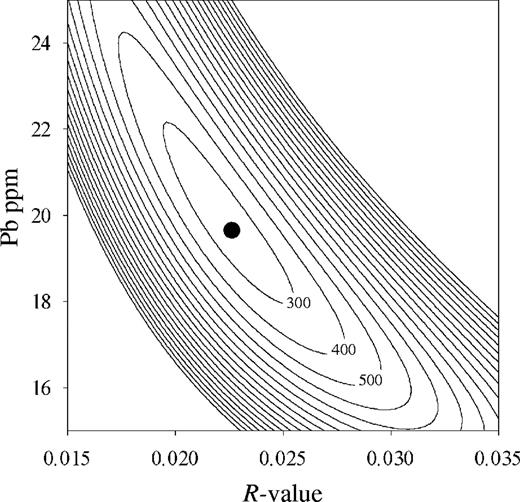
Contour map for residuals of the optimization of the Pb concentration in the assimilant and the R value, in the ABLF modeling. Contours for higher levels of errors are omitted.
Compared with the Pb isotope data, the Sr and Nd isotopic data are more difficult to use in the ABLF calculations because Sr and Nd can be compatible elements for some mineral phases and bulk distribution coefficients can vary greatly during magmatic evolution. For example, it is well known that the plagioclase–melt partition coefficient for Sr strongly depends on the An content of plagioclase (e.g. Blundy & Wood, 1991). The concentrations of these elements in the assimilant are also unknown. Therefore, we have not tried to model the AFC process using these isotopes. For similar reasons, trace element data, except for Pb, are also not modeled. In the present model calculations, the effect of tapping of magmas from the magma chamber is also not considered. With additional information, such as the variation in the proportions of fractionation phases with magmatic evolution, reliable crystal–melt partition coefficient data and composition of assimilant, it might be possible to model assimilation and fractional crystallization in more detail.
To compare the degree of crustal assimilation relative to fractional crystallization in the Kutsugata magma system with that of other magmatic systems, the AFC model of DePaolo (1981) is also applied and the r value is estimated. Using an estimation method similar to the one described above, an r value of 0·07–0·09 is obtained, assuming the K2O content of the assimilant to be 3–4 wt % as before. Again, the r value is constant at a given
Mechanism of assimilation and fractional crystallization
The above calculations have shown that the geochemical evolution of the Kutsugata magma system can be explained by an AFC process with constant R value, and that the r value of DePaolo (1981) may be relatively low compared with that of other magmatic systems. In this section, the mechanism responsible for low-r AFC processes such as those in the Kutsugata system is discussed. First, the volume flux of the assimilant from the fused crust to the magma chamber is estimated. Then, the mechanism of material transport from the crust to the magma chamber is discussed.
Volume flux of assimilant from the crust to the magma chamber
By virtue of the application of the ABLF model to the Kutsugata magma system, the physical meaning of the constant value of the parameter R can be easily interpreted. Irrespective of the presence or absence of thermal convection in the main magma, the inward solidification of the magma chamber from the base (Figs 5 and 6) is controlled mainly by heat conduction, and the flux of the solidifying mass is proportional to t−1/2, where t is time. The constant R, therefore, implies that the flux of the crustal melt supplied to the magma chamber is also proportional to t−1/2.
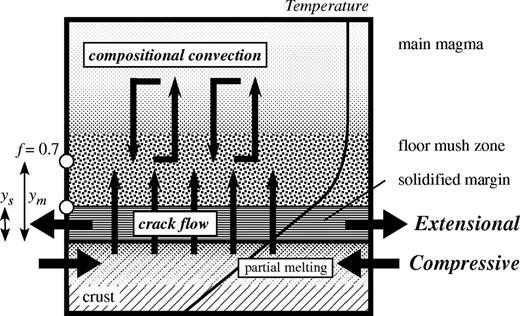
Schematic illustration of the lower part of a magma chamber, showing the inferred mechanisms of the AFC process in the magma chamber. ym and ys indicate the thickness of the region with a melt fraction of <0·7 and the thickness of the completely solidified region, respectively, in the magma chamber. Inferred stress fields for the solidified region of the magma chamber and the partially molten region of the crust are shown. A schematic temperature profile is also shown. (See text for details.)
Transport process of crustal materials from the crust to the magma chamber
In the mushy zones, crystallinity is expected to vary greatly, as a result of the strong thermal gradient (Fig. 5). If the main magma is essentially free of crystals, as in the case of the Kutsugata magma system, the lower limit of crystallinity for the mush zones is close to zero at a temperature close to the liquidus (Fig. 5). On the other hand, the upper limit of crystallinity can be less than or equal to unity when the temperature at the magma–crust contact is higher or lower than the solidus, respectively. This is important for the mechanism of melt transport from the partially fused crust to the magma chamber, because the melt phase in the crust is connected with the melt phase in the magma chamber in the former case, but not in the latter.
The ambient temperature of the crust is typically less than 200°C at 2 kbar for a normal geothermal gradient. Even if the crust had already been heated by the preceding activity of the volcano, the temperature might not have exceeded 400°C. Because the Kutsugata North lava magma is estimated to have been at a temperature of about 1100°C, the temperature at the magma–crust contact is calculated to have been no more than ∼750°C. On the other hand, the solidus temperature of basaltic magmas typically exceeds 800°C at 2 kbar even under water-saturated conditions (e.g. Lambert & Wyllie, 1972). The floor boundary layer of the Kutsugata magma chamber should have a more refractory composition than the erupted magma compositions as a result of the release of residual components such as alkaline elements during boundary layer fractionation (Kuritani, 1999b, 2004), and the solidus temperature could have been much higher than 800°C. These considerations suggest that the magma in the Kutsugata magma chamber was chilled against its floor, which would have prevented the melt phase in the basal crust from connecting with the melt in the floor mush zone, as illustrated in Fig. 5.
The above discussion implies that the assimilation process in the Kutsugata magma system cannot be explained solely by compositional convection (e.g. Kaneko & Koyaguchi, 2004) and compaction. Campbell & Turner (1987) argued that contamination by crustal melt from the floor stops when the mushy zone passes through its solidus. However, it is clear from the isotopic variations that crustal melts have continuously been supplied to the magma chamber during the whole evolution of the Kutsugata magma system. The efficient and continuous transport of the crustal melt from the fused crust to the mush zone, therefore, requires that some kind of passage, such as cracks and fractures, must have been present in the solidified region.
Fracture formation in the solidified region of the magma chamber can be caused by (1) shearing governed by regional tectonic deformation and (2) thermal stresses caused by cooling and heating of the solidified margin and the crust, respectively. In mechanism (2), fracture formation is expected to occur because of the extensional stress field generated in the solidified region owing to cooling (volume contraction) and the compressive stress field generated in the crust owing to heating (volume expansion) (Fig. 9). In these two mechanisms, fracturing resulting from thermal stresses is a natural consequence of the heat transfer from the magmas to the crust; on the other hand, extra conditions, such as tectonic processes, are required in the case of (1). In addition, it is questionable if crustal melt could have been supplied continuously to the magma chamber by shearing as a result of regional tectonic deformation. The solidified rocks must be in the brittle deformation regime at 2 kbar, and therefore it is expected that the supply of the crustal melt would have been intermittent. From these considerations, thermal stresses might have been the principal mechanism to cause fracture formation in the Kutsugata magma system. It is shown below that thermal stresses could have caused the formation of fractures in the solidified region of the magma chamber.
In crust undergoing heating, dehydration melting has been considered to be important for fracture formation (e.g. Brown et al., 1995; Rushmer, 1995). When the crust is heated under vapor-deficient conditions, hydrous minerals such as hornblende and biotite are likely to melt at an earlier stage. Because the volume change of these reactions is positive under crustal conditions, excess pressure as a result of the expansion is produced. Such volume changes translate to a tensile stress of 10–100 MPa (e.g. Petford, 1995). This is also equivalent to or larger than the ∼10 MPa tensile stress necessary to cause rock failure. Because the wall rocks to the Kutsugata magma chamber (granodiorite) contain hornblende, dehydration melting may also have been an important driving force for fracture formation in the solidified region of the magma chamber.
As discussed above, the volume flux of the assimilant is suggested to have decreased progressively with time, proportional to t−1/2. Given that the permeability of the fractured margin and the viscosity of the crustal melt did not vary significantly during the evolution of the Kutsugata magma system, the decrease of the volume flux simply reflects the growth of the solidified margin proportional to t1/2; that is, the decrease of the pressure gradient (∝ t−1/2) which is the driving force for melt transport through the fractures.
From these considerations, fracture formation in the solidified margin caused by thermal stresses is a plausible mechanism for the continuous supply of crustal melt to the magma chamber. In this case, a similar process of melt transport can also occur in the roof and sidewall mush zones. In the case of the roof mush zone, the supplied crustal melt might be ponded within the roof mush zone because of its lower density than the main magma, and it is not, therefore, effectively incorporated in the underlying magma. However, if blocks of the mush zone are detached from the roof and fall into the main magma (e.g. McBirney & Noyes, 1979; Marsh, 1996), a melt consisting of the crustal melt and the interstitial melt may be partly extracted from the blocks to mix with the chamber magma. On the other hand, the crustal melt supplied from the sidewall crust could mix with the interstitial melt of the mush zone, and the mixed melt could be extracted from the mush zone to mix effectively with the main magma (Kuritani, 2004). Such melt might have played an important role in the formation of the spatial chemical heterogeneity of the main magma (McBirney et al., 1985; de Silva & Wolff, 1995; Kuritani, 2004).
Assimilation and fractional crystallization controlled by crustal melt transport
It has been commonly considered that the heat balance between magmas and the surrounding crust is important for coupling of crustal assimilation to fractional crystallization (e.g. Bowen, 1928; DePaolo, 1981; Spera & Bohrson, 2001; Thompson et al., 2002). For example, Thompson et al. (2002) showed by mass and energy conservation models that the initial country rock temperature and its fertility with regard to the melting potential of the crust are important parameters in determining the ratio of assimilated mass to crystallized mass in magmas undergoing AFC. Similar results were also obtained from laboratory experiments by Kaneko & Koyaguchi (2004).
It is true that crystallization of magmas is related directly to melting of the crust as a consequence of the heat transfer from magmas to the crust. However, the crystallization of magmas may not be directly related to assimilation of crustal melt in the magmas, because the assimilation process requires melt transport from the crust to the magma chamber. If transport of crustal melt does not occur, no assimilation would occur even when the magmas and the crust are extensively crystallized and melted, respectively. Therefore, AFC is controlled by the transport process of crustal melt in magma chambers in which a strong thermal gradient is present and the partially fused crust is spatially separated from the molten magmas, as is the case for Rishiri. This situation will continue until melt production in the floor crust becomes so low that the crustal melt cannot be supplied to the magma chamber. Here, as has been demonstrated by earlier workers (e.g. Thompson et al., 2002), conditions such as the initial temperature of the crust and the composition of the crust (and its phase relations) may be important.
The situation that AFC is constrained by crustal melt transport is likely to occur especially in relatively small-scale magma bodies at relatively shallow levels (low crustal temperature). On the other hand, in large magma chambers (thickness of >1 km) at relatively deeper levels, thermal convection can be highly vigorous and the marginal mushy zone is kept thin or absent. Because extensive melting of the roof crust is likely to occur, falling of blocks from the partially fused roof crust can result in effective crustal xenolith assimilation in the magmas (relatively high r value). In this situation, the heat balance between the magma and the crust can be the dominant control on the r value, as demonstrated by previous studies.
CONCLUSIONS
An alkali basalt–dacite suite from Rishiri Volcano shows a systematic variation in isotopic compositions with major elements, and is shown to have evolved by AFC with a low ratio of assimilated mass to crystallized mass. It is suggested that the marginal part of the magma chamber was completely solidified and that the melt phase in the partially fused crust was not directly connected with the melt phase in the magma chamber. The assimilant was transported from the floor crust through fractures in the solidified margin of the magma chamber, formed by thermal stresses. The crustal melt, supplied to the floor mush zone, was mixed well with the interstitial melt, and then the mixed melt was further transported to mix with the main magma by compositional convection. The important point is that coupling of fractional crystallization and crustal assimilation occurred in the mush zone, rather than in the main part of the magma body. The volume flux of the crustal melt is estimated using a mass balance model considering crustal assimilation and simultaneous boundary layer fractionation, and is suggested to have decreased progressively with time, proportional to t−1/2. We propose that the ratio of assimilated mass to crystallized mass in magmas undergoing AFC is controlled not only by the heat balance between the crust and the magma, but also by the transport process of the crustal melt from the crust to the magma chamber.
We are grateful to Kazuhito Ozawa and Ryoji Tanaka for useful discussions throughout this study. We would like to express our thanks to Ian Campbell, Ross Kerr and Stewart Turner for valuable discussions, fruitful comments on this manuscript and encouragement. We thank J. Davidson and N. Green for constructive reviews and comments. R. Arculus is also thanked for editorial handling and encouragement. We thank all the members of the Pheasant Memorial Laboratory at ISEI for useful discussions. This work was supported by the Japanese Society for the Promotion of Science for Japan Junior Scientists (T.K.) and the program for the Center of Excellence for the 21st Century in Japan.
REFERENCES
Blundy, J. D. & Wood, B. J. (
Brown, M., Averkin, Y. A., McLellan, E. L. & Sawyer, E. W. (
Bryan, W. B., Finger, L. W. & Chayes, F. (
Caffe, P. J., Trumbull, R. B., Coira, B. L. & Romer, R. L. (
Campbell, I. H. & Turner, J. S. (
Davidson, J. P. & Wilson, I. R. (
DePaolo, D. J. (
de Silva, S. L. & Wolff, J. A. (
Dunn, T. & Sen, C. (
Elkins, L. T. & Grove, T. L. (
Etheridge, M. A. (
Ewart, A., Bryan, W. B. & Gill, J. B. (
Ghiorso, M. S. & Sack, R. O. (
Green, N. L. (
Grove, T. L., Kinzler, R. J., Baker, M. B., Donnelly-Nolan, J. M. & Lesher, C. E. (
Grunder, A. L. (
Hirschmann, M. (
Huppert, H. E. & Sparks, R. S. J. (
Ishizuka, Y. (
Jaupart, C. & Tait, S. (
Kaneko, K. & Koyaguchi, T. (
Kobayashi, T. (
Kuritani, T. (
Kuritani, T. (
Kuritani, T. (
Kuritani, T. (
Kuritani, T. (
Kuritani, T. & Nakamura, E. (
Kuritani, T. & Nakamura, E. (
Lambert, I. B. & Wyllie, P. J. (
Leitch, A. M. (
Makishima, A. & Nakamura, E. (
Makishima, A. & Nakamura, E. (
Makishima, A., Nakamura, E. & Nakano, T. (
Makishima, A., Nakamura, E. & Nakano, T. (
McBirney, A. R. & Noyes, R. M. (
McBirney, A. R., Baker, B. H. & Nilson, R. H. (
McKenzie, D. & O'Nions, R. K. (
Miura, H. & Takaoka, S. (
Moriguti, T., Makishima, A. & Nakamura, E. (
Nakamura, E., Ishikawa, T., Birck, J.-L. & Allègre, C. J. (
Nakamura, E., Makishima, A., Moriguti, T., Kobayashi, K., Sakaguchi, C., Yokoyama, T., Tanaka, R., Kuritani, T. & Takei, H. (
Nakano, T. & Nakamura, E. (
Neumann, H., Mead, J. & Vitaliano, C. J. (
Norton, D. & Knapp, R. (
O'Hara, M. J. & Fry, N. (
Ozawa, K. (
Petcovic, H. L. & Grunder, A. L. (
Petford, N. (
Reiners, P. W., Nelson, B. K. & Nelson, S. W. (
Rushmer, T. (
Smith, T. E., Thirlwall, M. F. & Macpherson, C. (
Spera, F. J. & Bohrson, W. A. (
Sun, S.-S. & McDonough, W. F. (
Takei, H. (
Takei, H., Yokoyama, T., Makishima, A. & Nakamura, E. (
Thompson, A. B., Matile, L. & Ulmer, P. (
Yokoyama, T. & Nakamura, E. (
Yokoyama, T., Makishima, A. & Nakamura, E. (
Yoshida, T., Yamaguchi, T. & Kawasaki, Y. (
