


Abstract
The blind use of models of nucleotide substitution in evolutionary analyses is a common practice in the viral community. Typically, a simple model of evolution like the Kimura two-parameter model is used for estimating genetic distances and phylogenies, either because other authors have used it or because it is the default in various phylogenetic packages. Using two statistical approaches to model fitting, hierarchical likelihood ratio tests and the Akaike information criterion, we show that different viral data sets are better explained by different models of evolution. We demonstrate our results with the analysis of HIV-1 sequences from a hierarchy of samples; sequences within individuals, individuals within subtypes, and subtypes within groups. We also examine results for three different gene regions: gag, pol, and env. The Kimura two-parameter model was not selected as the best-fit model for any of these data sets, despite its widespread use in phylogenetic analyses of HIV-1 sequences. Furthermore, the model complexity increased with increasing sequence divergence. Finally, the molecular-clock hypothesis was rejected in most of the data sets analyzed, throwing into question clock-based estimates of divergence times for HIV-1. The importance of models in evolutionary analyses and their repercussions on the derived conclusions are discussed.
Introduction
The use of phylogenetics in viral studies has increased dramatically in the last years. When estimating phylogenetic relationships among DNA sequences, the use of a model of nucleotide substitution—a model of evolution—is necessary. While maximum parsimony assumes a model of evolution in an implicit manner, distance methods and maximum likelihood explicitly estimate parameters according to the model of evolution specified (distance methods estimate only the substitution rate, while maximum likelihood estimates all the parameters of the model). The use of particular models of evolution without obvious justification is, unfortunately, an extended practice in the viral community. Even worse, ignorance about the model of evolution used in the analysis, or failing to report it, is also common in the viral literature (Leitner and Fitch 1999 ). The Kimura 1980 two-parameter model (K80) has been extensively used for estimating viral phylogenies without justification. Many viral evolutionary studies have focused on the HIV-1 virus, and we used it here for a case study.
Models of evolution are used in phylogenetic analyses to describe changes in character state, i.e., the rate of change from one nucleotide to another. The first model developed for molecular evolution was that of Jukes and Cantor (1969) (JC), who considered all possible changes among nucleotides to occur with equal rates. Other authors have suggested the incorporation of more realistic assumptions into these models (for a review of models, see Swofford et al. 1996 ; Liò and Goldman 1998 ). For example, base frequencies often differ among nucleotides and therefore may affect the rate of change from one nucleotide to another. Likewise, many genes show a bias in transitions over transversions, again affecting the rate of change from one nucleotide to another. We can incorporate these differences in rates of change by incorporating different rate parameters. Ultimately, for a symmetrical change model without consideration of codon position, we can have 10 parameters: 6 rate parameters and 4 nucleotide frequency parameters (fig. 1 ). Of these 10 parameters, 8 can vary, since the nucleotide frequencies must add up to 1 and the rates are relative to a single change occurring with rate 1. Given a large number of parameters to choose from, we wish to optimize a model for our particular data set.
It seems intuitive that a simple model like K80 may not adequately represent the complexity of the nucleotide substitution process in human immunodeficiency virus 1 (HIV-1) (Moriyama et al. 1991 ; Leitner, Kumar, and Albert 1997 ; Muse 1999 ). One possible solution to model selection for constructing HIV-1 phylogenies could be the arbitrary use of complex (parameter-rich) models (e.g., Korber et al. 2000 ). However, this approach has several disadvantages. First, a large number of parameters need to be estimated, so the analyses become computationally difficult and require larger amounts of time. Second, the use of complex models increases the error with which each parameter is estimated. Ideally, we would like to incorporate as much complexity as needed in the estimation procedure. Indeed, this best-fit model of evolution can be chosen through rigorous statistical testing (Goldman 1993 ; Rzhetsky and Nei 1995 ; Huelsenbeck and Crandall 1997 ; Posada and Crandall 1998 ). The relevance of model selection becomes apparent when the use of one model of evolution or another changes the results of the analysis (Sullivan and Swofford 1997 ; Kelsey, Crandall, and Voevodin 1999 ). Phylogenetic methods may be less accurate (recover an incorrect tree more often) or may be inconsistent (converge to an incorrect tree with increased amounts of data) when the model of evolution assumed is incorrect (Felsenstein 1978 ; Huelsenbeck and Hillis 1993 ; Penny et al. 1994 ; Bruno and Halpern 1999 ; but see Rzhetsky and Sitnikova 1996 ; Yang 1997 ; Posada and Crandall 2001b ). It has been shown that the use of adequate models of evolution improves the accuracy of HIV-1 phylogenetic inference (Leitner et al. 1996 ; Leitner, Kumar, and Albert 1997 ; Posada, Crandall, and Hillis 2000 ).
Nevertheless, the use of models is not important only for phylogenetic reconstruction. Accurate estimation of genetic parameters from a DNA alignment may depend on the model of nucleotide substitution assumed. For example, when a simple model of evolution is used, sequence divergence, transition/transversion ratios, and branch lengths may be underestimated (Tamura 1992 ; Yang et al. 1994 ; Adachi and Hasegawa 1995 ; Yang, Goldman, and Friday 1995 ). Moreover, the use of correct models is also relevant for evolutionary hypothesis testing (e.g., molecular-clock likelihood ratio tests) (Zhang 1999 ).
The molecular-clock hypothesis, which states that the rate of evolution of a gene is approximately constant among different lineages (Zuckerkandl and Pauling 1 965), can also be incorporated in a model of evolution. The assumption that HIV-1 follows a molecular clock is controversial. While some authors dispute the existence of a molecular clock (Coffin 1995 ; Holmes, Pybus, and Harvey 1999 ), other authors claim that the evolution of HIV-1 is clocklike (Gojobori, Moriyama, and Kimura 1990 ; Leitner and Albert 1999 ; Shankarappa et al. 1999 ). Although a molecular clock is not necessary for phylogeny estimation using neighbor joining or maximum likelihood, it becomes a relevant parameter for the study of the origin of HIV-1 (Korber, Theiler, and Wolinsky 1998 ; Korber et al. 2000 )
It does not seem likely that there is a single best-fit model of evolution appropriate for any HIV-1 data set (Muse 1999 ). Different lineages, genes, or regions within HIV-1 may evolve at distinct rates. Different degrees of variability are observed for the same region depending on the hierarchical level of the comparisons, i.e., within or among individuals, or within or among subtypes. Consequently, model selection should be a common practice when estimating HIV-1 phylogenies. We suggest two different statistical approaches for model selection—hierarchical likelihood ratio tests (LRTs) and the Akaike information criterion—but other strategies can be used (Rzhetsky and Nei 1995 ). Computer simulation studies show that these methods for selecting the model of nucleotide substitution perform well and that they are not affected by the starting topology used to estimate the likelihood of the different models evaluated (Posada and Crandall 2001a ). Moreover, the specific LRT hierarchy used in this study seems to perform slightly better than other possible orders of LRTs.
The aim of this study was to use statistical testing in order to establish the best-fit model of evolution for an array of different data sets representing different genes and taxonomic levels in HIV-1. By doing this, the fit of a molecular clock to HIV-1 data was also evaluated. We show how different HIV-1 data sets are better explained by different models of evolution (different from K80) and how the molecular clock is rejected for most HIV-1 data sets.
Materials and Methods
HIV-1 Sequences and Alignment
Thirty-three DNA data sets were gathered from the HIV Sequence Database (http://hiv-web.lanl.gov/) to represent a reasonable range of nucleotide diversity, as well as different regions of the HIV-1 genome (table 1 ). Four different taxonomic levels of sequence variation were studied: within individuals, within subtypes, within groups, and within HIV-1. Three different genes, env, pol, and gag, were analyzed at each one of these levels. DNA sequences were obtained already aligned from the HIV Sequence Database, or they were aligned using ClustalX (Thompson et al. 1997 ). In either case, alignments were inspected and confirmed by eye. Regions of the alignment with ambiguous homology were excluded from the analysis. Final alignments are available in NEXUS format on request from the authors.
Model Selection
When the models compared are nested (the simple model is a special case of the complex model) and the simple model corresponds to fixing some parameters in the complex model to values inside the parameter space, δ is asymptotically distributed as χ2 with q degrees of freedom, where q is the difference in number of free parameters between the two models (Kendall and Stuart 1979 ). When the simple model corresponds to fixing one parameter at the boundary of its range in the complex model, a mixed χ2 (or χ̄2) distribution, consisting of 50% χ20 and 50% χ21, should be used (Self and Liang 1987 ; Goldman and Whelan 2000 ; Ota et al. 2000 ). Once a model was chosen, an LRT for the molecular-clock hypothesis (Felsenstein 1981 ) was also performed among the best-fit model with and without the molecular-clock restriction. The number of degrees of freedom for the molecular-clock LRT was n − 2, with n being the number of taxa.
Results
Different data sets resulted in different best-fit models of nucleotide substitution. Furthermore, the commonly used K80 model of evolution was never the optimal model. The relative fits of different models changed for particular genes and regions and for different hierarchical levels. The models of nucleotide substitution selected by the ηLRT and AIC approaches increased in complexity—becoming more parameter-rich—in accordance with the increasing hierarchical level of nucleotide diversity (table 2 ). Levels of model complexity were similar across genes and regions, and most models incorporated rate heterogeneity among sites. There was a slight tendency for the AIC procedure to favor more complex models than the LRT strategy, but there was a general agreement on the models selected. Maximum-likelihood estimates of base frequencies were similar for different taxonomic levels and for different regions and genes (table 3 ). Adenine was the most common nucleotide, while guanine was the second most common base (except for the pol gene, where the second most common base was thymine). Maximum-likelihood estimates of substitution rates revealed a similar pattern among genes, where the most common change (after multiplying by the corresponding base frequency) was the A-to-G transition (table 4 ). The rest of the transitions were still more common than any transversion. Gamma shape estimates (α) were almost invariably <1, indicating that most of the sites evolve relatively very slowly but a few have faster rates (table 5 ). Rate heterogeneity among sites increased and the proportion of invariable sites (p-inv) decreased with increasing taxonomic level. Those patterns were generally similar for the three genes studied. After correcting the statistical significance for multiple tests, all of the LRTs of the molecular-clock hypothesis were significant at the 0.05 family level except for the envelope V3 region. Three additional tests were not significant at the 0.01 family level (table 6 ).
Discussion
Models of HIV-1 Sequence Evolution
The fact that different HIV-1 data sets are better explained by different models of evolution suggests that blind model selection may confound inferences based on phylogenetic analyses of HIV-1. However, this does not necessarily mean that different data sets for the same genes evolved under different models of evolution. The different substitution patterns may simply reflect different evolutionary times. In fact, the complexity of the models correlates well with nucleotide diversity. The extensive rate heterogeneity observed among sites is easily explained by different selective regimes along the genome. Moreover, recombination in HIV-1 can inflate the amount of rate variation (Schierup and Hein 2000a ). More complex models exist that could increase the fit to HIV-1 sequences, especially codon models including selection (Pedersen, Wiuf, and Christiansen 1998 ; Yang et al. 2000 ). In this paper, we have restricted ourselves to nucleotide substitution models currently implemented for phylogenetic estimation.
HIV-1 Molecular Clock
The rejection of the molecular clock in most data sets is most easily explained by the absence of a molecular clock. Such rate variation among lineages seems very plausible in light of the different selective pressures exerted by the immune system and the repeated reduction in effective population sizes during infection that HIV lineages experience. In other cases, the molecular-clock hypothesis can be rejected when the sequences are evolving in a clocklike fashion because of the presence of recombination (Schierup and Hein 2000b ), which is a frequent phenomenon in HIV (Robertson et al. 1995 ). This rejection of the clock is not a failure of the LRT, but rather the consequence of recombination violating the actual null hypothesis that the LRT of the molecular clock is testing: that the sequences are evolving in a clocklike fashion on one tree. In either case, the application of molecular-clock techniques in HIV-1 seems to be inappropriate due to either the absence of a clock and/or the presence of more than one true tree because of recombination.
The main study supporting a molecular clock in HIV-1 was by Leitner and Albert (1999) , who suggested that the molecular clock explained the genetic variation in the p17 and V3 regions in a known transmission HIV-1 cluster. In arriving at this conclusion, Leitner and Albert used a regression analysis of genetic distance and time. However, molecular clocks should ideally be calibrated using independent lineages in the phylogeny. Calibration using pairwise differences among taxa within a group inflates the correlation between divergence and time because pairwise differences are based on shared proportions of the phylogeny and therefore are not independent (Hillis, Mable, and Moritz 1996 ). This lack of independence makes the regression analysis of genetic distance on time inadequate. Moreover, estimates of HIV-1 divergence rates vary depending on the region of the genome under study, alignment, amount of recombination, different selection pressures among individuals, and phylogenetic accuracy (Korber, Theiler, and Wolinsky 1998 ; Korber et al. 2000 ). We performed an LRT of the molecular-clock hypothesis on these data sets and were able to strongly reject the molecular clock for both data sets (p17, P < 0.0001; V3, P < 0.0001) using the best-fit models for each data set. The P values for these tests even decreased when the true topology and the GTR+dG4 model were used. Furthermore, we also rejected the molecular clock for these same data when the different sampling times were taken into account (Rambaut 2000 ) (P < 0.0001) (see also Rambaut 1997 ). Computer simulation studies have shown that the LRT of the molecular clock performs quite well under a “reasonable” model of evolution and that it becomes a conservative test when the assumptions of the substitution model are not met (Yang, Goldman, and Friday 1995 ; Zhang 1999 ). In addition, the confounding factor of recombination is absent due to the known history of the sequences among individuals. Interestingly, the results from this one transmission case with a known history have been extrapolated across all of HIV diversity with an obviously complex and recombinogenic history to justify the assumption of a molecular clock (e.g., Korber et al. 2000 ).
Conclusions
Researchers of HIV-1 evolution should justify their choice of models of nucleotide substitution. Simple methods have been implemented in computer programs to facilitate the statistical justification of a particular model of substitution (Posada and Crandall 1998 ). Different models can change not only topologies, but also branch lengths and distance calculations. Indeed, nucleotide substitution parameters are more accurately estimated under the correct model (Fukami-Kobayashi and Tateno 1991 ; Yang, Goldman, and Friday 1994 ; Van de Peer et al. 1996 ; Leitner, Kumar, and Albert 1997 ). Bootstrap values may be dependent on the adequacy of the model for the data. Common approaches for detecting recombination in HIV-1 data sets will also be affected by model choice, since one's ability to partition effects of rate heterogeneity and recombination is critical. Both topology and branch length estimates are becoming increasingly important in HIV-1 transmission cases (Ou et al. 1992 ) and therefore must be estimated with justified models for the greatest accuracy. Although we have made a case with HIV-1 DNA sequences, results from this study apply to the use of models of DNA substitution in any evolutionary study. Current models of nucleotide substitution are not perfect (and they never will be), and parameters that are more realistic will be incorporated to describe the complexity of evolution. As models that are more complex are proposed (Goldman and Yang 1994 ; Muse and Gaut 1994 ; Pedersen, Wiuf, and Christiansen 1998 ), there is further reason to justify one's choice of models.
The large number of DNA sequences available at the HIV-1 sequence database allows for an alternative approach to model selection. The parameters of a complex model could be estimated for each region or gene of the HIV-1 virus using all (or part) of the data available. Once these parameters were estimated, they could be used for subsequent analyses without the necessity of estimating them again (Hillis 1999 ). However, for this approach, we must be willing to assume that HIV-1 evolves under the same underlying model of DNA substitution at any hierarchical level. In addition, it is not clear if this general-model procedure would raise the accuracy of phylogenetic estimation for a smaller data set. We are currently investigating these questions.
Stephen Palumbi, Reviewing Editor
Keywords: model selection likelihood ratio test Akaike information criterion molecular clock HIV-1
Address for correspondence and reprints: David Posada, 574 WIDB, Department of Zoology, Brigham Young University, Provo, Utah 84602-5255. dp47@email.byu.edu .
Table 2 Models of Evolution Selected by the Hierarchical Likelihood Ratio Test (HLRT) and Akaike Information Criterion (AIC) Strategies
Table 2 Models of Evolution Selected by the Hierarchical Likelihood Ratio Test (HLRT) and Akaike Information Criterion (AIC) Strategies
Table 3 Maximum-Likelihood Estimates of Base Frequencies Under the Best-Fit Models Selected by the Hierarchical Likelihood Ratio Test Procedure
Table 3 Maximum-Likelihood Estimates of Base Frequencies Under the Best-Fit Models Selected by the Hierarchical Likelihood Ratio Test Procedure
Table 4 Maximum-Likelihood Estimates of Nucleotide Substitution Rates Under the Best-Fit Models Selected by the Hierarchical Likelihood Ratio Test Strategy
Table 4 Maximum-Likelihood Estimates of Nucleotide Substitution Rates Under the Best-Fit Models Selected by the Hierarchical Likelihood Ratio Test Strategy
Table 5 Maximum-Likelihood Estimates of the Gamma Shape Parameter ({α}) and the Proportion of Invariable Sites (p-inv) Under the Best-Fit Models Selected Using the Hierarchical Likelihood Ratio Test
Table 5 Maximum-Likelihood Estimates of the Gamma Shape Parameter ({α}) and the Proportion of Invariable Sites (p-inv) Under the Best-Fit Models Selected Using the Hierarchical Likelihood Ratio Test
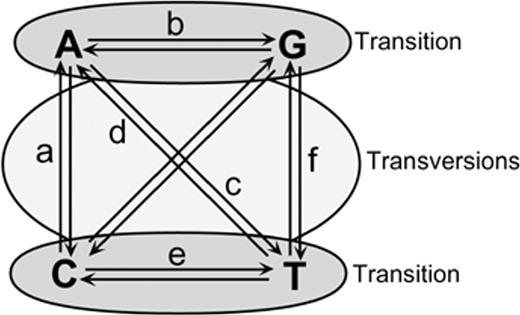
Fig. 1.—Different rates of nucleotide substitution. All of the models compared here are symmetrical, so the rate of change from nucleotide i to nucleotide j is the same as the rate of change from nucleotide j to nucleotide i.
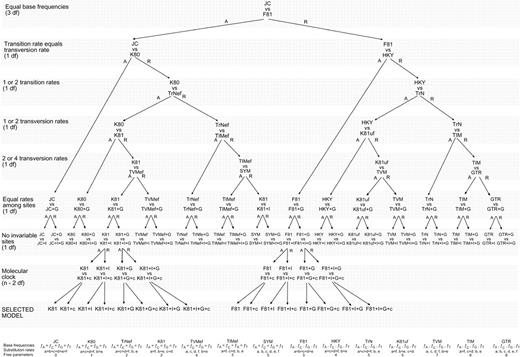
Fig. 2.—Hierarchical likelihood ratio tests (ηLTRs). Hypotheses tested are indicated on the left. The acceptance or rejection of each LRT (by default when P < 0.01) determines the path. For clarity purposes, only the full paths corresponding to the K81 and F81 model families are indicated. Mean features of the models of evolution compared are summarized at the bottom. JC (Jukes and Cantor 1969 ); K80 (Kimura 1980 ); K81 (Kimura 1981 ); TrNef (TrN model with equal base frequencies); TIMef (TIM model with equal base frequencies); TVMef (TVM model with equal base frequencies); SYM (Zharkikh 1994 ); F81 (Felsenstein 1981 ); HKY (Hasegawa, Kishino, and Yano 1985 ); K81uf (K81 model with unequal base frequencies); TrN (Tamura and Nei 1993 ); TIM (transitional model: rAC = rGT ≠ rAT = rCG ≠ rAG ≠ rGT); TVM (transversional model: rAC = rCT ≠ rAG ≠ rAT ≠ rCG ≠ rGT); GTR (Rodríguez et al. 1990 ). I = invariable sites; G = gamma distribution; c = molecular clock enforced
Thomas Leitner kindly provided several data sets. Eddie Holmes and Marcos Losada made helpful suggestions on the manuscript. We thank Rayna Clay for assistance in preliminary analyses of the HIV data. This work was supported by a BYU Graduate Studies Award (D.P.) and by NIH grant number RO1-HD34350 and the Alfred P. Sloan Foundation (K.A.C.).
literature cited
Adachi, J., and M. Hasegawa.
Akaike, H.
Bruno, W. J., and A. L. Halpern.
Coffin, J. M.
Felsenstein, J.
———.
Fukami-Kobayashi, K., and Y. Tateno.
Gojobori, T., E. N. Moriyama, and M. Kimura.
Goldman, N., and S. Whelan.
Goldman, N., and Z. Yang.
Hasegawa, M. 1990a. Mitochondrial DNA evolution in primates: transition rate has been extremely low in the lemur. J. Mol. Evol. 31:113–121
Hasegawa, M., H. Kishino, and N. Saitou.
Hasegawa, M., K. Kishino, and T. Yano.
Hillis, D. M.
Hillis, D. M., B. K. Mable, and C. Moritz.
Hochberg, Y.
Holmes, E. C., O. G. Pybus, and P. H. Harvey.
Huelsenbeck, J. P., and K. A. Crandall.
Huelsenbeck, J. P. and D. M. Hillis.
Jukes, T. H., and C. R. Cantor.
Kelsey, C. R., K. A. Crandall, and A. F. Voevodin.
Kimura, M.
———.
Korber, B., M. Muldoon, J. Theiler, F. Gao, R. Gupta, A. Lapedes, B. H. Hahn, S. Wolinsky, and T. Bhattacharya.
Korber, B., J. Theiler, and S. Wolinsky.
Leitner, T., and J. Albert.
Leitner, T., D. Escanilla, C. Franzen, M. Uhlen, and J. Albert.
Leitner, T., and W. M. Fitch.
Leitner, T., S. Kumar, and J. Albert.
Liò, P., and N. Goldman.
Moriyama, E. N., Y. Ina, K. Ikeo, M. Shimizu, and T. Gojobori.
Muse, S.
Muse, S. V., and B. S. Gaut.
Ota, R., P. J. Waddell, M. Hasegawa, H. Shimodaira, and H. Kishino.
Ou, C.-Y., C. A. Ciesielski, G. Myers et al. (18 co-authors).
Pedersen, A.-M. K., C. Wiuf, and F. B. Christiansen.
Penny, D., P. J. Lockhart, M. A. Steel, and M. D. Hendy.
Posada, D., and K. A. Crandall.
Posada, D., K. A. Crandall, and D. M. Hillis.
Rambaut, A.
———.
Robertson, D. L., P. M. Sharp, F. E. McCutchan, and B. H. Hahn.
RodrÍguez, F., J. F. Oliver, A. MarÍn, and J. R. Medina.
Rzhetsky, A., and M. Nei.
Rzhetsky, A., and T. Sitnikova.
Saitou, N., and M. Nei.
Schierup, M. H., and J. Hein. 2000a. Consequences of recombination on traditional phylogenetic analysis. Genetics 156:879–891
Self, S. G., and K.-L. Liang.
Shankarappa, R., J. B. Margolick, S. J. Gange et al. (12 co-authors).
Sullivan, J., and D. L. Swofford.
Swofford, D. L.
Swofford, D. L., G. J. Olsen, P. J. Waddell, and D. M. Hillis.
Tamura, K.
Tamura, K., and M. Nei.
Thompson, J. D., T. J. Gibson, F. Plewniak, F. Jeanmougin, and D. G. Higgins.
Van de Peer, Y., W. Janssens, L. Heyndrickx, K. Fransen, G. van der Groen, and R. De Wachter.
Yang, Z.
———.
Yang, Z., N. Goldman, and A. Friday.
———.
Yang, Z., R. Nielsen, N. Goldman, and A.-M. K. Pedersen.
Zhang, J.
Zharkikh, A.
