


Abstract
The investigation of dose–response associations between carbohydrate intake, glycemic index, glycemic load, and risk of breast cancer stratified by menopausal status, hormone receptor status, and body mass index (BMI) remains inconclusive.
A systematic review and dose–response meta-analyses was conducted to investigate these associations.
As part of the World Cancer Research Fund/American Institute for Cancer Research Continuous Update Project, PubMed was searched up to May 2015 for relevant studies on these associations.
Prospective studies reporting associations between carbohydrate intake, glycemic index, or glycemic load and breast cancer risk were included.
Two investigators independently extracted data from included studies.
Random-effects models were used to summarize relative risks (RRs) and 95%CIs. Heterogeneity between subgroups, including menopausal status, hormone receptor status, and BMI was explored using meta-regression. Nineteen publications were included. The summary RRs (95%CIs) for breast cancer were 1.04 (1.00–1.07) per 10 units/d for glycemic index, 1.01 (0.98–1.04) per 50 units/d for glycemic load, and 1.00 (0.96–1.05) per 50 g/d for carbohydrate intake. For glycemic index, the association appeared slightly stronger among postmenopausal women (summary RR per 10 units/d, 1.06; 95%CI, 1.02–1.10) than among premenopausal women, though the difference was not statistically significant (Pheterogeneity = 0.15). Glycemic load and carbohydrate intake were positively associated with breast cancer among postmenopausal women with estrogen-negative tumors (summary RR for glycemic load, 1.28; 95%CI, 1.08–1.52; and summary RR for carbohydrates, 1.13; 95%CI, 1.02–1.25). No differences in BMI were detected.
Menopausal and hormone receptor status, but not BMI, might be potential influencing factors for the associations between carbohydrate intake, glycemic index, glycemic load, and breast cancer.
INTRODUCTION
Breast cancer is the most common cancer among women worldwide, with an estimated 1.67 million new cancer cases diagnosed in 2012.1 Many risk factors have been identified, including older age, hormonal and reproductive factors, and modifiable lifestyle factors.2–4 Evidence has shown that obesity, type 2 diabetes, and possibly insulin resistance are related to increased risk of postmenopausal breast cancer as well.4–8
Recently, there has been growing interest in the association between risk of breast cancer and the intake of foods related to glucose and insulin metabolism. Studies investigating the association between intake of total carbohydrates, or specific types of carbohydrates (such as total sugars or specific sugars), and breast cancer reported contradicting results,9–21 and so far, no meta-analysis on this topic is available. Furthermore, it has been shown that the effect of different carbohydrates on postprandial blood sugar concentration varies. Several meta-analyses have investigated the association between diets with high glycemic index and glycemic load – markers of carbohydrate quality – and risk of breast cancer.22–28 While some findings indicated that breast cancer risk was moderately increased with high glycemic index22,25,26 and glycemic load,24 other studies failed to reach statistical significance for either glycemic index23,24,27,28 or glycemic load.22,23,25–28
These studies have performed meta-analyses of high vs low values of glycemic index and glycemic load, but the findings have revealed little about the dose–response relation between glycemic index, glycemic load, and breast cancer risk. Furthermore, studies that stratified their analyses by menopausal status reported no differences for glycemic index between pre- and postmenopausal women, whereas the association for glycemic load and breast cancer seemed to be stronger in premenopausal women than in postmenopausal women.23,25,26,28 Only the most recent meta-analysis investigated the associations between glycemic index, glycemic load, and breast cancer stratified by estrogen receptor (ER) status of the tumor. The results indicated a potential positive association only in women with ER-negative (ER−) status,28 whereas evidence on stratification by other hormone receptor status, such as progesterone receptors (PRs), is lacking. In addition, the most recent meta-analysis did not include the cohorts of the National Institutes of Health–American Association of Retired Persons Diet and Health Study29 or the Women’s Health Study30 and did not include the most recent updated reports from the Nurses’ Health Study II17 or the European Prospective into Cancer and Nutrition (EPIC) study.16 Moreover, individual studies investigating whether excess body weight as measured by body mass index (BMI) influences associations between carbohydrate intake, glycemic index, or glycemic load and breast cancer have reported contradictory findings.12,13,15,17,31 So far, however, analyses that summarize these findings are lacking.
The aim of the present review is twofold. First, a systematic review and meta-analysis of prospective studies was performed to investigate the magnitude and the dose–response shape of the associations between dietary factors related to glucose metabolism—including glycemic index, glycemic load, carbohydrate intake, and specific types of carbohydrates—and risk of breast cancer. Second, these associations were investigated to determine whether they differed by menopausal status, hormone receptor status, or BMI.
METHODS
This report was conducted according to the Preferred Reporting Items for Systematic Reviews and Meta-Analyses (PRISMA) statement.32
Search strategy
Several databases, including PubMed, Embase, CAB Abstracts, ISI Web of Science, BIOSIS Previews, Latin American and Caribbean Center on Health Sciences Information, Cochrane Library, Cumulative Index to Nursing and Allied Health Literature (CINAHL), Allied and Complementary Medicine Database (AMED), National Research Register, and MEDLINE In-Process, were searched up to December 2005 by several reviewers at the Istituto Nazionale Tumori, Milan, during the systematic literature review for the World Cancer Research Fund/American Institute for Cancer Research (WCRF/AICR) Second Expert Report.4 All relevant prospective studies were identified by the PubMed searches, and therefore a change in the protocol was made, and only PubMed was used for the updated searches from January 2006 up to May 2015. The literature search was carried out following a predefined protocol, which includes all the details of the search terms, and has been published online.33 Reference lists of relevant papers and reviews were hand searched to identify any other potentially relevant papers.
Study selection
The PICOS (Participants, Intervention Comparators, Outcomes, Study Design) criteria are shown in Table 1. The criteria for inclusion were as follows: (1) investigation of the association between dietary glycemic index, dietary glycemic load, intake of carbohydrates, or intake of specific types of carbohydrates (total and specific sugars, including fructose, sucrose, glucose, lactose, maltose, and added sugars) and incidence of breast cancer; (2) use of a prospective study design, including cohort, case–cohort, and nested case–control studies as well as follow-up studies of randomized clinical trials; and (3) reporting of adjusted risk estimates [including relative risk (RR), hazard ratio, or odds ratio and the corresponding 95%CIs] for the association between breast cancer and carbohydrate intake, glycemic index, glycemic load, or specific types of carbohydrates (total and specific sugars). If multiple articles were published for the same study, the newest publication providing the largest number of cases was included. Two studies were included in subgroup analyses only.34,35 Studies were excluded if they did not provide enough data on the exposure (no quantification of the exposure was reported, or only high-vs-low analyses were shown)36–40 or if they assessed glycemic index, glycemic load, or carbohydrate intake in childhood or adolescence.41,42
PICOS criteria for inclusion and exclusion of studies
| Parameter | Inclusion criteria |
|---|---|
| Population | Women without breast cancer at baseline |
| Intervention/ exposures | Dietary intake of carbohydrates; glycemic index; glycemic load; specific types of carbohydrates (total and specific sugars, including fructose, sucrose, glucose, lactose, maltose, and added sugars) |
| Comparison | Dose–response relation |
| Outcomes | Breast cancer |
| Type of study | Prospective studies: cohort, case–cohort and nested case–control studies, and follow-up studies of randomized clinical trials |
Data extraction
The following information was extracted: first author’s last name, year of publication, country where the study was conducted, study name, study design, age of participants, specific characteristics of the study population, study size, number of cases, duration of follow-up, dietary assessment method, exposure (carbohydrate intake, glycemic index, glycemic load, total sugars, and specific sugars), quantity of intake, RRs, and 95%CIs from the models with most number of confounder adjustments, and variables adjusted for in the analyses (see Table S1 in the Supporting Information online).
Statistical methods
Dose–response meta-analyses were conducted to summarize the association between breast cancer and carbohydrate intake, dietary glycemic index, dietary glycemic load, and intake of specific sugars by using random-effects models.43 The linear dose–response trends (when not provided) were computed from the natural logarithm of the RRs and 95%CIs across the categories of carbohydrate intake, specific sugar intake, dietary glycemic index, or dietary glycemic load using the method of Greenland and Longnecker.44 This method requires information on the RR and the respective 95%CIs, the distribution of cases, the person-years or noncases, and the quantified exposure value for at least 3 categories of exposure. For studies that did not report cases or persons-years/noncases per category, the total numbers were divided by the number of quantiles. For example, when the total number of person-years was reported and the exposure was expressed as quintiles, the total number of person-years was divided by 5.
Means or medians of intake were assigned to each category. When only the range of the category was reported, the midpoint between the lower and upper limits was estimated. When a category was open-ended (uppermost or lowermost intake categories), it was assumed that the range was the same as that of the adjacent category. When studies reported dietary intake as grams per 1000 kilocalories per day (g/1000 kcal/d) or as a percentage of energy per day, the intake was converted into grams per day (g/d) if appropriate information was available.17,18 On the basis of previous reports, the summary RRs of the dose–response meta-analyses are presented for increments of 50 g/d for carbohydrate intake,45 10 units/d for glycemic index,46 50 units/d for glycemic load,46 and 10 g/d for sugar or specific sugar.20 Restricted cubic spline regression models with 3 knots at the 10th, 50th, and 90th percentiles were used to investigate whether there was a nonlinear dose–response relation between carbohydrate intake, glycemic index, glycemic load, intake of specific carbohydrates, and breast cancer risk; in addition, a likelihood ratio test was used to evaluate nonlinearity.47,48
First, associations between dietary factors (carbohydrate intake, glycemic index, glycemic load, intake of specific carbohydrates) and risk of breast cancer (any, pre-, and postmenopausal breast cancer) were examined. An overall RR was obtained by combining the RRs for studies that reported findings separately for pre- and postmenopausal women using fixed-effect meta-analysis. Most studies assessed premenopausal status only once (at baseline). Thus, the analyses among premenopausal women were stratified by the time of assessment of premenopausal status (assessed at exposure vs assessed at breast cancer diagnosis). Second, the meta-analyses were stratified by hormone receptor status, including ER (ER+ and ER−), PR (PR+ and PR−), and combinations of ER and PR because it has been suggested that risk associations between intake of carbohydrates, glycemic index, glycemic load, and breast cancer might vary between different types of tumors. The Hamling method was used to combine RRs (95%CIs) for different subtypes, if required.49 For example, when a study reported hormone receptor status only as a combination (ER+/PR+ and ER+/PR−), the 2 individual estimates were combined into a single estimate (ER+). These analyses were performed for all breast cancers and among all postmenopausal women, but information for premenopausal women was limited. Third, the possible influence of excess body weight on the association between carbohydrate intake, glycemic index, glycemic load, and breast cancer (any breast cancer, premenopausal breast cancer, and postmenopausal breast cancer) was investigated by stratifying the analyses by BMI (<25 vs ≥25 kg/m2), as defined by the studies. Therefore, the study by Lajous et al34 (an analysis of women from the E3N study, the French cohort of EPIC) was included because a stratified analysis by BMI for the associations between carbohydrate intake, glycemic index, glycemic load, and breast cancer was not available in the total EPIC cohort.16
Heterogeneity between studies was evaluated by the percentage of total variation in risk estimates explained by between-study variation (I2 statistics).50 Sources of heterogeneity were explored by analyses of subgroups, including geographic area (Europe, North America, Asia-Pacific), duration of follow-up (<10 years, ≥10 years), number of cases (<1500, ≥1500), reference food for measuring glycemic index and glycemic load (glucose, white bread, and combination of glucose and white bread), and by adjustment for possible confounders, including parity, age at first birth, age at menopause, age at menarche, use of oral contraceptives, use of hormone replacement therapy, education, physical activity, smoking, alcohol intake, family history of breast cancer, and history of breast disease. All studies included in this meta-analysis adjusted for age, BMI, and total energy intake. Differences between subgroups were assessed using meta-regression analysis.50
Publication bias was explored visually by checking funnel plots for asymmetry and by applying Egger’s test.51
A two-tailed P value of <0.05 was considered statistically significant. All analyses were performed using Stata 13.0 software (StataCorp, College Station, TX, USA).
RESULTS
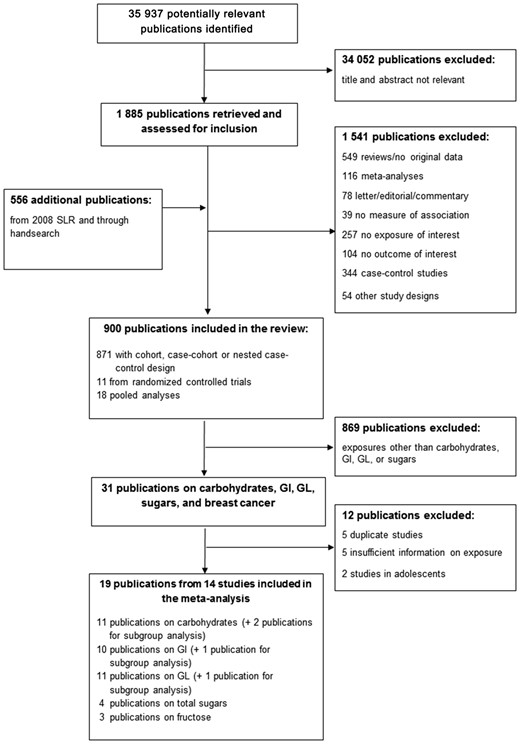
Flow diagram of the literature search process (search period June 1, 2008, to April 30, 2015).Abbreviations: GI, glycemic index; GL, glycemic load; SLR, systematic literature review.
Study characteristics of prospective studies included in the meta-analysis of carbohydrate intake, sugar intake, glycemic index, glycemic load, and breast cancer risk
| Reference, country | Study name; design; age of participants; other characteristics | No. of participants; no. of cases | Duration of follow-up | Dietary assessment method | Carbohydrate comparison RR (95%CI) | Glycemic index comparison RR (95%CI) | Glycemic load comparison RR (95%CI) | Sugars comparison RR (95%CI) |
|---|---|---|---|---|---|---|---|---|
| Farvid et al (2014),17 USA | Nurses’ Health Study (NHS) II; prospective cohort study; 27–44 y | 90 488; 2833 | 20 y | Validated FFQ in early adulthood, 137 food items |
|
|
| |
| Romieu et al (2012),16 European countries | European Prospective Investigation into Cancer and Nutrition (EPIC) study; prospective cohort study; 35–70 y | 334 849; 11 576 | 11.5 y | Validated FFQ, diet history, 7-d food diary (depending on the cohort) |
|
|
| |
| Tasevska et al (2012),18 USA | National Institutes of Health-American Association of Retired Persons (NIH-AARP) Diet and Health Study; prospective cohort study; 50–71 y | 179 990; 4793 | 7.2 y | Validated semi-quantitative FFQ, 124 food items |
| |||
| Shikany et al (2011),19 USA | Women’s Health Initiative (WHI); follow-up of an RCT and prospective cohort study; 50–79 y; PostM | 148 767; 6098 | 8 y | Validated FFQ, 122 food items |
|
|
|
|
| George et al (2009),29 USA | National Institutes of Health-American Association of Retired Persons (NIH-AARP) Diet and Health Study; prospective cohort study; 50–71 y; PostM | 183 535; 5478 | 6.9 y | Validated semi-quantitative FFQ, 124 food items |
|
| ||
| Larsson et al (2009),15 Sweden | Swedish Mammography Cohort (SMC); prospective cohort study; mean age 54 y; screening program; PostM | 61 433; 2952 | 17.4 y | Validated FFQ, 67 food items |
|
|
| |
| Wen et al (2009),14 China | Shanghai Women’s Health Study (SWHS); prospective cohort study; 40–70 y | 73 328; 616 | 7.4 y | Validated FFQ, 77 food items |
|
|
| |
| Lajous et al (2008),34 France | E3N- European Prospective Investigation into Cancer and Nutrition study – France; prospective cohort study; 42–72 y; PostM | 62 739; 1812 | 9 y | Dietary history |
|
|
| |
| Sieri et al (2007),52 Italy | Hormones and Diet in the Etiology of Breast Cancer (ORDET) study; prospective cohort study; 34–70 y, | 8926; 289 | 11.5 y | Semi-quantitative FFQ, 107 food items | Not included in meta-analysis: CHO reported per 5% energy |
|
| |
| Nielsen et al (2005),20 Denmark | Diet, Cancer and Health (DCH) study; prospective cohort study; 50–65 y; PostM | 23 870; 634 | 6.6 y | Validated FFQ, 192 food items | Not included for CHO: overlap with Romieu (2012)16 | Not included for GI: overlap with Romieu (2012)16 | Not included for GL: overlap with Romieu (2012)16 |
|
| Silvera et al (2005),13 Canada | Canadian National Breast Screening Study (CNBSS); prospective cohort study; 40–59 y; screening program | 49 111; 1450 | 16.6 y | Validated FFQ, 69 food items |
|
|
|
|
| Holmes et al (2004),12 USA | Nurses’ Health Study (NHS); prospective cohort study; 35–55 y; registered nurses | 88 678; 4092 | 18 y | Validated semi–quantitative FFQ, 61 food items |
|
|
| |
| Higginbotham et al (2004),30 USA | Women’s Health Study (WHS); prospective cohort study (based on RCT); ≥45 y | 38 446; 897 | 6.8 y | Validated semi-quantitative FFQ, 131 food items |
|
| ||
| Jonas et al (2003),53 USA | Cancer Prevention Study II Nutrition Cohort; prospective cohort study; 50–74 y; PostM | 70 888; 1442 | 5 y | Validated semi-quantitative FFQ, 68 food items |
|
| ||
| Sieri et al (2002),21 Italy | Hormones and Diet in the Etiology of Breast Cancer (ORDET) study; nested case–control study; 41–70 y; PostM | 214 controls; 56 | 5.5 y | Semi-quantitative FFQ, 107 food items |
|
| ||
| Kushi et al (1995),35 USA | Iowa Women's Health Study (IWHS); prospective cohort study; 55–69 y; PostM | 34 388; 262 | 6 y | Validated semi-quantitative FFQ, 127 food items (same FFQ used in 1984 Nurses Health Study) |
| |||
| Barrett-Connor & Friedlander (1993),11 USA | Rancho Bernardo Study; prospective cohort study; 40–79 y | 590; 15 | 15 y | 24-h recall |
| |||
| Kushi et al (1992),10 USA | Iowa Women's Health Study (IWHS); prospective cohort study, 55–69 y; PostM | 34 388; 459 | 4 y | Validated semi-quantitative FFQ, 127 food items (same FFQ used in 1984 Nurses Health Study) |
| |||
| Knekt et al (1990),9 Finland | Social Insurance Institution’s Mobile Clinic Health Examination Survey; prospective cohort study; 20–69 y | 3988; 54 | 20 y | Dietary history |
|
Abbreviations: BMI, body mass index; CHO, carbohydrate; ER, estrogen receptor; FFQ, food frequency questionnaire; HER, human epidermal growth factor receptor; PostM, postmenopausal; PR, progesterone receptor; PreM, premenopausal; RCT, randomized controlled trial; tsp, teaspoon.
Carbohydrates
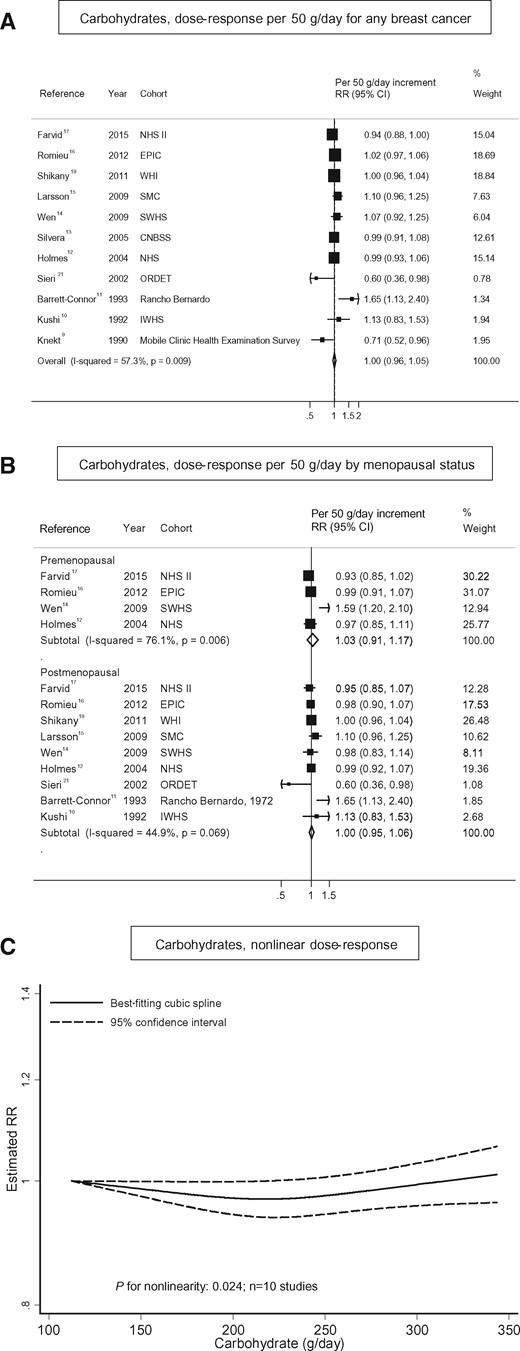
Intake of carbohydrates and breast cancer. (A) Dose–response analysis per 50 g/d for any breast cancer; (B) dose–response analysis by menopausal status, and (C) nonlinear dose–response analysis.
Summary relative risks and 95%CIs of dose–response meta-analyses of carbohydrates, glycemic index, glycemic load, and breast cancer by subgroups
| Carbohydrates (per 50 g/d) | Glycemic index (per 10 units/d) | Glycemic load (per 50 units/d) | |||||||||||||
|---|---|---|---|---|---|---|---|---|---|---|---|---|---|---|---|
| Summary RR (95%CI) | n | I2 (%) | Pwithina | Pbetweenb | Summary RR (95%CI) | n | I2 (%) | Pwithina | Pbetweenb | Summary RR (95%CI) | n | I2 (%) | Pwithina | Pbetweenb | |
| All studies | 1.00 (0.96–1.05) | 11 | 57.3 | 0.009 | – | 1.04 (1.00–1.07) | 10 | 27.2 | 0.194 | – | 1.01 (0.98–1.04) | 11 | 42.7 | 0.065 | |
| Menopausal status | 0.999 | 0.150 | 0.671 | ||||||||||||
| Premenopausal | 1.03 (0.91–1.17) | 4 | 76.1 | 0.006 | 1.01 (0.93–1.10) | 6 | 34.0 | 0.181 | 1.07 (0.92–1.24) | 7 | 72.0 | 0.002 | |||
| Postmenopausal | 1.00 (0.95–1.06) | 9 | 44.9 | 0.069 | 1.06 (1.02–1.10) | 10 | 19.2 | 0.266 | 1.02 (0.99–1.06) | 11 | 3.5 | 0.409 | |||
| Time of assessment of premenopausal statusc | 0.444 | 0.502 | 0.968 | ||||||||||||
| At exposure | 0.96 (0.90–1.02) | 2 | 0 | 0.400 | 0.99 (0.89–1.11) | 4 | 42.9 | 0.154 | 1.04 (0.88–1.23) | 5 | 66.9 | 0.017 | |||
| At cancer diagnosis | 1.22 (0.75–1.98) | 2 | 89.7 | 0.002 | 1.08 (0.89–1.29) | 2 | 18.1 | 0.269 | 1.15 (0.70–1.88) | 2 | 89.1 | 0.002 | |||
| Hormone receptor status, all women | |||||||||||||||
| Estrogen receptor (ER) | 0.029 | 0.882 | 0.055 | ||||||||||||
| ER+ | 0.97 (0.93–1.01) | 4 | 17.7 | 0.302 | 1.04 (0.97–1.12) | 4 | 0 | 0.911 | 0.99 (0.95–1.02) | 3 | 53.6 | 0.116 | |||
| ER− | 1.11 (1.02–1.21) | 4 | 0 | 0.820 | 1.03 (0.90–1.18) | 4 | 0 | 0.870 | 1.20 (1.05–1.38) | 3 | 0 | 0.976 | |||
| Progesterone receptor (PR) | 0.427 | 0.849 | 0.182 | ||||||||||||
| PR+ | 0.97 (0.92–1.03) | 3 | 0 | 0.525 | 1.02 (0.91–1.14) | 3 | 31.1 | 0.234 | 0.91 (0.83–1.00) | 2 | 0 | 0.487 | |||
| PR− | 1.04 (0.90–1.21) | 4 | 63.8 | 0.040 | 1.03 (0.89–1.20) | 4 | 0 | 0.577 | 1.05 (0.96–1.14) | 3 | 72.9 | 0.025 | |||
| Combinations | 0.379 | 0.200 | 0.591 | ||||||||||||
| ER+/PR+ | 0.93 (0.81–1.06) | 3 | 73.2 | 0.024 | 1.02 (0.91–1.14) | 3 | 31.1 | 0.234 | 0.91 (0.83–1.00) | 2 | 0 | 0.487 | |||
| ER+/PR− | 1.05 (0.78–1.40) | 3 | 62.2 | 0.071 | 1.29 (0.96–1.73) | 2 | 42.2 | 0.188 | 1.16 (0.54–2.51) | 2 | 92.8 | 0.000 | |||
| ER−/PR− | 1.09 (0.96–1.24) | 4 | 32.5 | 0.218 | 1.01 (0.88–1.17) | 4 | 0 | 0.822 | 1.19 (1.02–1.38) | 3 | 0 | 0.987 | |||
| ER−/PR+ | 2.99 (0.75–11.89) | 1 | – | – | – | – | – | – | – | – | – | – | |||
| Hormone receptor status, postmenopausal womend | |||||||||||||||
| Estrogen receptor (ER) | 0.047 | 0.311 | 0.046 | ||||||||||||
| ER+ | 0.98 (0.93–1.04) | 4 | 23.8 | 0.269 | 1.02 (0.93–1.13) | 3 | 0 | 0.938 | 0.99 (0.95–1.03) | 3 | 53.8 | 0.115 | |||
| ER− | 1.13 (1.02–1.25) | 4 | 0 | 0.530 | 1.16 (0.96–1.40) | 3 | 0 | 0.864 | 1.28 (1.08–1.52) | 3 | 0 | 0.589 | |||
| Progesterone receptor (PR) | 0.464 | 0.353 | 0.292 | ||||||||||||
| PR+ | 0.97 (0.92–1.03) | 3 | 0 | 0.525 | 0.99 (0.85–1.15) | 2 | 48.5 | 0.164 | 0.91 (0.83–1.00) | 2 | 0 | 0.487 | |||
| PR− | 1.06 (0.86–1.31) | 4 | 70.6 | 0.017 | 1.19 (0.92–1.54) | 2 | 0 | 0.579 | 1.08 (0.96–1.21) | 3 | 82.6 | 0.003 | |||
| Combinations | 0.391 | 0.214 | 0.503 | ||||||||||||
| ER+/PR+ | 0.93 (0.81–1.06) | 3 | 73.2 | 0.024 | 0.99 (0.85–1.15) | 2 | 48.5 | 0.164 | 0.91 (0.95–1.03) | 2 | 0 | 0.487 | |||
| ER+/PR− | 1.05 (0.78–1.40) | 3 | 62.2 | 0.071 | 1.29 (0.96–1.73) | 2 | 42.2 | 0.188 | 1.16 (0.54–2.51) | 2 | 92.8 | 0.000 | |||
| ER−/PR− | 1.10 (0.91–1.34) | 4 | 53.9 | 0.089 | 1.15 (0.94–1.39) | 3 | 0 | 0.950 | 1.29 (1.08–1.54) | 3 | 0 | 0.494 | |||
| ER−/PR+ | 2.99 (0.75–11.89) | 1 | – | – | – | – | – | – | – | – | – | – | |||
| BMI (kg/m2), all women | 0.315 | 0.644 | 0.985 | ||||||||||||
| <25 | 1.02 (0.96–1.08) | 3 | 0 | 0.803 | 1.08 (0.99–1.17) | 5 | 52.5 | 0.077 | 1.02 (0.99–1.04) | 6 | 80.7 | 0.000 | |||
| ≥25 | 0.97 (0.90–1.04) | 3 | 0 | 0.509 | 1.03 (0.97–1.11) | 5 | 0 | 0.442 | 1.01 (0.99–1.02) | 6 | 0 | 0.515 | |||
| BMI (kg/m2), premenopausal women | 0.703 | 0.323 | 0.939 | ||||||||||||
| <25 | 1.11 (0.94–1.32) | 2 | 0 | 0.326 | 0.98 (0.89–1.08) | 2 | 0 | 0.472 | 0.99 (0.86–1.15) | 2 | 0 | 0.579 | |||
| ≥25 | 1.06 (0.55–2.02) | 2 | 80.4 | 0.024 | 0.88 (0.97–1.20) | 2 | 0 | 0.849 | 0.79 (0.65–0.97) | 2 | 0 | 0.325 | |||
| BMI (kg/m2), postmenopausal women | 0.839 | 0.705 | 0.942 | ||||||||||||
| <25 | 1.01 (0.94–1.07) | 2 | 0 | 0.539 | 1.15 (1.01–1.32) | 3 | 71.9 | 0.029 | 1.01 (0.99–1.03) | 4 | 39.9 | 0.172 | |||
| ≥25 | 0.99 (0.91–1.09) | 2 | 0 | 0.725 | 1.11 (1.02–1.20) | 3 | 0 | 0.683 | 1.01 (1.00–1.03) | 4 | 0 | 0.394 | |||
| Geographic area | 0.707 | 0.456 | 0.414 | ||||||||||||
| Europe | 0.94 (0.80–1.10) | 4 | 72.9 | 0.011 | 1.07 (0.99–1.17) | 3 | 27.2 | 0.194 | 1.16 (0.96–1.40) | 3 | 82.4 | 0.003 | |||
| North America | 0.99 (0.94–1.04) | 6 | 51.9 | 0.605 | 1.02 (0.98–1.06) | 6 | 20.4 | 0.280 | 1.00 (0.99–1.01) | 7 | 0 | 0.820 | |||
| Asia-Pacific | 1.07 (0.92–1.25) | 1 | – | – | 0.97 (0.81–1.18) | 1 | – | – | 1.05 (0.89–1.24) | 1 | – | – | |||
| Assessment of glycemic index and glycemic load | – | 0.767 | 0.991 | ||||||||||||
| Glucose | – | – | – | – | 1.03 (0.96–1.10) | 5 | 23.4 | 0.265 | 1.02 (0.93–1.11) | 6 | 61.9 | 0.022 | |||
| White bread | – | – | – | – | 1.05 (1.00–1.11) | 3 | 3.4 | 0.355 | 1.02 (0.96–1.08) | 3 | 42.7 | 0.159 | |||
| Glucose and white bread | – | – | – | – | 1.02 (0.94–1.11) | 2 | 76.9 | 0.037 | 1.01 (0.97–1.06) | 2 | 0 | 0.501 | |||
| Duration of follow-up | 0.675 | 0.547 | 0.825 | ||||||||||||
| <10 y | 1.00 (0.96–1.04) | 3 | 0 | 0.509 | 1.02 (0.97–1.07) | 4 | 0 | 0.642 | 1.00 (0.96–1.05) | 5 | 0 | 0.732 | |||
| ≥10 y | 0.99 (0.93–1.06) | 8 | 68.1 | 0.003 | 1.05 (0.99–1.11) | 6 | 51.3 | 0.068 | 1.02 (0.96–1.07) | 6 | 67.6 | 0.009 | |||
| No. of cases | 0.925 | 0.056 | 0.984 | ||||||||||||
| <1500 | 1.00 (0.84–1.19) | 6 | 71.0 | 0.004 | 1.00 (0.93–1.07) | 4 | 36.2 | 0.195 | 1.04 (0.91–1.19) | 5 | 63.5 | 0.027 | |||
| ≥1500 | 1.00 (0.96–1.03) | 5 | 34.6 | 0.191 | 1.06 (1.02–1.09) | 6 | 0 | 0.753 | 1.01 (0.98–1.04) | 6 | 22.8 | 0.263 | |||
Abbreviations: BMI, body mass index; ER, estrogen receptor; n, number of studies; PR, progesterone receptor; RR, relative risk.
aP for heterogeneity within each subgroup.
bP for heterogeneity between subgroups with meta-regression.
cOnly among studies that included premenopausal women.
dNo data were available for premenopausal women.
When the 3 studies that stratified results by BMI were examined together,12,14,34 there was no significant heterogeneity between normal and overweight women (Pheterogeneity between BMI <25 and BMI ≥25 kg/m2 = 0.32; Table 3).
In further subgroup analyses, none of the following factors modified the association between carbohydrate intake and breast cancer: geographic area, duration of follow-up, number of cases, or adjustment for confounders (Table 3 and Table S2 in the Supporting Information online).
There was statistical indication of a nonlinear relation between carbohydrate intake and risk of breast cancer, although associations were weak (Pnonlinearity = 0.02; Figure 2C). There was no statistical evidence of publication bias (Egger’s test: P = 0.99). The funnel plot shows 1 small study reporting a strong positive association11 and 2 small studies reporting strong inverse associations (see Figure S1A in the Supporting Information online).9,21
Glycemic index
Ten studies, which included 36 900 cases among 1 102 422 women, were eligible for dose–response meta-analysis of dietary glycemic index (range, 47.8–98.0 units/d) and risk of breast cancer.12–17,19,29,52,53 Of these, 5 used glucose,14,17,19,29,52 3 white bread,12,15,53 and 2 glucose and white bread13,16 as reference foods for the calculation of glycemic index.
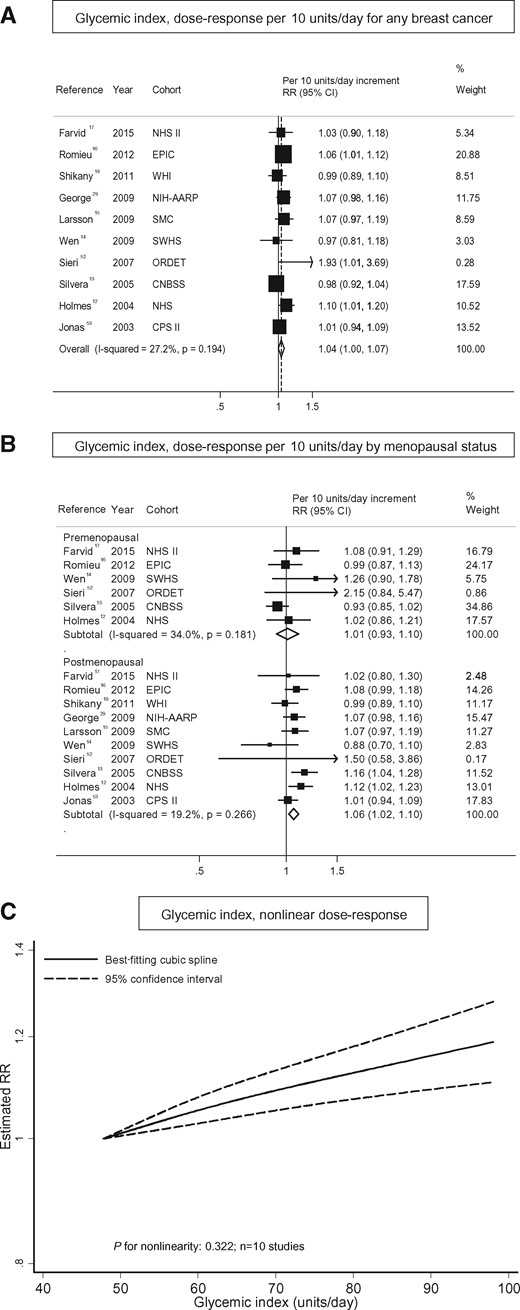
Glycemic index and breast cancer. (A) Dose–response analysis per 10 units/d for any breast cancer; (B) dose–response analysis by menopausal status; and (C) nonlinear dose–response analysis.
The association between glycemic index and breast cancer was statistically significant in postmenopausal women (summary RR, 1.06; 95%CI, 1.02–1.10), but not in premenopausal women (summary RR, 1.01; 95%CI, 0.93–1.10) (Figure 3B12–17,19,29,52,53). This difference, however, was not statistically significant (P = 0.15) (Table 3). There was no evidence of heterogeneity between timing of assessment of premenopausal status (assessed at exposure vs at diagnosis: Pheterogeneity = 0.50; Table 3).
In total, only 4 studies investigated the association between glycemic index and risk of breast cancer stratified by hormonal receptor status.15–17,19 No clear pattern emerged in the present meta-analysis. A positive association was observed for ER+/PR− breast cancer, but the association was not statistically significant (summary RR, 1.29; 95%CI, 0.96–1.73), and there was no statistically significant difference between the subgroups (Pheterogeneity = 0.20) (Table 3). For postmenopausal breast cancer, the association was slightly stronger for ER− and/or PR− breast cancers, but findings were not significant, and no statistically significant differences between the subgroups were detected (Table 3).
Five studies examined the association between glycemic index and breast cancer stratified by BMI.12,13,17,34,52 There was no evidence of a difference by BMI, either overall or among pre- and postmenopausal women (Table 3). In addition, 5 other studies reported that the association between glycemic index and breast cancer was not modified by BMI (data not shown in the publications).15,16,19,29,53
When the meta-analysis was stratified by geographic area, duration of follow-up, number of cases, or assessment of glycemic index, no differences by strata were detected (Table 3). In addition, the possible effect of the inclusion of important confounders on the results was examined, but findings did not change substantially (see Table S2 in the Supporting Information online).
There was no evidence of a nonlinear association between glycemic index and breast cancer risk (Pnonlinearity = 0.32; Figure 3C). The curve showed a significant increase in breast cancer risk with increasing units of glycemic index. There was no statistical evidence of publication bias (Egger’s test: P = 0.37), but the funnel plot shows asymmetry driven by 1 small study52 (see Figure S1B in the Supporting Information online).
Glycemic load
Eleven studies investigating the association between glycemic load (range: 52.9–239.4 units/d) and breast cancer were included in the dose–response meta-analysis.12–17,19,29,30,52,53 Those studies included a total of 37 846 cases among 1 140 868 women. Six studies used glucose,14,17,19,29,30,52 3 studies white bread,12,15,53 and 2 studies glucose and white bread13,16 as the reference food for the calculation of glycemic index.
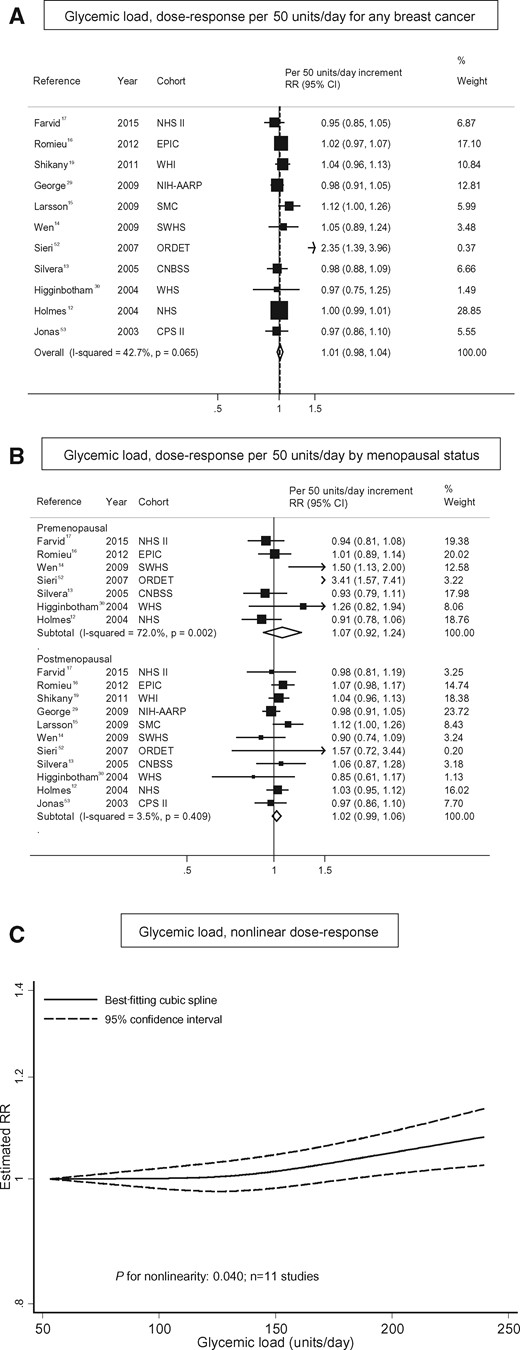
Glycemic load and breast cancer. (A) Dose–response analysis per 50 g/d for any breast cancer; (B) dose–response analysis by menopausal status; and (C) nonlinear dose–response analysis.
There was no evidence of differences by menopausal status (Figure 4B12–17,19,29,30,52,53 and Table 3) or by timing of assessment of premenopausal status (Table 3). After stratification by hormonal receptor status (n = 3 studies),15,16,19 glycemic load became a statistically significant risk factor for breast cancer among women with ER− or ER−/PR− tumors (summary RR per 50 units/d, 1.20; 95%CI, 1.05–1.38; or 1.19; 95%CI, 1.02–1.38, respectively; Table 3). Statistically significant differences between postmenopausal women with ER− compared with ER+ tumors were observed (summary RR per 50 units/d, 1.28; 95%CI, 1.08–1.52; Pheterogeneity between ER− and ER+ receptor types = 0.05; Table 3).
Six studies reported associations stratified by BMI,12,13,15,17,34,52 and no differences by BMI were detected (Table 3). In 4 other studies, there was no modification by BMI level (data not shown in the publications).16,19,29,30,53 One study found an increased risk of breast cancer in women with a BMI <25 kg/m2 (RR [95%CI] for the highest vs the lowest quintile of glycemic load: 1.26 [1.06–1.50]), but not in women with a BMI ≥25 kg/m2 (RR, 1.08; 95%CI, 0.88–1.33).15
No differences between geographic areas, durations of follow-up, numbers of cases, or times of assessment of glycemic load were observed (Table 3). In addition, there were no differences between studies adjusting or not adjusting for main confounders (see Table S2 in the Supporting Information online).
There was indication of a nonlinear association between glycemic load and breast cancer risk (Pnonlinearity = 0.04; see Figure 4C), indicating no association at low values and a positive association for glycemic load values above approximately 150 units/d. There was no statistical evidence of publication bias (Egger’s test: P = 0.28); the funnel plot shows asymmetry driven by 1 study52 (see Figure S1C in the Supporting Information online).
Sugars
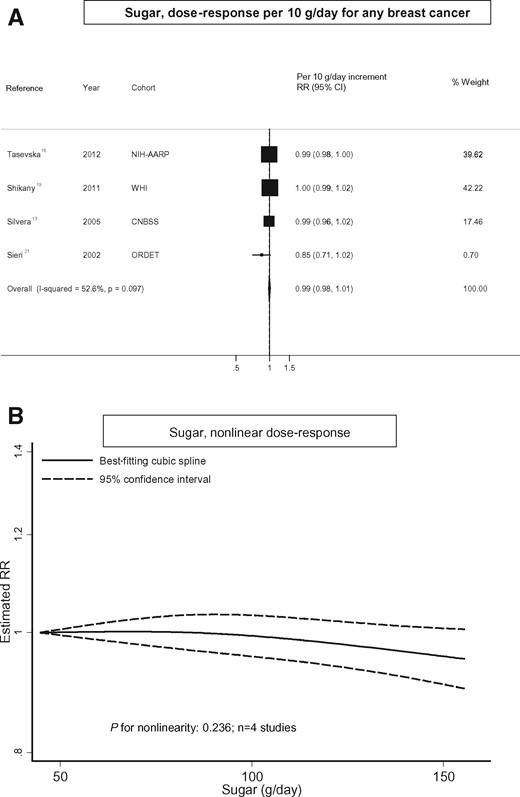
Intake of total sugars and breast cancer. (A) Dose–response analysis per 10 g/d for any breast cancer and (B) nonlinear dose–response analysis.
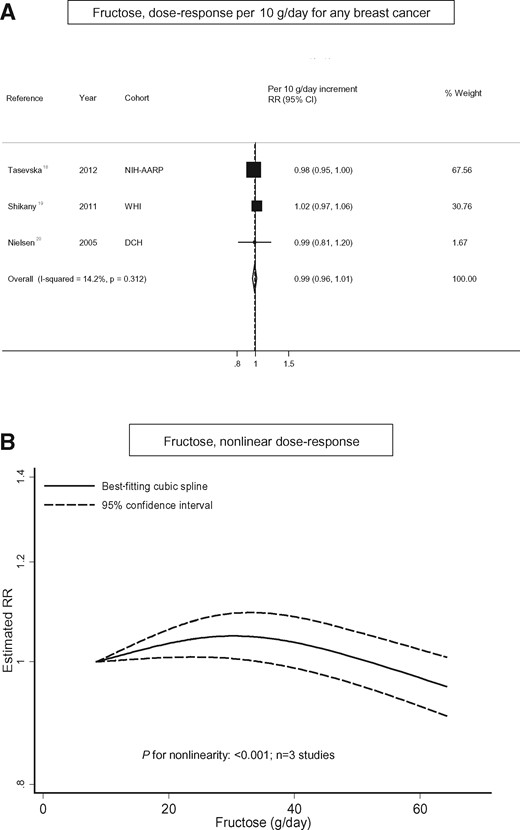
Intake of fructose and breast cancer. (A) Dose–response analysis per 10 g/d for any breast cancer and (B) nonlinear dose–response analysis.
Few studies investigated the associations between other types of sugars, including sucrose,18,20 glucose,20 lactose,20 maltose,20 or added sugars18,19 and risk of breast cancer. There were not enough studies to conduct meta-analyses on these specific subtypes of sugars and risk of breast cancer; however, none of the studies reported a statistically significant association.
DISCUSSION
In the dose–response meta-analysis of prospective studies, the risk of breast cancer was increased by 6% in postmenopausal women for each increment of 10 units/d in glycemic index, and no increase in risk was observed in premenopausal women, but the difference was not statistically significant. Overall, a limited number of studies suggest that the positive association is found mainly with ER− and PR− breast cancer tumors, but no statistically significant result was observed. Glycemic load and intake of carbohydrates were not related to increased risk of breast cancer in pre- or postmenopausal women. However, a higher risk of breast cancer with higher glycemic load and higher carbohydrate intake was observed among women with hormone receptor ER− status. The associations between carbohydrate intake, glycemic index, glycemic load, and pre- and postmenopausal breast cancer were not modified by BMI.
These findings are comparable to those of previous meta-analyses that reported a weak increased risk of breast cancer with higher glycemic index levels in postmenopausal women,23,25,26,28 although other meta-analyses did not show this association.22–24,27 Previous meta-analyses, however, have focused on analyses of breast cancer and high vs low glycemic index values only. To the best of knowledge, the present meta-analysis is the first to investigate the dose–response association and to explore potential nonlinear relations, with findings suggesting that the association is linear. There was no statistically significant differences for the association between glycemic index and risk of breast cancer by hormone receptor status, but a stronger association was suggested for women with hormone receptor–negative tumors. However, the number of studies analyzed was limited, and more studies are needed before a conclusion can be drawn.
Glycemic load was not related to risk of pre- or postmenopausal breast cancer in this meta-analysis. The results of previous meta-analyses of high vs low glycemic loads are inconsistent; some reported a positive association,24,28 while others did not report a significant relation.22,23,25–27 After stratification by hormonal receptor status, the association became significant for women with ER− or ER−/PR− tumors.
To the best of knowledge, this meta-analysis is the first to investigate carbohydrate intake and risk of breast cancer, and no association for pre- or post-menopausal breast cancers was detected. However, similar to the association found for glycemic load, a positive association was observed for women with ER− tumors. No association between intake of total sugar or fructose and breast cancer risk was detected. These findings should be interpreted carefully, because the number of studies was limited and it was not possible to perform stratified analysis by either menopausal status or hormone receptor status. Only 1 study reported on fructose intake and risk of breast cancer by hormone receptor status, and findings indicated a weak positive association for ER+ tumors (RR, 1.06; 95%CI, 0.96–1.18) and an inverse association for ER− tumors (RR, 0.84; 95%CI, 0.67–1.06), but findings were not statically significant.20
These results for the relation of glycemic index and glycemic load with breast cancer are slightly inconsistent: for women with ER− tumors, the association was stronger for glycemic load than for glycemic index. Glycemic index and glycemic load are both measurements of carbohydrate quality. The glycemic index compares the postprandial glucose response to a fixed amount of 50 g of the carbohydrates from different foods with that of a reference food. Because different foods vary considerably in carbohydrate content, the amount that needs to be eaten to provide 50 g of carbohydrate differs substantially for different foods. The glycemic load, therefore, takes into account both the glycemic index and the total carbohydrate content of the food. The glycemic load has been shown to be a stronger predictor of postprandial glycemia and insulin response than the glycemic index,54,55 which might explain this observation.
In postmenopausal women, both glycemic index and glycemic load were positively related to ER− breast cancers, but the association was significant only for glycemic load. Studies have indicated that diets high in glycemic index or glycemic load might be associated with hyperinsulinemia,56,57 insulin-like growth factor 1,58 type 2 diabetes,45 and inflammatory biomarkers,59 all of which also play a role in breast cancer carcinogenesis6–8,60,61 and might be a potential explanation for the association between glycemic load (and glycemic index) and risk of ER− breast cancers. The pathological mechanisms remain unclear. A pooled analysis reported that insulin-like growth factor 1 was positively associated with ER+ tumors, but not with ER− tumors.58 In contrast to these findings, the present meta-analysis shows that the association between diet—as related to glucose metabolism—and breast cancer risk is more relevant in hormone-independent breast cancer, while hormone-dependent breast cancer might be more strongly influenced by hormonal risk factors.62,63 However, the number of studies investigating associations between glycemic index, glycemic load, intake of carbohydrates, sugars and risk of breast cancer by hormone receptor status was limited, and more studies are needed to draw a definite conclusion.
This meta-analysis has several strengths. First, to the best of knowledge, this is the first systematic review and meta-analysis summarizing the evidence on the dose–response association of carbohydrate intake, sugar and fructose intake, and risk of breast cancer. In addition, previous meta-analyses on glycemic index, glycemic load, and breast cancer only reported analyses of high vs low levels of glycemic index or glycemic load and, so far, did not conduct linear or nonlinear dose–response analyses. Second, this meta-analyses included a larger number of women than the previous studies on this topic (about 1 million women, including approximately 37 000 breast cancer cases), which enabled stratification of the analyses by potential modifying factors, including menopausal status, hormone receptor status, and BMI. Third, only prospective studies were included in the present meta-analysis to avoid recall bias from retrospective case–control studies, and this also may have led to less potential for selection bias.
This meta-analysis has some limitations. First, a diet high in carbohydrates, glycemic index, glycemic load, or sugars may accompany other behavioral and dietary factors, such as low physical activity, smoking, overweight and obesity, excess intake of total energy, and alcohol intake. However, in this meta-analysis, findings did not change substantially in subgroup analyses that included studies with and without adjustment for these factors. Moreover, there were no differences in associations detected between normal- and overweight pre- or postmenopausal women. Second, measurement error of diet cannot be ruled out. The reliability of the glycemic index has been discussed in previous studies, which have shown that intra- and interindividual variability in glycemic response for single foods exists,64,65 and it is driven not only by methodological factors such as sample size, number of repeat measures, and sampling time but also by individual biological factors such as age, BMI, blood lipids, C-reactive protein, and, in particular, glycated hemoglobin (HbA1c) and insulin index.64 In addition, food frequency questionnaires (FFQs) are not designed to measure glycemic index and glycemic load specifically, which might have attenuated the results. However, positive associations between glycemic index, glycemic load, and other chronic diseases (eg, type 2 diabetes) were identified using information on glycemic index and glycemic load from similar databases and similar FFQs.45,66 Moreover, dietary information was assessed at baseline, and no information on change in dietary behavior over time was available, which could have influenced the results. However, because of the prospective design of the studies in this review, any changes in diet after baseline would most likely have attenuated the observed associations. Finally, the results that hormone receptor status of the tumors might affect the association between carbohydrate intake, glycemic load, and risk of breast cancer should be interpreted with caution because of the limited numbers of studies available. Thus, it is important to investigate whether exogenous hormones, such as those used in hormone replacement therapy, can affect these associations as well. In this meta-analysis, the limited amount of data precluded stratification for use of hormone replacement therapy. The only study that investigated the association between glycemic index and risk of breast cancer stratified by use of hormone replacement therapy reported a stronger association for users of hormone replacement therapy (summary RR, 2.15; 95%CI, 1.16–4.00) than for never users (summary RR, 1.58; 95%CI 0.79–3.18) by comparing high and low glycemic index values.13
CONCLUSION
In this systematic review and meta-analysis, glycemic index showed a weak positive linear association with risk of postmenopausal breast cancer, but the difference between pre- and postmenopausal status was not statistically significant. Glycemic load and carbohydrate intake were associated with increased risk of breast cancer only among women with hormone receptor–negative tumors, particularly ER−. Further studies on glycemic index, glycemic load, carbohydrate and sugar intake, and risk of breast cancer are needed. Such studies should account for menopausal status, hormone receptor status, excess body weight, and use of hormone replacement therapy.
Acknowledgments
Author contributions. T.N. and S.S. designed the research; S.S. performed the statistical analysis, drafted the paper, and had primary responsibility for final content; D.S.M.C., S.V., A.R.V., L.A., E.P., C.A.T.S., D.C.G., D.A., and T.N. contributed to the design of the study, the literature search, data extraction, data management, and/or data analysis All authors participated in the critical revision of the manuscript and read and approved the final version submitted.
Funding/support. The work of D.S.M.C., S.V., A.R.V., L.A., E.P., C.A.T.S., and T.N. was supported by the World Cancer Research Fund (WCRF) International as part of the Continuous Update Project (grant no. 2007/SP01). The views expressed in this review are the opinions of the authors. They may not represent the views of the funder and may differ from those in future updates of the evidence related to food, nutrition, physical activity, and cancer risk by WCRF International. The work of S.S. and D.A. was supported by a National Health Service (NHS) Biomedical Research Centre grant (Interventional Public Health). The German Diabetes Center (DDZ) is funded by the German Federal Ministry of Health and the Ministry of Innovation, Science, Research and Technology of the State North Rhine-Westphalia.
Declaration of interest. The authors have no relevant interests to declare.
Supporting Information
The following Supporting Information is available through the online version of this article at the publisher’s website. Table S1Important confounders considered of each study included in the meta-analysisTable S2Summary relative risks (RR) and 95% confidence intervals (95%CI) of dose–response meta-analyses of carbohydrates, GI, GL, and breast cancer by adjustment for important confoundersFigure S1Funnel plot of studies included in the dose response meta-analyses of (A) carbohydrate intake, (B) glycemic index, (C) glycemic load, (D) sugar intake, (E) fructose intake, and risk of breast cancer
