


Abstract
Genomic stability depends on faithful genome replication. This is achieved by the concerted activity of thousands of DNA replication origins (ORIs) scattered throughout the genome. The DNA and chromatin features determining ORI specification are not presently known. We have generated a high-resolution genome-wide map of 3230 ORIs in cultured Arabidopsis thaliana cells. Here, we focused on defining the features associated with ORIs in heterochromatin. In pericentromeric gene-poor domains ORIs associate almost exclusively with the retrotransposon class of transposable elements (TEs), in particular of the Gypsy family. ORI activity in retrotransposons occurs independently of TE expression and while maintaining high levels of H3K9me2 and H3K27me1, typical marks of repressed heterochromatin. ORI-TEs largely colocalize with chromatin signatures defining GC-rich heterochromatin. Importantly, TEs with active ORIs contain a local GC content higher than the TEs lacking them. Our results lead us to conclude that ORI colocalization with retrotransposons is determined by their transposition mechanism based on transcription, and a specific chromatin landscape. Our detailed analysis of ORIs responsible for heterochromatin replication has implications on the mechanisms of ORI specification in other multicellular organisms in which retrotransposons are major components of heterochromatin and of the entire genome.
INTRODUCTION
Reliable and complete genome duplication is crucial to maintain genomic stability. In eukaryotes, DNA replication occurs during the S-phase of the cell cycle and is initiated at multiple genomic locations, known as DNA replication origins (ORIs). Over the past years, detailed genome-wide maps of ORIs have been generated for various multicellular organisms such as cultured Drosophila, mammalian and Arabidopsis cells (1–4). ORI specification and activation depends on several variables, including the cell's type and the physiological state as well as specific chromatin features, frequently including those associated with open chromatin (2,5,6). A preference of ORIs for colocalizing with genic regions, in particular highly expressed genes, seems to be a common observation across all organisms studied so far (6–9).
Chromatin can be divided into heterochromatin, which is densely compacted for most of the cell cycle, and euchromatin, with a relatively less dense organization. Genes are not evenly located throughout the chromosomes, as they are more frequent in the euchromatic chromosome arms. This distribution is the inverse of that of transposable elements (TEs), which tend to accumulate in heterochromatic domains both in plants and animals (10–12). Even though TEs account for an important fraction of all eukaryote genomes, the particular families that are most prevalent may differ from genome to genome. Thus, whereas in general LTR retrotransposons are the most prevalent type of TEs in plants (11), another type of retrotransposons, LINEs, are the most prevalent TEs in mammalian genomes (13). In Arabidopsis, several TE families account for 21% of the genome and, although some of them are scattered along chromosome arms, most TEs concentrate in the pericentromeric heterochromatin (14,15). Whilst previous studies have reported the link between DNA replication fork progression and the establishment of heterochromatin (16), the genomic features that contribute to specify ORIs in heterochromatin have not been studied and, consequently, are very poorly understood.
Here, we have used Arabidopsis cultured cells to study in detail the genomic features defining ORI localization in heterochromatin, largely concentrated in the pericentromeric regions. We found that whereas in euchromatic chromosome arms the vast majority of ORIs (94.9%) colocalize with genes, in the pericentromeric gene-poor regions TEs contribute a significant fraction of ORIs (33.7%). Our study also shows that not all TEs serve equally as ORIs. Retrotransposons, and in particular Gypsy elements, more frequently colocalize with them. Furthermore, we found that a specific chromatin landscape mainly characterized by a GC-rich heterochromatic state is a determinant feature for ORI localization in heterochromatin. Together, our findings suggest that the characteristics of the chromatin associated to each family of TEs, their genomic organization and the retrotransposons’ potential for transcription are key to determine their capacity to contain ORIs. Our study serves the basis to tackle in the future the question of how the ORI specification and replication machineries gain access to the highly compact heterochromatic regions to achieve its duplication during S-phase.
MATERIALS AND METHODS
Plant material and growth conditions
Arabidopsis thaliana MM2d cell line (17) was grown at 26 °C and 120 rpm, in the absence of light. The cells were subcultured every 7 days into fresh Murashige & Skoog medium (MS, pH 5.8, Duchefa) supplemented with 3% sucrose (Duchefa), 0.5 μg/ml 1-naphthaleneacetic acid (Duchefa), 0.1 μg/ml kinetin (Sigma) and 0.103 μg/ml vitamins (Duchefa).
BrdU sequencing data analysis
Genomic DNA was purified from BrdU-labeled cells over CsCl gradients. DNA in the heavy-light and in the light-light fractions was used as sample and control, respectively. BrdU sequencing data reads (GEO GSE2182; (7)) were trimmed down to 50 nt from the 3’ end and mapped to the reference Arabidopsis genome (TAIR10) using BOWTIE aligner (18), allowing up to three mismatches and discarding multihit reads. PCR duplicate reads were removed using an in-house script. Peak calling was carried out using different algorithms and parameters to determine those returning the data that were more consistent with the distribution and location of sequencing reads. These were: MACS (19), BayesPeak (20), SICER (21), HOMER (22) and T-PIC (23). Based on the analysis of the results obtained (Supplementary Methods, Supplementary Figures S1 and S2, and Supplementary Table S1), we kept for further studies the collection of peaks returned by MACS1.4 using (i) a cutoff value of 10−6; (ii) merging neighboring peaks when the interpeak distance was less than 260 nt and (iii) removing peaks smaller than 200 nt. The same analysis was carried out using only the multihit reads.
ORI distribution and classification
General annotation coverage was calculated with the complete set of annotations from TAIR10, discarding ‘transposon_fragment’ as it is redundant with the ‘transposable_element’ annotation. Pericentromeric regions were defined as the regions where the gene coverage in 1 Mb bin was equal or lower to 40%. ORIs were attributed to a type of annotation (genes, TEs or particular TE families) only for unambiguous non-overlapping annotation. TE family coverage was calculated within the TE genome space (total TE nucleotide content).
C methylation, G quadruplex, GC content and chromatin states analysis
CG, CHG and CHH methylation data were retrieved from (GEO GSE39901) (24). The presence of G quadruplexes in the Arabidopsis genome was predicted using the Quadparser software (25) allowing a spacing of 7 nt between G-strings. The GC content of the genome was calculated in bins of 50 nt. For the analysis of the distribution of TE among the different chromatin states (26), the relative frequency of each TE family in each state was determined by the coverage of the family in that particular state relative to the total coverage of the TE family in the genome. For the distributions of ORI-TEs among the different chromatin states the ORI midpoint was considered. All the bioinformatics analyses were performed with in-house Perl scripts and BEDtools suite utilities (makewindows, genomecov, merge, intersectBed) (27).
Cell synchronization
Cells in exponential phase (4 days after subculture) were synchronized in G0/G1 by growing them in MS without sucrose for 24 h. To release the cell cycle block the medium was replaced with MS with sucrose (17). Samples for analysis were taken at 2 (G1/S transition), 3.5 (early S) and 7 (late S) hours, as described (17).
Isolation of short DNA nascent strands (SNS)
The short nascent strands from replication intermediates, used in the ORI activity qPCR assays, were purified essentially as described (7). At day 4 after passage, 100 ml of the asynchronous cell suspension were either directly collected for SNS preparation or synchronized at the desired time points (2, 3.5 or 7 h) before SNS isolation.
RNA analysis
Total RNA from asynchronous cells was isolated at day 4 after subculture using Trizol reagent (Invitrogen) according to manufacturer's instructions. Total RNA was treated with DNase I (Roche) and its integrity was assessed by agarose gel electrophoresis. One microgram was reverse-transcribed with SuperScript III (Invitrogen) using an oligo-dT primer (mRNA) or random hexamers (total RNA). A reaction without reverse transcriptase (-RT) was included to verify the absence of genomic DNA in the sample. Two microliters of a 3-fold diluted cDNA reaction were used as template in qPCR.
Chromatin immunoprecipitation
MM2d cells were harvested 4 days after subculture and fixed using ice-cold 1% formaldehyde in PBS and applying vacuum infiltration (three rounds of 6 min on/4 min off). The cross-linking was stopped by the addition of 0.125 M glycine, infiltrating for another 5 min. The grinded material was resuspended in Extraction Buffer (0.25 M sucrose, 10 mM Tris–HCl, pH 8.0, 10 mM MgCl2, 1% Triton X-100, 1 mM PMSF and protease inhibitor cocktail for plant cell extracts (Sigma)). Nuclei were pelleted by centrifugation, resuspended in Lysis Buffer (50 mM Tris–HCl, pH 8.0, 10 mM EDTA, 1% SDS, 1 mM PMSF and protease inhibitor cocktail) and disrupted by sonication in a Bioruptor Plus (Diagenode) for 30–45 cycles of 30 s on and 30 s off, at high power mode. One μg of soluble chromatin was employed per ChIP reaction, using the following antibodies: anti-H3K9me2 (Abcam ab1220, 3 μg), anti-H3K27me1 (Millipore 07-448, 1 μg), anti-total H3 (Abcam ab1791, 2 μg), or anti-rat IgG (Abcam ab6703, 2 μg) as a negative control. Immune complexes were recovered with 50 μl of protein G agarose beads (SCBT) and washed and eluted essentially as described (28).
Quantitative PCR analyses
All qPCRs (SNS, cDNA and ChIP) were performed using GoTaq Master Mix (Promega) according to the manufacturer's instructions in an ABI Prism 7900HT apparatus (Applied Biosystems) using the primers listed in Supplementary Table S2. In each case, the quantification was determined using a standard curve (five serial 4-fold dilutions of gDNA). SNS enrichment was normalized against a region flanking the ORI under analysis or a region lacking ORIs (negative contorl). RNA expression levels were compared to the reference gene GAPC-2 (GLYCERALDEHYDE-3-PHOSPHATE DEHYDROGENASE C-2). The amount of immunoprecipitated material was estimated as percentage of input chromatin and then normalized against total H3 content.
Immunolocalization
MM2d cells were collected at 4 days after subculture and fixed in 4% paraformaldehyde in microtubules stabilizing buffer (MTSB; 50 mM PIPES, pH 6.9, 5 mM EGTA, 5 mM MgSO4), for 10 min plus 5 min with vacuum infiltration. Cells were washed with MTSB, PBS and water and air-dried on superfrost plus slides (Thermo Scientific). Cells were re-fixed in 4% paraformaldehyde in MTSB for 30 min and washed with MTSB. Cell walls were partially digested with 20 mg/ml driselase (Sigma) in MTSB for 45 min at 37°C and the slides were washed with PBS. Membranes were permeabilized with 10% DMSO, 3% Igepal CA-630 in MTSB for 1 h. Non-specific sites were blocked in 3% BSA, 10% Horse Serum (HS) in PBS for 1 h at 37°C. H3K9me2 and H3K27me1 were detected with antibodies (Abcam ab1220 and Millipore 07-448, respectively) diluted 1:1000 in 1% BSA, 10% HS, 0.1% Tween-20 in PBS at 4°C overnight. Slides were washed with 3% BSA in PBS and incubated with donkey anti-mouse 555 and anti-rabbit 488 (A-31570 and A-21206 Thermo Scientific, respectively) diluted 1:500 in 1% BSA, 10% HS, 0.1% Tween-50 in PBS for 1 h. Following washes in 3% BSA in PBS, nuclei were counterstained with DAPI (Merck), washed with PBS and mounted in Mowiol 4-88 (Sigma). The localization of H3K9me2 and H3K27me1 in immunostained cells was analyzed by confocal microscopy (LSM710 Zeiss). Images were processed using Fiji.
Flow cytometry
MM2d cells were collected at either 4 or 7 days after subculture by vacuum filtration and the retentate was chopped in Galbraith solution (45 mM MgCl2, 20 mM MOPS, 30 mM sodium citrate, 0.1% Triton X-100, pH 7.0). Nuclei were filtered through a 30-μm nylon net filter (Millipore) and stained with 2 μg/ml DAPI. Nuclei populations were analyzed using a FACSCanto II High Throughput Sampler cytometer (Becton Dickinson) and FlowJo v10.1rS software (FlowJo).
RESULTS
High-resolution identification of ORIs in transposable elements
One of the strategies to identify ORIs relies on the isolation of small newly synthesized DNA molecules from replication bubbles. The identification of ORIs responsible for replication of pericentromeric heterochromatin requires very reliable genome annotation and peak calling algorithms. Probably because of that, it has never been undertaken systematically. In the case of Arabidopsis thaliana, an updated genome annotation (TAIR10), including highly repetitive pericentromeric regions, is now available. We have used these tools and sequencing data of purified BrdU-pulsed DNA extracted from Arabidopsis cultured cells (GSE21828) to generate a high-resolution map of ORIs, paying particular attention to those located in heterochromatic regions. Genes and TEs in Arabidopsis are not homogenously distributed along the chromosomes. TEs are largely, although not exclusively, concentrated in heterochromatic domains, and in particular at pericentromeric regions, whereas most genes are located in non-pericentromeric euchromatin domains (14). Since heterochromatin domains contain highly repetitive sequences, such as TEs, we first considered hits that unequivocally aligned to only one genomic location, leaving multihit reads for a subsequent analysis. This approach obviously rendered an underestimation of ORIs mapping to these regions but it provided a more confident dataset of ORIs responsible for heterochromatin replication.
Analysis of the coverage distribution of the reads using kernel density estimations (KDE) with window bin size ranging from 100 to 10 000 nt revealed that our sequencing reads are enriched in windows of 700–900 nt but not in the larger windows (5000–10 000 nt) (Supplementary Methods and Supplementary Figure S1). This suggests that ORIs in Arabidopsis are largely organized within initiation sites rather than in large initiation zones. However, in the absence of further information about the nature of ORIs in heterochromatin, we used various peak-calling algorithms (see Supplementary Methods). We found that the peak size distribution was, as expected, different for the different algorithms. The mean peak size ranged between 537 (MACS2.0) to 1232 (T-PIC), a relatively small peak size (Supplementary Figure S2A) and the interorigin distance distributions did not show large differences for the various algorithms (Supplementary Figure S2B). Moreover, independently of the algorithm used, the peak size and the interorigin distance in peri- and non-pericentromeric regions was very similar, in each case (Supplementary Figures S2A and S2B). This shows that ORI peaks are relatively small in the Arabidopsis genome, consistent with its compact nature and our KDE analysis. This is also in agreement with ORI mapping in other models systems with similar genome size (4,29,30). The total number of ORIs retrieved in each case was different, with SICER and T-PICs returning the largest values. A pair-wise comparison between different algorithms showed that MACS, BayesPeak and Homer rendered quite similar results as revealed by the percentage of coincidence (Supplememtary Figure S2C). Finally, visual inspection of the original reads in the genome browser across all chromosomes, led us to conclude that MACS1.4 provided a realistic identification of origins. Examples are shown in Figure 1A.
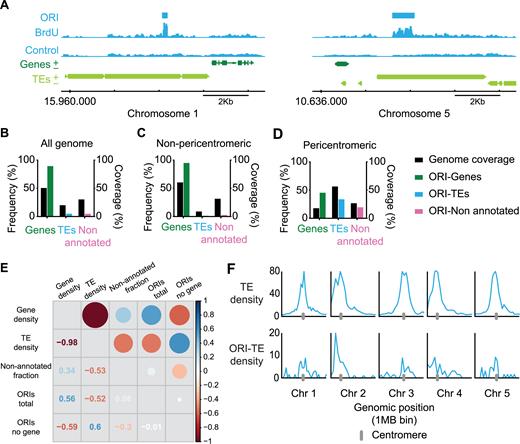
Genomic location of Arabidopsis DNA replication origins. (A) Representative genome-browser views of regions containing ORIs of chromosomes 1 and 5, as indicated. BrdU-peaks defining ORIs relative to the control are indicated (light blue bars). Genes (dark green) transcribed from each strand and TEs (light green) are shown along the chromosome together with the coordinate scale. Fraction of ORIs found in genes, TEs and non-annotated regions in (B) all the Arabidopsis genome, (C) the non-pericentromeric regions and (D) the pericentromeric regions, defined as having a gene frequency ≤40%, shown with the respective genome coverage. (E) Overall correlation between gene, TE and non-annotated fraction coverage and total ORIs and ORIs not located in genes. Correlations are represented with circles (gradation of red, anticorrelation; gradation of blue, positive correlation). The size of the circles corresponds to the correlation coefficient, also indicated in the other half of the plot. (F) TE density (% of nucleotides in TEs per 1 Mb bin) (upper panels) and chromosomal distributions of ORI-TEs across the five Arabidopsis chromosomes (lower panels).
Our analysis showed that ORIs have a strong preference to colocalize with genes. Out of a total of 3230 ORIs identified in the entire genome (Supplementary Table S3), of which 2888 (89.4%) colocalized with genes and 161 (4.9%) with TEs (Figure 1B; Supplementary Figure S3; Supplementary Table S4), a result in accordance with our previous overall analyses (7). However, this analysis also showed that the proportions changed drastically when we consider separately non-pericentromeric (chromosome arms) and pericentromeric regions. Indeed, whereas almost all ORIs (94.9%) colocalize with genes in gene-rich domains of chromosome arms, less than half of ORIs (45.3%) colocalize with them in the pericentromeric gene-poor regions where 33.7% colocalize with TEs (Figure 1D; Supplementary Table S4). Furthermore, the distribution of ORIs not located in genes positively correlates with the distribution of TEs, and not with the distribution of non-annotated regions (Figure 1E). Analysis of ORI-TE density along the Arabidopsis chromosomes visualizes the preference of non-genic ORIs to colocalize with TEs in pericentromeric regions (Figure 1F). These results suggest that TE sequences may be selected as ORIs in regions with a low gene density such as pericentromeric regions. To evaluate if the distribution of ORIs in TEs was affected by choosing the uniquely mapped reads, we repeated the analysis using the multihit sequence reads and found very similar results (Supplementary Table S5).
ORI-TEs preferentially colocalize with retrotransposons
TEs constitute a very heterogeneous type of repetitive elements that can be divided in different classes and families based on their structure and transposition mechanisms (31,32). Therefore, we first asked whether ORIs in TEs were homogenously distributed among the various TE families and found a striking preference for ORIs to associate with certain TE families (Supplementary Table S6). The vast majority of ORI-TEs (83.9%) is located in retrotransposons of the Gypsy, Copia and LINE families that account only for 42.4% of the TE genome space (Figure 2A). In particular, Gypsy elements that cover 29.4% of the TE genome space contain ∼50% of all ORI-TEs. On the contrary, ORI-TEs are clearly under-represented in other families, especially of DNA transposons. Helitrons, which have a similar prevalence compared to Gypsys, lack any detectable ORI-TEs and DNA/MuDR that account for 15.7% of the TE genome space contain only 3.4% of all ORI-TEs (Figure 2A). Since the pericentromeric regions concentrate most ORI-TEs, the tendency of ORI-TEs to colocalize with Gypsy elements could simply be due to the skewed distribution of Gypsy elements towards pericentromeric regions. However, our data show that ORI-TEs are overrepresented in Gypsy elements also in non-pericentromeric regions (Figure 2B and C). Moreover, the complete lack of ORIs in Helitrons, which account for more than 18% of the TEs in pericentromeric regions, also shows that this is not the case.
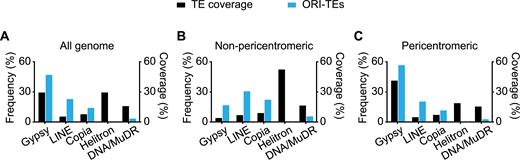
Frequency distribution of ORI-TEs in TE families. (A) All the Arabidopsis genome. (B) Non-pericentromeric regions. (C) Pericentromeric regions, (blue bar) shown with the respective TE family nucleotide coverage of total TE nucleotides (black bar).
Analysis of the multihit sequences revealed similar results (Supplementary Figure S4), indicating that the lack of ORIs in Helitrons is not due to a bias derived from sequence alignment problems. Importantly, the use of other peak-calling algorithms to identify ORIs in TEs also showed a preferential colocalization with retrotransposons and a similar distribution in the different TE families (Supplementary Figure S5). Together, these observations demonstrate that when ORIs associate with TEs they have a significant preference to colocalize with retrotransposons and specifically Gypsy elements, whereas they tend to be excluded from DNA transposons, in particular from Helitron elements.
Short nascent DNA strands (SNS) enrichment confirms the activity of ORIs mapped by BrdU-seq
To validate our ORI mapping strategy using a complementary method we determined the activity of a number of ORIs by quantitative PCR enrichment of a purified sample of short nascent strands (SNS) isolated from DNA replication bubbles (33,34). For a detailed validation of ORI activity, we designed sets of primer pairs across a chromosomal region containing one ORI overlapping with a TE in the arm of chromosome 1 (AT1TE62820) and another ORI ∼70 kb apart, colocalizing with a downstream gene (AT1g51350) within a typical euchromatic region. Cultured Arabidopsis cells were synchronized in G0 by sucrose deprivation and then samples were extracted 2 (G1/S), 3.5 (early S) and 7 h (late S) after release from the sucrose block. qPCR analysis was carried out in two consecutive fractions of the sucrose gradient to ensure reproducibility of the data. As expected, none of the ORIs selected were active at the earliest time point analyzed, 2 h after release of the sucrose block (Figure 3A). At later time points, a clear enrichment was detected in both cases, revealing the activity of these two ORIs in the cell population. Also, it is worth noting that the ORI located within a gene (Figure 3A, right panels) was ∼5–10-fold more active than the ORI colocalizing with a TE (Figure 3A, left panels). These experiments confirm that both predicted ORIs, located in a TE and in a gene, indeed function as ORIs. This analysis also showed that an ORI located at a TE in a chromosome arm is active in cultured cells, even when another stronger ORI is in the neighborhood, less than ∼70 kb apart.
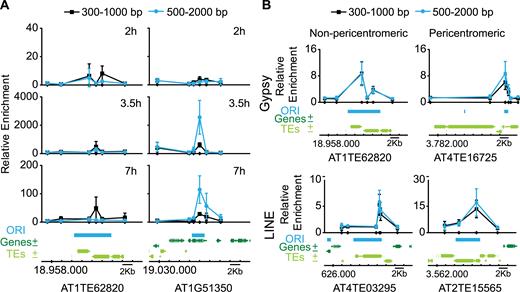
DNA replication origin activity determined by short nascent strand (SNS) abundance by qPCR. (A) Measurement of ORI activity in synchronized Arabidopsis MM2d cells at various times after releasing the block, as indicated (2 h, G1/S; 3.5 h, S; 7 h, late S). In each case, the confidence of ORI activity was assessed by analyzing in two consecutive fractions in three biological replicates. The fractions belong to the same gradient used for purification of SNS and contain DNA molecules ranging 300–2000 bp in size, as indicated at the top. Two ORI-containing regions (left panels, ORI colocalizing with a TE; right panels, ORI colocalizing with a neighbor gene) were analyzed. The location of primer pairs scanning the region is indicated by small dots on the X-axis. Enrichment values were made relative to the flanking region and normalized against gDNA. The mean values ± standard deviation is plotted. The genomic region under study depicting the location of ORI, genes and TEs is at the bottom. Chromosomal coordinates are indicated. (B) Measurement of ORI activity in asynchronous Arabidopsis MM2d cell cultures. The ORI-TEs were chosen according to their family (Gypsy and LINE) and location (non-peri- and pericentromeric), as indicated. The location of primer pairs is indicated by small dots on the X-axis. Two consecutive fractions of three biological replicates were analyzed, as described for panel A. Fractions containing smaller DNA fragments did not give reproducible SNS-qPCR enrichment. Enrichment values were made relative to a negative region that does not content any ORI or TE (AT2G28970). The mean values ± standard deviation is plotted. The genomic region under study depicting the location of ORI, genes and TEs is at the bottom. Chromosomal coordinates are indicated. Primers used are listed in Supplementary Table S2.
We also wanted to evaluate the activity of different ORI-TEs according to the TE family they colocalize with. Thus, we chose to validate and analyze in asynchronous cells, four genomic regions containing ORI-TEs: two belonging to the Gypsy family and two belonging to the LINE family (where ORIs are highly and moderately over-represented, respectively), and in each case one ORI located in pericentromeric heterochromatin and another in non-pericentromeric heterochromatic patches within the euchromatic arms. These regions were also selected based on the possibility to design a set of primer pairs that unequivocally identify them. We found that all ORI-TEs analyzed here were active as revealed by the qPCR enrichment of purified SNS (Figure 3B). These experiments confirm that the results obtained by direct sequence mapping of BrdU-labeled material represents a bona fide collection of active ORIs at heterochromatin and that TEs are a major source of ORIs in pericentromeric regions.
Are TEs containing ORIs reactivated in cell cultures?
The activity of ORIs has been frequently associated with the expression level of the genomic loci where they are located (2,35). Although the expression of TEs is usually strongly repressed, some TEs can be activated under stress situations (32,36). Notably, it was reported that in an Arabidopsis cell culture line typical heterochromatin marks change and some TEs are reactivated (37), in agreement with reports in Drosophila Kc and S2 cultured cells (38). Therefore, we determined the RNA levels across the ORI-containing region in each of the TEs selected previously. Our data showed that the RNAs derived from these elements were below detectable levels in all cases (Supplementary Figure S6). Similar results were obtained using either polyA-containing RNA or total RNA (Supplementary Figure S6). Furthermore, it is worth noting that the Athila elements, members of the Gypsy family, are among the most frequently reactivated TEs whereas the Atlantys elements, also from the Gypsy family, are very poorly reactivated (37). We found that ORIs colocalizing with Atlantys elements that account for ∼11% of all Gypsy elements are over-represented (43% of all ORIs in Gypsy elements). Consequently, we concluded that ORI-TE activity in our Arabidopsis cell culture line is independent of the transcriptional status of the TEs they are associated with. Based on these observations, we sought to identify whether a unique signature can be associated with the high preference of retrotransposon families for ORI specification.
The activity of ORI-TEs is maintained with high levels of mC and is independent of G quadruplexes
The majority of ORIs colocalize with genes which, when highly expressed, tend to be highly methylated at CG positions within the gene body, but not at CHG or CHH, the other sequence contexts where C methylation is found in plants (39). Moreover, the ±100 nt region around the ORI in euchromatin tends to be depleted of CG methylation (7), which suggests that ORI specification and activity may depend on low levels of methylation. TEs are heavily methylated in C residues of the three sequence contexts, and their methylation is actively maintained by RNA-directed DNA methylation (RdDM) and siRNAs (40,41). However, TEs may differ in their methylation state depending on the type, size or location (14,42). Thus, we used the available methylation data of the Arabidopsis genome (24) to ask whether differences in C methylation correlate with the preferential location of ORIs in certain TE family members. We found a tendency of Helitron elements, which do not colocalize with ORIs, to contain lower levels of C methylation for the three sequence contexts, whereas Gypsy elements, the most ORI-enriched TEs, showed higher methylation level (Supplementary Figure S7). This is in line with previous reports that showed that Helitrons tend to be less heavily methylated than Gypsy elements in Arabidopsis (14). Moreover, the level of C methylation of Gypsy elements does not vary depending on whether they colocalize or not with ORIs (not shown). Therefore, our data suggest that a low methylation level is not a requirement for ORI specification in TEs. Similar observations have been made for the heterochromatic X chromosome in mammalian cells where the level of C methylation does not affect ORI specification and usage (43). Although we conclude that a low C methylation does not seem to correlate with ORI activity in TEs, it must be kept in mind that DNA methylation levels in cultured cells may be different from those in leaves, at least for a subset of genomic regions.
G quadruplexes (G4) have been frequently found in association with TEs (44) and with ORIs in mammalian cells (4,45–47). Thus, we also asked whether the presence of G4 was a determinant factor in the distribution of ORIs in Arabidopsis cells. We found first that G4 motifs are far more frequent in TEs than in genes whereas ORIs highly prefer a colocalization with genes. Second, most G4 motifs occur in a TE family known as ATREP18, which contains a canonical telomeric repeat (48) and that is also found in pericentromeric regions. This family is included within the annotation class ‘DNA/Other’ that contains less than ∼1% of all ORI-TEs (Supplementary Figure S8). Third, and perhaps more relevant, both Gypsy and Helitron elements contain a very similar fraction of G4 motifs whereas they show an opposite preference to contain ORI-TEs (Supplementary Figure S8). Hence, our observations do not support the idea that G4 structures may be directly influencing ORI activity in Arabidopsis, and they do not explain the distribution of ORI-TEs among the different TE families found here.
ORI-TE activity and the chromatin landscape
We next focused on the chromatin landscape around ORI-TEs to identify a possible common signature. We have previously shown that the entire Arabidopsis genome is characterized by nine different chromatin states defined by specific combinations of DNA and histone marks (26). These chromatin states range from open chromatin present around TSS (state 1) and most proximal promoters (state 2) and 5’end of transcribed genes (state 3) to the highly-repressed heterochromatin states (8 and 9). To gain an overall view of the chromatin associated with ORI-containing TEs we looked for possible differences within TE families. We first investigated the whole chromatin signatures associated with the different TE families according to the known Arabidopsis chromatin states. Interestingly, we found that the majority of Gypsy, LINE and Copia families, which concentrate more than 80% of all ORI-TEs are associated with chromatin state 9 (Figure 4A left panels), characteristic of the GC-rich heterochromatin.
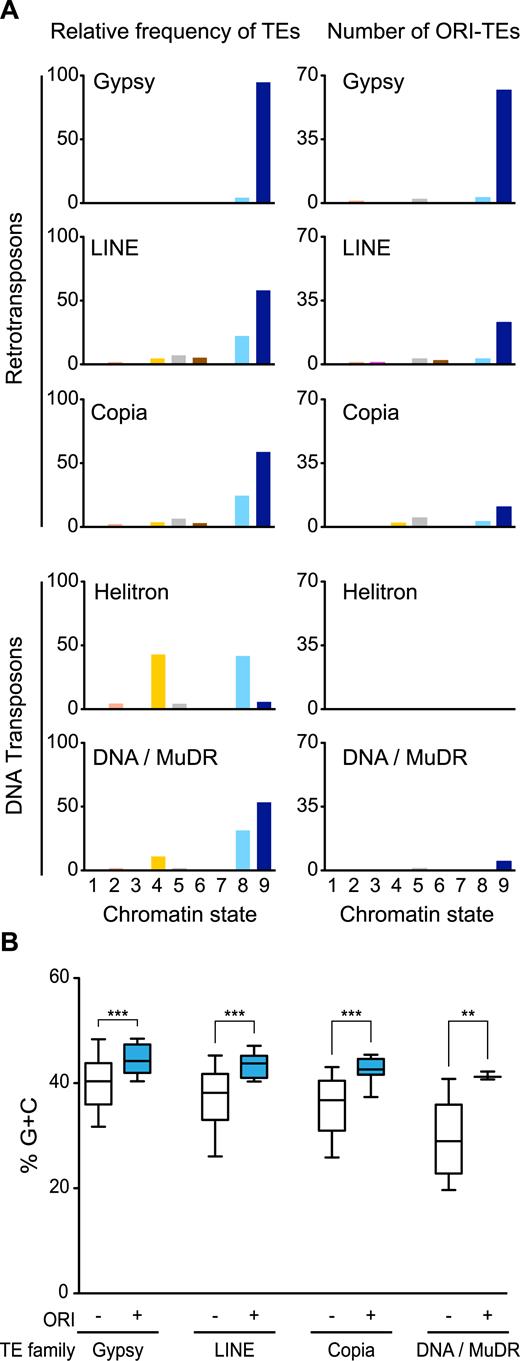
Distribution of retrotransposons and DNA transposons in the different chromatin states. (A) Relative frequency of several TE families (Gypsy, LINE, Copia, Helitron and DNA/MuDR) or ORI-TEs of those families with respect to total nucleotide family content, in the nine chromatin states. Chromatin states, largely corresponding to various genomic elements, are as follows: state 1, TSS; state 2, proximal promoters; state 3, 5’ half of genes; state 4, distal promoters enriched in H3K27me3; state 5, Polycomb-regions; state 6, 3΄ half of genes; state 7, long gene bodies; state 8, AT-rich heterochromatin; state 9, GC-rich heterochromatin. (B) Average G+C content of TEs with (blue) and without (white) ORIs in the different TE families. ***P < 0.0001; **P < 0.001 (unpaired t-test with Welch's correction; whiskers at 10–90 percentiles, outliers not represented in the graph).
This is particularly striking for the Gypsy elements, of which ∼95% are found in this heterochromatic state. On the contrary, Helitrons, which have a very low tendency to contain ORIs, are not associated with chromatin state 9 but to chromatin states 4 and 8 (Figure 4A, left panels). Chromatin state 4 is mainly associated with intergenic regions enriched in the Polycomb mark (H3K27me3), whereas chromatin state 8 is an heterochromatin state characterized by a lower GC content and a higher H3K27me3 level, as compared with the heterochromatin of chromatin state 9 (26). Very interestingly, ORI-containing TEs tend to be in the chromatin state 9, independently of their family (Figure 4A, right panels).
The main feature distinguishing the two heterochromatic states is the GC content, which is higher in chromatin state 9. In fact, this is a striking difference between TEs since the families that tend to contain ORIs (Gypsy, Copia and LINE) have a higher than genome average GC content. For instance, Gypsy elements contain 42.1% GC, the highest among TEs, compared with the 36.5% average GC content of the Arabidopsis genome (Supplementary Figure S9). On the contrary, Helitron elements are characterized by having a very low GC content (24.2%; Supplementary Figure S8). These differences in GC content do not have any impact on the potential to form G4 structures, as shown earlier, although they may have a direct impact on nucleosome organization (49,50). Importantly, however, calculation of the average GC content of TEs that contain ORIs revealed that it was statistically significantly higher than in TEs of the same family that do not contain ORIs (Figure 4B). This clearly suggests that a high GC content behaves as a determinant for ORI preference also at heterochromatic loci.
ORI-TE activity is maintained with high H3K9me2 levels
The association of ORI-TEs with a heterochromatin state is somehow surprising as most ORIs are located within genes that colocalize with euchromatic marks found in very different chromatin states (26). Even though we found that transcription at ORI-TEs is unlikely to be reactivated in cultured cells (Supplementary Figure S6), we decided to analyze the chromatin marks associated with ORI-TEs in the Arabidopsis MM2d cultured cells, as chromatin may undergo changes in some cultured cells (51).
We first looked at the overall levels of H3K9me2 and H3K27me1, two typical heterochromatic marks that strongly contribute to maintaining the silenced state of TEs in Arabidopsis (52,53), by immunolocalization in cultured cells. H3K27me1 showed a pattern colocalizing with increased DAPI signal whereas H3K9me2 had a dotted appearance in nuclear sites enriched for H3K27me1 and DAPI positive regions (Figure 5A), as it occurs in the nuclei of Arabidopsis plants. It must be noted that DAPI-stained chromocenters were not very apparent in nuclei of these cultured cells, suggesting a less condensed organization of the pericentromeric heterochromatin.
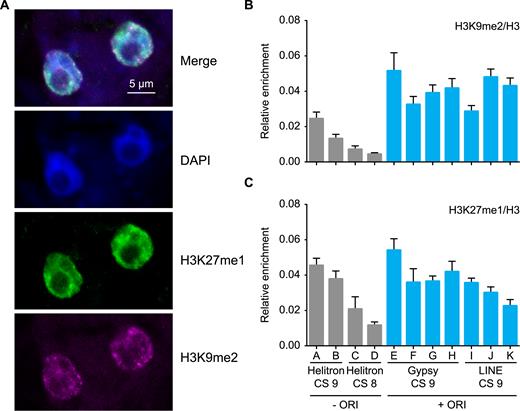
Heterochromatin marks in Arabidopsis MM2d cultured cells. (A) Immunolocalization of H3K9me2 (magenta) and H3K27me1 (green) in nuclei of cultured cells. Nuclei were stained with DAPI (blue). Levels of H3K9me2 (B) and H3K27me1 (C) determined by ChIP-qPCR in TEs representative of various families, chromatin states (CS) and with (blue bars) or without ORIs (gray bars). Enrichment values were made relative to the local H3 content determined by ChIP with anti-H3 antibody. Three biological replicates and two technical replicates were evaluated. The mean values ± standard error of the mean is plotted. The codes for the primer pairs used to identify each TE, according to the list in Supplementary Table S2, are: A, AT2TE13970; B, AT4TE16735; C, AT2TE16335; D, AT4TE17050; E, AT4TE16726–2; F, AT4TE16726–3; G, AT1TE62820–3; H, AT1TE62820–5; I, AT2TE15565–2; J, AT2TE15565–3; K, AT4TE03295–3.
To determine more precisely the levels of H3K9me2 and H3K27me1 marks in cultured cells we performed ChIP and analyzed a subset of TEs containing a functional ORI. Although Helitron elements are not associated with ORIs, we also evaluated some Helitron elements located in the two heterochromatin states (AT-rich and GC-rich chromatin states 8 and 9, respectively). In all cases we normalized the measurements to the local H3 content determined by ChIP with anti-H3 antibody. We found that, in all the examples analyzed, the Gypsy and LINE elements (GC-rich heterochromatin state 9) contain a high level of H3K9me2 (Figure 5B). We also found that in general the H3K9me2 level was higher in retrotransposons than in Helitron elements, independently of their chromatin state (Figure 5B), similar to what was reported in maize (53). In the case of H3K27me1, which is typical of heterochromatin and crucial to prevent re-replication (54), ChIP experiments revealed that the TEs analyzed showed various levels of H3K27me1 independently of (i) being Gypsy, LINE or Helitron, (ii) their chromatin signature and (iii) their colocalization with ORIs (Figure 5C). Alterations in the nuclear DNA content are indicative of massive defects in re-replication control and, indirectly, of possible decrease in H3K27me1, as it occurs in the atxr5,atxr6 mutant (54). Consistent with our ChIP data, we could not detect any significant alteration in the DNA content profile of cultured Arabidopsis cells (Supplementary Figure S10). Since retrotransposons are enriched for ORIs and H3K9me2 and there is a lack of correlation of H3K27me1 with ORI-TEs, these marks seem to be unrelated to ORI activity.
DISCUSSION
The results presented here show that whereas in euchromatic regions ORIs are almost exclusively located within genes, in the heterochromatic pericentromeric regions a significant fraction of ORIs colocalizes with TEs in Arabidopsis. This underscores the relevance of retrotransposons in contributing to genome replication, a key process during the cell cycle. We show here that the epigenetic marks associated with ORI-TEs (high methylation at all cytosine contexts, H3K9me2 and H3K27me1) are typical of heterochromatin and very different from those associated with euchromatic ORIs, suggesting that these marks do not interfere with ORI specification. Interestingly, ORI-TEs are not randomly distributed among TEs and show a striking tendency to colocalize with retrotransposons, and in particular with Gypsy elements. Transcription is the first and obligate step for mobilization of all retrotransposons, whereas DNA transposons are mobilized by a DNA intermediate and do not need to be transcribed. This makes retrotransposons more similar to genes than any other TE. Indeed, whereas most retrotransposons are silent in most plant tissues, their activation under stress or in particular mutant backgrounds confirms that they retain the capacity to be transcribed and to transpose (55,56). Another condition known to produce TE reactivation is immortalization of cells in culture. Although the cells lines used by Tanurdzic et al. (37) and by us are different, we found that the vast majority of ORI-TEs were not located in TEs reactivated in their cell culture. Therefore, our results show that the activity of ORI-TEs cannot be explained by transcription through TE sequences.
Both genes and retrotransposons show an above average GC content, which makes their sequences different from most DNA transposons and particularly Helitron elements. Importantly, TEs with ORIs possess a higher GC content than TEs without ORIs, independently of their TE family. Therefore, these results lead us to propose that a high local GC content, typical of the heterochromatin state 9 where the vast majority of ORI-TEs are located, in combination with the potential to be transcribed, characteristic of the genomic organization of retrotransposons, are the major features of ORIs colocalizing with TEs. These characteristics allow certain TE families to contribute to a significant fraction of ORIs in heterochromatic regions. This can be crucial to ensure correct replication of heterochromatic domains, which have a low gene density, thus compensating for the high preference of ORIs to localize in genes. Whereas the prevalence of Gypsy retrotransposons is particular to plants, retrotransposons make up an important fraction of the genome, and in particular of heterochromatic regions, of both plants and animals. For example, in mammals the L1 LINE accounts for as much as 20% of the genome and is enriched in heterochromatin (57). Interestingly, although LINEs represent a small fraction of Arabidopsis pericentromeric regions, we show here that they can also contribute to ORI specification. Although mouse ORIs have been mapped extensively in relation to their chromatin context a detailed localization of late-replicating ORIs, likely corresponding to heterochromatic regions, to specific genomic elements has not been undertaken (9). Therefore, it is therefore tempting to speculate that the contribution of retrotransposons to ORI specification in heterochromatin shown here for Arabidopsis could also be important in other eukaryotic species.
SUPPLEMENTARY DATA
Supplementary Data are available at NAR Online.
ACKNOWLEDGEMENTS
We thank the Confocal Microscopy and Flow Cytometry Services of CBMSO and V. Mora-Gil for technical assistance. We also thank M. Bernadó of CRAG’s genomics facility for assistance with statistical analyses. We thank E. Martinez-Salas for comments on the manuscript. Z.V. has been recipient of a FPI Predoctoral Fellowship from MINECO.
FUNDING
Ministerio de Economía y Competitividad [BFU2012-34821, BIO2013-50098-EXP, BFU2015-68396-R/FEDER to C.G., BFU2009-11932, AGL2013-43244-R to J.M.C.]; Fundación Ramón Areces to the Centro de Biologia Molecular Severo Ochoa. Funding for open access charge: Ministerio de Economía y Competitividad [BFU2015-68396-R/FEDER].
Conflict of interest statement. None declared.
Present addresses:
Elizabeth Hénaff, Department of Physiology and Biophysics, Weill Cornell Medical College, New York City, 10065 NY, USA.
Celina Costas, Departamento de Química Física, Universidad de Vigo, 36310 Vigo, Spain.
REFERENCES

Comments