


Abstract
ANISEED (www.aniseed.cnrs.fr) is the main model organism database for tunicates, the sister-group of vertebrates. This release gives access to annotated genomes, gene expression patterns, and anatomical descriptions for nine ascidian species. It provides increased integration with external molecular and taxonomy databases, better support for epigenomics datasets, in particular RNA-seq, ChIP-seq and SELEX-seq, and features novel interactive interfaces for existing and novel datatypes. In particular, the cross-species navigation and comparison is enhanced through a novel taxonomy section describing each represented species and through the implementation of interactive phylogenetic gene trees for 60% of tunicate genes. The gene expression section displays the results of RNA-seq experiments for the three major model species of solitary ascidians. Gene expression is controlled by the binding of transcription factors to cis-regulatory sequences. A high-resolution description of the DNA-binding specificity for 131 Ciona robusta (formerly C. intestinalis type A) transcription factors by SELEX-seq is provided and used to map candidate binding sites across the Ciona robusta and Phallusia mammillata genomes. Finally, use of a WashU Epigenome browser enhances genome navigation, while a Genomicus server was set up to explore microsynteny relationships within tunicates and with vertebrates, Amphioxus, echinoderms and hemichordates.
INTRODUCTION
The tunicate clade of marine invertebrate deuterostomes includes the sessile ascidians and the pelagic appendicularians and thaliaceans (1,2). A major interest of the scientific community for tunicates stems from the phylogenetic position of this chordate group, now considered to be the long-diverged sister group of vertebrates (3). Solitary ascidians and all appendicularians reproduce sexually only. By contrast, colonial ascidians and all thaliaceans reproduce both sexually and asexually by budding (1).
Ascidians, a paraphyletic group (4), are the largest and most studied group of tunicates. Major solitary ascidian model species, studied for their embryogenesis, aging and regeneration properties are Ciona robusta (formerly Ciona intestinalis type A), Ciona intestinalis (formerly Ciona intestinalis type B), Ciona savignyi, Phallusia mammillata, Halocynthia roretzi and Molgula oculata. The colonial ascidian Botryllus schlosseri is well known for studies on whole-body regeneration and stem cells (5), and on self/non-self recognition (6). Comparison of ascidian and vertebrate strategies can provide cues on the origin of vertebrate novelties such as the neural crest (7) or the second heart field (8). Their rapid molecular evolution is also informative on the plasticity of the chordate program of gene regulation (8–11) or of histocompatibility (6). In addition to this basic science focus, many solitary and colonial ascidian species are invasive, major contributors to bio fouling and, as such, pests for the aquaculture industry (12,13).
Over the past 20 years, an extensive functional genomics toolbox (14) has been developed to make best use of the simplicity of the embryo and genome (15) of Ciona intestinalis androbusta. This tool has now been extended/adapted to other tunicate species (16,17). Interference with gene function, initially relying on morpholino oligonucleotides, now includes the use of TALENs (18) and CRISPR/cas9 strategies (19,20).
ANISEED - Ascidian Network for In Situ Expression and Embryological Data—is the major database system in the Tunicate community, hosting and giving access to genomic, genetic and anatomical data on ascidian development. First published in 2010 (21), the database hosts and gives access to genomic, genetic and anatomical data on tunicates. Its refactoring using the Chado schema philosophy and its extension to 11 ascidian species was completed in 2015 (22). Since then, tunicate laboratories have rapidly embraced genomics, including ChIP-seq (23,24), RNA-seq of whole embryos (24) or FACS-sorted single cells (25), bisulphite sequencing (26), SELEX-seq and TSS-seq (27). The aim of the ANISEED 2017 update is to accompany the entry of tunicate biology into the genome-scale era through three types of improvements: extension/refactoring of mining and display tools, extension of pre-existing datasets and development of modules to host and give access to novel types of genomics data.
NEW DATA MINING/DISPLAY TOOLS
Taxonomy pages
A taxonomy page accessible from the home page was introduced in ANISEED 2017 to place the covered species into their phylogenetic context and facilitate the interpretation of comparative studies. The page shows a cladogram of the twelve species currently described at the anatomical or genetic level in the database. Each node gives access to a page describing the corresponding species. Following the novel taxonomy (28) and a community decision at the 2017 international Tunicate Meeting, Ciona intestinalis type A has been renamed Ciona robusta throughout the database; while Ciona intestinalis type B is now referred to as Ciona intestinalis. No molecular data are currently associated to this latter species in ANISEED, as its genome draft is of insufficient quality to build gene models.
Each species page briefly describes the species, its distribution and its ecology, lists the number of ANISEED entries and provides a link to the corresponding ANISEED genome browser. This page also links to other tunicate molecular databases (DBTGR (29), CiPro (30), Ghost (31) and FABA (32) for Ciona robusta), to the CRISPOR CRISPR/Cas9 guide RNA design tool for ascidian species (33), as well as to major ecological databases, including the Ascidiacea World Database from the World Registry of Marine species (WoRMS) (34), the Global Biodiversity Information Facility (GBIF) (35), or the Global Invasive Species Database (http://www.invasivespecies.net/). Finally, for practical purposes, the page lists for each species the animal providers used in the scientific community.
Interactive gene phylogenies
The diversity of ascidian species with an assembled genome provides a framework to study the evolution of developmental mechanisms. To identify orthologous genes within tunicates and with chordates, ANISEED 2015 used an orthology pipeline based on the OrthoMCL software (36) and listed for each gene the cluster of homologous genes it was associated to. In many cases, clusters were large, and in the absence of phylogenetic trees, the system did not allow the identification of accurate 1-to-1 orthology relationships within the list.
We thus refactored the ANISEED 2017 orthology pipeline. We first used SiLiX (37) to build clusters of homologous genes from 18 species (6 vertebrates, 9 ascidians, 1 lancelet and 2 non-chordate deuterostome outgroups). A phylogenetic tree was then inferred for each cluster using RaxML (38) under the LG+Γ4+F evolution model (See supplementary methods). Trees for approximately 60% of the coding gene models of each ascidian species are displayed interactively on the corresponding gene card using PhyloCanvas (http://phylocanvas.org) (Figure 1). This procedure identifies unequivocal vertebrate orthologs for ∼30% of ascidian genes (average number of human orthologs/C. robusta gene: 2.8). A similar frequency of tunicate genes with clear human orthologs is also observed in ENSEMBL 90 (28% of C. robusta genes with high-confidence human orthologues). While this situation may reflect the large genetic distance between tunicates and vertebrates, we noticed that orthology relationships could also be confounded by the position the non-olfactorian outgroups (Figure 1). Approximately 25% of ascidian genes without clear vertebrate orthologs have at least one ortholog in an ascidian of a different order (Supplementary Table S1).
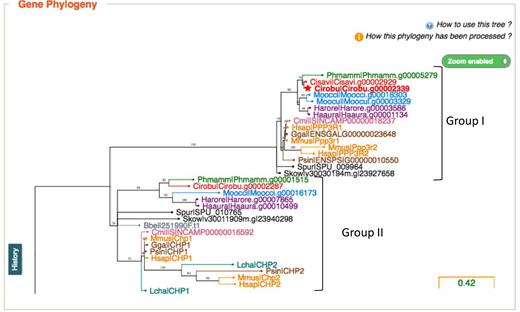
Interactive gene Phylogenies. Screenshot from a part of the phylogenetic gene tree including genes Cirobu.g00002339 and Cirobu.g00002287. Species are color-coded and the tree can be compressed or extended lengthwise and zoomed in and out. Note the difference between the two groups of genes. In group I, the gene phylogeny follows the species phylogeny, and tunicate genes are considered orthologous to the vertebrate genes of the group. In group II by contrast, the gene phylogeny does not follow the species phylogeny, and we consider that the tunicate genes have no unequivocal vertebrate orthologs.
New genome browsers
ANISEED 2015 featured Gbrowse 2.0 (39) genome browsers, which showed limitations as the size of the dataset increased. The WashU Epigenome browser (40) was selected as a replacement and adapted with the help of its developer. It offers increased speed and the ability to represent genome-wide chromatin interaction data (41). Within or between genome comparisons are facilitated by the display in a unique window of concatenations of sets of gene loci within a species, or between species (e.g. orthologous loci to explore synteny relationships).
Tracks presented are grouped into three categories. ‘Annotation tracks’ provide general background information (gene models, repeated elements, inter-species genome sequence comparison, genome alignment, operons, cis-regulatory sequences, Ns and GC content). ‘Public track hubs’ group tracks presenting the information gathered within a specific project or using a specific genome-scale technique (RNA-seq, TSS-seq, methyl-seq, SELEX-seq, ChIP-seq: see below). For each public hub, a precise description of the content and methods is provided. Finally, ‘Custom tracks’ can be uploaded as individual tracks or hubs. Each session can be saved and shared with other scientists. A useful wiki handbook is provided by the developer (wiki.wubrowse.org).
The WashU and Gbrowse 2.0 browsers will coexist until summer 2018, after which only the WashU browser will remain. During this 1-year transition period, the addition of new tracks, some of which are presented here, will be restricted to the WashU browser.
Tunicate genomes rapidly diverge at the local sequence level, as well as in their organization. To further explore the conservation of genome organization within deuterostomes, we implemented a Genomicus synteny browser (42), based on the refined orthology relationships described above. This tool provides powerful visualization interfaces, such as karyotype View to explore genome organization (Figure 2A) and PhyloView to display the evolution of microsynteny relationships within ascidians and with vertebrates or non-chordate deuterostomes (Figure 2B).
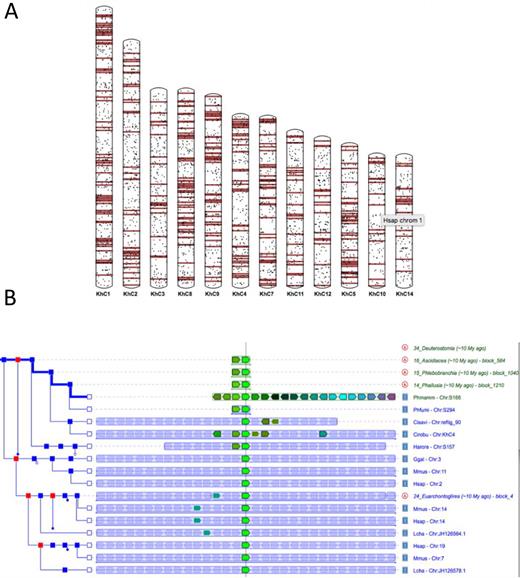
Genomicus and the study of global and local genome rearrangements. (A) Karyotype view showing the mapping of segments of Human Chromosome 1 onto Ciona robusta chromosomes. (B) Phyloview of the Phallusia mammillata gene Phmamm.g00004580 showing rapid loss of microsynteny within tunicates and complete loss with vertebrates.
EXTENSION OF PREEXISTING DATA TYPES
Functional gene annotations
Functional genome annotation (transcript and gene models, orthology to other tunicates, to vertebrates and to other deuterostomes, best blastp hit to human proteins, Interpro and GO annotations) was extended to all species with a genome assembly of sufficient quality to support gene model building, including three species previously only represented on the genomic browser: Phallusia fumigata, Halocynthia aurantium and Molgula occidentalis.
Gene models are annotated on each gene page and also provided as annotation tracks on the browsers. A link to alternative NCBI and ENSEMBL gene models is provided on each gene card. Manually-curated gene names respecting the tunicate nomenclature guidelines (43) are currently being generated by a dedicated committee and will be gradually added until the next official release. Genes can currently be searched for in ANISEED and in the WashU browser by unique gene or gene model Ids, by name of their most related human gene, or through the ANISEED blast server, which can now blast protein or nucleotide queries against both whole genomes or transcript model sets.
The functional annotation of ascidian gene models is based on Gene Ontology (44) terms. Because of the complexity and depth of the GO ontology, containing more than 40 000 terms, genes with similar function can be annotated with distinct terms, which can confound GO term enrichment analyses (45). To overcome this issue, we used an objective framework Information Content algorithm (46, stringency parameter 0.2) to define a smaller Tunicate GO Slim of 633 terms (MF:129; BP: 374; CC: 130), which provide higher level and more consistent annotations. We mapped global GO annotations onto this GO slim and propose this annotation in the download section of the database. For Ciona robusta, this process led to the annotation of 69% of genes with at least one term of each MF, BP and CC category.
Manually curated data
ANISEED hosts both large-scale data, automated annotations, and manually curated data from the literature or communicated by partner laboratories. This latter category, which now forms 30% of total gene expression patterns in Ciona robusta, is crucial to contextualize large-scale datasets, and is the primary source of expression profiles in altered developmental conditions (gene knock-down or overexpression; 6% of Ciona robusta dataset). Table 1 presents the growth of major sections of ANISEED between 2010 and 2017. The majority of the new data originates from the manual curation of 33 articles describing the development of Ciona robusta, published between 2012 and 2016, including 19 describing neural development, a very active field of Ciona research. The newly curated dataset set also includes 3 Halocynthia roretzi articles.
Evolution of the number of entries in ANISEED between October 2010 and October 2017
| Class of entries | 2010 | 2015 | 2017 | ||||||||
|---|---|---|---|---|---|---|---|---|---|---|---|
| Species | Halocynthia roretzi | Ciona robusta | Halocynthia roretzi | Ciona robusta | Halocynthia roretzi | Ciona robusta | Phallusia mammillata | ||||
| Measure; | Number | Number | Number | % Increase /2010 | Number | % Increase /2010 | Number | % Increase /2015 | Number | % Increase /2015 | Number |
| Articles in Pubmed (query: species + gene + development) | - | 214 | NA | NA | 280 | 31% | 79 | NA | 339 | 21% | 7 |
| Articles in ANISEED | 1 | 160 | 1 | 0 | 217 | 36% | 4 | 300% | 253 | 17% | 0 |
| Molecular Tools | 0 | 619 | 0 | NA | 769 | 24% | 0 | NA | 874 | 14% | 0 |
| Regulatory Regions Analyzed (literature) | 0 | 528 | 0 | NA | 875 | 66% | 0 | NA | 1102 | 26% | 0 |
| Spatio-temporal patterns of cis-regulatory activity (literature) | 0 | 777 | 0 | NA | 944 | 21% | 0 | NA | 1152 | 22% | 0 |
| Gene Expression Patterns in Mutant Embryo (literature) | 0 | 1152 | 0 | NA | 1294 | 12% | 51 | NA | 1860 | 44% | 0 |
| Gene Expression Patterns (literature) | 28 | 4259 | 51 | 82% | 6545 | 54% | 154 | 202% | 7717 | 18% | 0 |
| Gene Expression Patterns (large scale) | 5825 | 21017 | 5825 | 0% | 21017 | 0% | 5825 | 0% | 21538 | 2% | 262 |
| Total Gene Expression Patterns | 5853 | 25276 | 5876 | 0% | 27562 | 9% | 5979 | 2% | 29255 | 6% | 262 |
| Nb of genes described | 933 | 4000 | 937 | 0% | 4500 | 13% | 943 | 1% | 4750 | 6% | 31 |
NEW DATASETS
Annotated Repeated elements
Repeated elements, previously not described, were detected for all nine species, and each element was analysed and named according to the guidelines for the nomenclature of tunicate genetic elements (43). These elements are displayed in the ‘Annotation tracks’ section of the WashU genomic browser.
RNA-seq
RNA-seq provides a quantitative estimation of the steady-state expression level of genes in wild-type and experimentally perturbed conditions. Gene cards in ANISEED 2017 include in a new section of the expression tab a summary of gene expression dynamics across all wild-type and mutant RNA-seq experiments analysed (Supplementary Figure S1). For each experiment two complementary but comparable normalizations are displayed: FPKM/RPKM and an ‘unlogged’ version of RLE (47). The former is best to compare the expression of different genes in the same experiment, while the latter is a better choice to compare the expression of a given gene across experiments. Note that ‘unlogged’ RLE values are not suitable for statistical analysis. The download button of the page thus returns the true logarithmic RLE value.
Two sets of data of immediate interest to the community were quantified. The first dataset is composed of unpublished stranded RNA-seq data for whole embryos of seven developmental stages ranging from egg to hatching larva in three species (Ciona robusta, Phallusia mammillata and Halocynthia roretzi). This dataset allows comparing the expression dynamics of orthologous genes in these three divergent ascidian species. Note that the Ciona data are from Ciona intestinalis embryos, but in the absence of a high quality C. intestinalis genome assembly, were mapped onto the Ciona robusta genome and considered to reflect the expression of the Ciona robusta orthologs. The second dataset (NCBI bioproject PRJDB3843) compares wild-type, Bmp-treated and Bmp-inhibited (Dorsomorphin) Ciona robusta late gastrula embryos. Additional datasets will be progressively integrated as they become public. Each of these datasets is also integrated as a public hub in the WashU browser.
RNA-seq usually poorly represents immature unspliced transcripts. This technique is therefore inadequate to identify Transcription Start Sites (TSS), in particular in ascidians, which make frequent use of trans-splicing (10). Recently, high-throughput RNA-sequencing techniques were developed to produce precise and quantitative genome-wide mapping of TSS, thereby allowing a better analysis of promoters (48). The Ciona robusta WashU browser of ANISEED 2017 includes a public hub with TSS-seq mapping for a set of adult tissues, and whole larvae (27).
ChIP-seq
In addition to the Ciona robusta ChIP-chip data for 11 transcription factors previously displayed on the Ciona robusta genome browser (49), ChIP-seq data for three additional transcription factors at the 32-cell stage (23) are now accessible as public hubs in the C. robusta WashU browser. ChIP-seq for the promoter-specific H3K4me3 histone mark in C. robusta and P. mammillata are also provided to help, combined with TSS-seq data, with the identification of basal promoters.
SELEX-seq
Gene expression is controlled at the transcriptional level by non-coding cis-regulatory sequences that act as binding platforms for transcription factors, which recognize specific DNA sequences. The knowledge of this binding specificity is a major help in deciphering the gene regulatory networks that underlie biological function. ANISEED 2017 describes the in vitro DNA-binding specificity of 131 of the estimated 500 transcription factors encoded in the Ciona robusta genome. These DNA-binding specificities, determined by SELEX-seq (50), are accessible via a specific tab in the gene card, which describes the details of the enrichment procedure and DNA-binding specificity and the relatedness of DNA-binding specificity to mammalian orthologs (50,51). 6-mer enrichments values and Position Weight Matrices can also be downloaded from this page. In addition, public hubs on the Ciona robusta and Phallusia mammillata WashU browsers group tracks of local predictions of binding affinity for each of these 131 C. robusta transcription factors and their 79 P. mammillata orthologs (Figure 3).
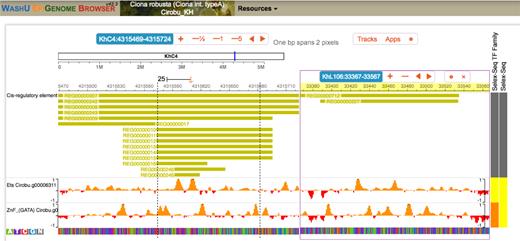
Simultaneous visualization of candidate transcription factor binding sites in two known regulatory sequences. The WashU epigenome browser allows splitting the display to show two independent loci from the same genome. Here the display shows regulatory sequences of the Cirobu Otx (Cirobu.g00006940; left part of the window) and Nodal (Cirobu.g00010576; right part of the window) genes, and predicted local in silico binding affinity for transcription factors of the ETS and GATA families, known to regulate these enhancers.
HOSTING OF PRIVATE NEW TUNICATE GENOMES
ANISEED offers to host on its genome browsers and blast servers, password-protected, private genomes sequenced by members of the community. Two genome projects are currently hosted and kept private until their publication in peer reviewed journals: the colonial stolidobranch ascidian Botrylloides leachii and the solitary phlebobranch Corella inflata.
WEBSERVICES AND DOWNLOADS
To facilitate the programmatic extraction of datasets and the development of external modules relying on ANISEED data, we developed an Application Programming Interface (API), accessible from the main menu. Currently, the main functions allow retrieving genes according to their expression patterns, articles and authors, cis-regulatory regions and cis-regulatory constructs and cDNA clones.
The download section was enriched with standardized GAF files with functional gene annotations for all species. Two functional annotations are proposed for each species, one based on the full Gene Ontology, the other on the tunicate GOslim we developed, which can also be downloaded. The gene trees are also available (.tre format). Finally, 6-mer enrichments and Position Weight Matrices for all rounds for 131 SELEXed Ciona robusta transcription factors are accessible.
FUTURE PESPECTIVES
ANISEED 2017 marks a substantial improvement in the content and organization of the main tunicate model organism database. The diversity and depth of the added data attests of the dynamism of this small scientific community of less than a hundred labs worlwide.
One major evolution over the past two years was the discovery that the species initially called Ciona intestinalis comprises at least two independent species, Ciona robusta (formerly called Ciona intestinalis type A and found in all major oceans) and Ciona intestinalis (formerly called Ciona intestinalis type B, and mostly restricted to the North Atlantic) (28). In this version of ANISEED, we therefore reallocated all Ciona intestinalis data to Ciona robusta, which is now the most studied Ciona species. To facilitate interoperability and comparison between databases and to avoid confusion between species, it will be important for the Ciona community to also press for a reassignment of data to their correct species in generalists databases including NCBI, ENSEMBL, Uniprot or UCSC, which have so far not adapted to the new taxonomy.
We would also like to extend the database, beyond ascidians, to appendicularians and thaliaceans. While genomic information remains very partial in thaliaceans (52), high-quality genomic (53), transcriptomic (54) and functional (55) data exist for the appendicularian Oikopleura dioica, and we have established contact with the scientific community working on these animals. Computing accurate orthology relationships for most genes of these fast evolving taxa may, however, prove particularly challenging, and may require further optimization of our procedures.
SUPPLEMENTARY DATA
Supplementary Data are available at NAR Online.
ACKNOWLEDGEMENTS
We thank the Si2C2 IT service of CRBM/IGMM/IRIM for support throughout the project, in particular Danielle Avinens and Patrice Langlois. We are grateful for the advice provided by the WashU Epigenome Browser team, in particular Daofeng Li, during the adaptation of this browser. This is contribution ISEM 2017-259 of the Institut des Sciences de l’Evolution de Montpellier (ISEM).
FUNDING
Agence Nationale de la Recherche (ANR) [Equipex Morphoscope2 ANR-11-EQPX-0029 to P.L.; Chor-Reg-Net NT05–2_42083 to P.L., C.C.; Chor-Evo-Net ANR-08-BLAN-0067-01 to P.L.; Institut de Biologie Computationnelle ANR-11-BINF-0002 to P.L.; Renabi-IFB, ANR-11-INBS-0013 to P.L.; TED, ANR-13-BSV2–0011-01 to P.L., E.D.; ANR-10-BINF-01-03, ANR-10-LABX–54 MEMOLIFE and ANR-10-IDEX-0001-02 PSL* Research University to A.L.; ANR-16-CE92-0019 evobooster to J.N.V.]; Dopaminet European project (to P.L.); National Institutes of Health (NIGMS) [R01 GM096032 to L.C.]; Japan Society for the Promotion of Science (JSPS) KAKENHI [16H04724 to K.N.]; ANR and CNRS (to K.R.N.); ANR TED project (to P.S.); Marie Curie IIF cis-reg-logic (to E.J.); National Institutes of Health [R00 HD084814 to A.S.]; National Institutes of Health (NHGRI) [5U41HG002371-15 to M.H.]. Funding for open access charge: Institut de Biologie Computationnelle, Montpellier, France.
Conflict of interest statement. None declared.
REFERENCES
Author notes
These authors contributed equally to this work as first authors.

Comments