


Abstract
Over the past 10 years, genomes of cultivated rice cultivars and their wild counterparts have been sequenced although most efforts are focused on genome assembly and annotation of two major cultivated rice (Oryza sativa L.) subspecies, 93-11 (indica) and Nipponbare (japonica). To integrate information from genome assemblies and annotations for better analysis and application, we now introduce a comparative rice genome database, the Rice Genome Knowledgebase (RGKbase, http://rgkbase.big.ac.cn/RGKbase/). RGKbase is built to have three major components: (i) integrated data curation for rice genomics and molecular biology, which includes genome sequence assemblies, transcriptomic and epigenomic data, genetic variations, quantitative trait loci (QTLs) and the relevant literature; (ii) User-friendly viewers, such as Gbrowse, GeneBrowse and Circos, for genome annotations and evolutionary dynamics and (iii) Bioinformatic tools for compositional and synteny analyses, gene family classifications, gene ontology terms and pathways and gene co-expression networks. RGKbase current includes data from five rice cultivars and species: Nipponbare (japonica), 93-11 (indica), PA64s (indica), the African rice (Oryza glaberrima) and a wild rice species (Oryza brachyantha). We are also constantly introducing new datasets from variety of public efforts, such as two recent releases—sequence data from ∼1000 rice varieties, which are mapped into the reference genome, yielding ample high-quality single-nucleotide polymorphisms and insertions–deletions.
INTRODUCTION
Rice is one of the economically important monocot crops in the world. Since 2002 when genome assemblies of the two major rice varieties (Oryza sativa L. ssp. indica 93-11 and Oryza sativa L. ssp. japonica Nipponbare) were published (1,2), efforts to construct better rice reference genomes continue even to this date (3,4). Comparative analyses on rice and other large plant genomes have been promoting the application of genomic research activities to agricultural practice, such as marker-assisted breeding for the improvement of biotic and abiotic stress resistances (5,6). Although there have been a number of databases or web servers constructed for rice and related plant genomes (7–9), a comprehensive database or knowledgebase for general rice genomic information is still necessary, especially when data are still being generated in a fast rate for this much treasured crop.
We started our database with sequence information from five rice varieties, including a japonica variety Nipponbare, an indica variety 93-11, a complex indica variety PA64s (55% indica + 25% japonica + 20% javanica), the African rice Oryza glaberrima and a wild rice species Oryza brachyantha, and excavated information on sequence variations, gene expression profiles and subspecific phenotypes. We have several reasons to select these five rice subspecies. First, all of them have relatively complete genome assemblies based on high-coverage sequence data, as most other assemblies are rather partial or assembled based on low-coverage sequences. Second, data from these five genomes already allow users to address many interesting biological questions and to perform certain comprehensive comparative analysis, which may include wild versus cultivated, japonica versus indica, African versus Asian and maternal parent versus paternal parent of a super-hybrid. In particular, we anticipate that RGKbase is able to provide the most up-to-date molecular information for deciphering mechanisms on hybrid vigor (or heterosis) and other complex agronomic traits to rice biologists (10). RGKbase adopts parallel annotation pipelines for repetitive sequences, protein-coding genes, noncoding RNAs, genome compositional changes, sequence variations (such as single-nucleotide polymorphisms or SNPs and insertions–deletions or InDels) from individual genomes and in comparative frameworks between a reference rice genome (Oryza sativa L. ssp. japonica Nipponbare) and other varieties. RGKbase not only reveals genomic characterizations among different genome assemblies but also evaluates pros and cons among various genome annotation approaches and tools used in plant genomics.
IMPLEMENTATION
We implemented the Linux-Apache-Mysql-Php infrastructure to realize dynamic invocation and optimization and HTML/javascript to write the static and simple user-responsive webpage. To accelerate the performance of Gbrowse/Gbrowse-syn displays, we imported a large amount of trace data in the gff3 format into a mysql database. We fully configured compatible Java, Bioperl, C++ and Python in the background of Linux environment. The major programs used as tools are written in Perl codes and graphs are plotted by using R codes. Larger downloadable data stored in this database are compressed in *.bz or *.gz to significantly reduce file sizes.
LITERATURES
We collected >300 published articles related to rice genomics from PubMed (http://www.ncbi.nlm.nih.gov/pubmed/) and Google Scholar/Google in eight categories: species, genomics, transcriptomics, proteomics, epigenetics, QTLs, intraspecific polymorphisms and comparative genomics. We also listed the quintessence and raw references on the RGKbase pages. Primarily, we organized the literatures chronologically, covering publications in physical mapping, sequence assemblies and functional genomics. We also introduced basic biology, agronomic trait information and following-up research activities on the five rice varieties. Users are able to review the history of rice biology from molecular genetics to genomics.
DATA CONTENT
Genome sequences
We obtained genomic data for four of the five rice varieties from Ensembl Plant Database (Version 14, http://plants.ensembl.org/, ftp.ensemblgenomes.org) and assembled the genome sequence of PA64s based on data produced in our own laboratory and acquired by using the Roche 454 and Life Technologies SOLiD platforms (D. Wang et al., in preparation).
Repetitive elements
Rice genome is composed of diversified repetitive elements (11). We adopted Repeatmasker 3.3.0 and its rice library (http://www.repeatmasker.org/) to scan sequences of long terminal repeat (LTR), long interspersed element (LINE), short interspersed element (SINE), DNA transposon, simple repeat and low complexity and RepeatModeler 1.0.5 (http://www.repeatmasker.org/RepeatModeler.html) for the identification of novel repeats predicted just based on copy numbers of selected repeat sequences. We integrated many complementary tools to identify specific repetitive elements and to scan the genome assemblies using manually created data, such as RetrOryza database (containing the low copy number elements) (12), LTR (LTRharvest1.4.1, LTR_finder1.0.5 and LTR_STRUC1.1) (13–15), MITE/miniature inverted-repeat transposable elements (MITE_Hunter 2010version) (16), tandem duplications (TRF/Tandem repeats finder 4.04) (17) and microsatellites (SciRoKo 3.3) (18). We used results derived from each method instead of combining all predictions to scan the genome assemblies, since a combined approach may lead to disruptions of transposon structures.
Genome compositional dynamics
The nucleotide frequency of G (guanine) + C (cytosine) or the alteration of the two nucleotides is associated with gene density, regulatory elements and transcription activity (19). We introduced IsoFinder (20) and GC_profile2.0 (21) to identify putative isochores (large ones of high-GC or low-GC chromosomal segments) in the rice genome; the former defines long homogeneous genomic regions and the latter uses the Z-curve methodology. In addition, we identified CpG islands (CGI) using CpGcluster2.0 (22) that considers the distribution of information distance between two neighboring CpG sequences. We used EP3 (23) to further predict promoters and mapped 576 experimental promoters from PlantProm DB (24) onto the genome sequences in order to search for transcription start sites and complex relationship between promoters and CGI sequences.
Gene annotation
Currently, the genome assemblies in RGKbase were annotated with 69 456 plant RefSeq mRNAs (Arabidopsis thaliana, Glycine max, Oryza sativa japonica, Solanum lycopersicum and Zea mays) from NCBI ftp database (ftp.ncbi.nih.gov/refseq/) (25) and 536 029 Swiss-Prot proteins from UniProt database (ftp.uniprot.org/) (26). The genes were also predicted based on FGENESH after the assemblies were repeat-masked (but not filtered for simple repeats or low-complexity sequences) and subjected to de novo prediction and evidence-based mapping. In addition, Snap (27) and Nscan/Twinscan (28) were also used for protein-coding gene annotation. The annotated protein sequences were submitted to Interproscan version 5RC2 (29) that integrated many popular tools such as ProDom, PANTHER, PROSITE, Pfam and SMART. This system can be used for gene ontology (GO) term and protein domain annotations. We also integrated pathway annotations by using KEGG API Server (http://www.genome.jp/kegg/) (30) with a bi-directional best hit approach. Regarding transcription factors and three-dimensional structures, we mapped protein sequences to plant transcriptional factors in reference to PlnTFDB 3.0 (http://plntfdb.bio.uni-potsdam.de/v3.0/) (31) and PlantTFDB 2.0 (http://planttfdb.cbi.edu.cn/) (32) as well as proteins in PDB (www.rcsb.org/) (33). In fact, we only selected the best hit as the annotation of each protein. We subsequently used tRNAscan1.3.1 (34) to generate information on location, sequence and secondary structure of tRNAs. We annotated rRNAs by adopting RNAmmer (35) and utilized snoReport for snoRNAs (small nucleolar RNAs) (36). We used 1 331 936 rice expressed sequence tags (ESTs) from dbEST database (http://www.ncbi.nlm.nih.gov/dbEST/) (37) as the first gene annotation dataset, including those from Oryza sativa (1 252 989), Oryza longistaminata (71 367), Oryza minuta (5309), Oryza officinalis (1468) and Oryza punctata (803). Both UniProt proteins and RefSeq plant mRNAs were also used independently for the validation of de novo predictions and EST-based gene annotations. miRNA sequences from miRBase (Version 19, http://www.mirbase.org/) (38) covering species with diverse evolutionary history and PMRD (http://bioinformatics.cau.edu.cn/PMRD/) focusing on plants (39) were also mapped onto the genome assemblies by using MapMi (40).
Gene transcription and translation
Both microarray-based and high-throughput RNA-seq data from the same rice variety are used for RGKbase. For the microarray data, we mapped probe sequences onto the predicted mRNAs or coding sequences (CDSs) and only selected the best or the only match as derived position. As to the RNA-seq data from three subspecies (41,42), we combined Tophat and Cufflink to map transcripts for estimating gene expression with FPKM values (43). We used the gff guiding for gene expression estimation but did not adopt this parameter for building RNA-seq gene models in order to find novel splicing events. In addition, we downloaded eight epigenetic datasets from four types of libraries (DNA methylation McrBC-Seq, H3K4me3 ChIP-Seq, H3K9ac ChIP-Seq and H3K27me3 ChIP-Seq) and the two major rice subspecies (Nipponbare and 93-11) (44). We subsequently mapped the data onto the two genome assemblies and integrated them as tracks in Gbrowse. We extracted proteome data from OryzaPG-BD (http://oryzapg.iab.keio.ac.jp/) (45) and used results from our previous study on 93-11 and PA64s (46), employing blastp for choosing the best hit as a standard for protein identification.
Intraspecific polymorphisms
The polymorphism data are essentially from two sequencing projects; one is a comparative analysis of the five model rice genome assemblies and the other is a collaborative project to sequence 1000 rice varieties for polymorphism studies (6,47). Since the original data were mapped onto the IRGSP’s v4 reference (http://rgp.dna.affrc.go.jp/IRGSP/), RGKbase uses it as the intermediate genome to locate sequence variations.
Comparative genomics
Since our data are mainly from a single species and its assumed wild ancestors, most of the variations we collected are intraspecific (specific to rice) and subspecific (specific to subspecies or varieties). Our data were structured at three levels. First, we chose the Nipponbare genome as the reference and compared it with the other four genome assemblies in a pairwise fashion. The sequences were aligned based on Lastz (48). Briefly, the subject sequence was mapped in both forward and reverse directions onto the reference, and gaps were allowed since the intergenic sequence has more repeats so that it is not usually mapped well (49). In addition, we also provided comparative analysis for each chromosome to itself and to other chromosomes within each rice genome assembly with gap penalty since plant segmental duplication events happen not only within internal regions of the same chromosomes but also between chromosomes (3,50). Pecan was used for alignment in a unit of chromosome and a Perl script was written to identify consensus sequences that are assumed as ancestral sequences (51). Second, we identified homologous genes by carrying out an all-blast (to)-all protein matching using E-value = 1E−5 and identity ≥30% as cut-offs. Protein families were determined based on Tribe-MCL with I = 2 (52). In particular, we combined all curated proteins into a library, rice proteins-UniProt. The median length and the number of proteins in each family were calculated. Third, we used ParaAT1.0 to align the coding regions of genes (53) and various methods built in KaKs_Calculator2.0 (54) to compute nonsynonymous (Ka) and synonymous (Ks) substitution rates and selection strength (Ka/Ks). Ka and Ks analyses are widely demonstrated to be effective in making a distinction between fast- and slow-evolving protein-coding genes, or variable and conservative protein-coding genes (55).
User entry
We provide three approaches for users to access information in this database. First, five different types of BLAST families are used to compare DNA/protein full-length sequences or fragments with gene and protein fasta files (56). Second, BLAT is used to map DNA/protein (especially mRNA/EST) sequences onto genome assemblies, leading to fine mapping of gene structures (57). Last, the search text box supports interactive keyword searching, including Ensembl gene ID, RGKbase gene ID and keywords in title or abstract of the related literature involved in RGKbase.
Browser
We utilize three data browser systems to display the core data. First, we convert analyzed data into to gff3 files and guide them into a popular Gbrowse package (58). The tracks are divided into the default and the optional. Users can selectively display different tracks (Figure 1A). The visualization of different results derived from different methods helps users to identify high-confidence regions and to compare characteristics of different algorithms and software packages. We also divided all tracks into two major categories: nested and discontinuous features, which are denoted with a combination of basic shapes (rectangle, arrow and line). Other quantitative data are shown in barplot, curve and heatmap. In addition, Gbrowse-syn is used to compare the co-linear conserved regions between reference genome and other genomes identified by Lastz (48). We also added selected valuable tracks from Gbrowse to Gbrowse-syn and a new track to show similarity of compared segments (Figure 1B). Second, gene browse directs users to genes in a genome and their detailed structural and functional annotations, including two tables ‘Basic and structural information’ and ‘Function and domain annotation’, such as gene, protein, chromosome, start and end positions, exon and intron boundaries, GO terms, pathways, PDB ID and classification of transcription factors. This function allows users to look into genes of interest in the database based on variety of initial information (Figure 1C). Last, aside from the first two dynamic or interactive browsers, we also provided general static figures generated beforehand by using Circos (59). We mapped gene and repetitive elements onto chromosome and make them comparable in both interchromosomal and intrachromosomal modes. In addition, we drew ‘link map of homologous genic regions’ and added hotspot and hyperlink on the static figure and linked them to compared regions in Gbrowse-syn (Figure 1D). In details, we only selectively showed the anchors in the duplicated regions best identified both at the protein and nucleotide levels. In addition, ‘Syntenic block’ displays collinear blocks in the same chromosome or different chromosomes for the same species or different species.
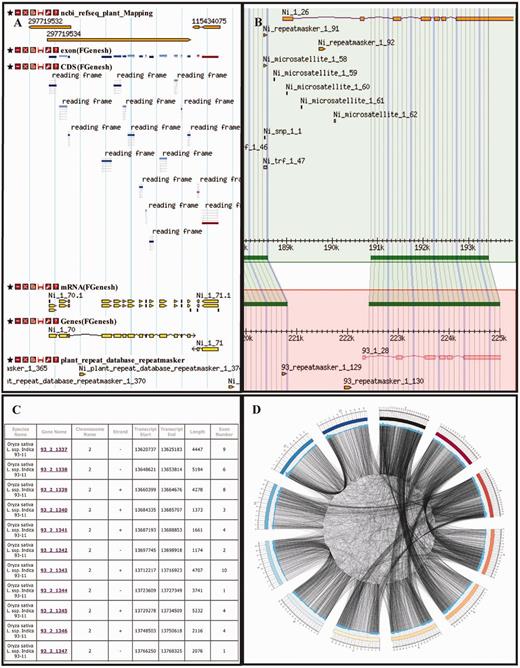
Snapshots of selected browser functions. (A) Gbrowse; an example displays RefSeq mapping, gene structure and repetitive elements annotations in a selected window. (B) Gbrowse-syn; a window displays syntenic regions and selected tracks between two genomes, Nipponbare and 93-11. (C) GeneBrowse; it lists details of gene and genome annotations (93-11 genome). (D) Circos; it displays a link map of homologous genic regions of rice chromosomes (93-11).
Tools
First, we built in a tool for compositional analysis on transcript-centric GC-gradient that is related to the mechanism of transcription-coupled DNA repair and is found in the rice genome and other grass family plants but appears absent in other families of monocotyledons and all dicotyledons, such as onion and Arabidopsis (60,61). This tool helps users calculate sequence content variations, including the gradient or alteration of mononucleotide, dinucleotide, GC content, codon usage and codon bias along transcripts. Second, for better sequence alignment, RGKbase provides multiple sequence alignment function for gene families, taking the advantage of two aligning algorithms: Clustalw (62) and Muscle (63). Users are able to select gene family of their interest and align all protein members of the family to check for change and gain/loss of amino acids. Third, GO annotation and pathway annotation are not only done in general for each gene but also done for multiple functional annotations so that each functional annotation involves multiple genes. GO (64) and KEGG pathways (30) have been widely used in the functional identification of genes and their interaction networks. For simple statistics, RGKbase provides Fisher’s exact test and multiple testing correction method with different thresholds for users to investigate the five rice genome assemblies. Fourth, we implemented ID convertor to use chromosome position information and to concatenate genes and their products from different annotation systems, such as Ensembl. In fact, the Ensembl genome annotation system adopts the two existing rice genome annotations from RGAP (9) and BGI-RIS (7) databases, where they maintain data from Nipponbare and 93-11, respectively. Therefore, users can easily look up genes of interest in between RGKbase and other related databases. Fifth, for visualization of syntenic genes and chromosomal segments, we previously constructed a genome co-linearity database that focuses on animal gene position and distance (65), and we now introduced its framework into RGKbase. This tool helps users to observe and understand the conservation and dynamics of homologous genes and gene clusters in different evolutionary lineages of rice genomes. Sixth, we also built gene co-expression networks by mapping selected gene expression datasets onto annotated genomes to build the expression matrix for multiple tissues or developmental stages, adopting Pearson coefficient parameters and calculating correlations between any of two genes (66,67). We used two types of criteria, rank and absolute value, to determine the edges of gene expression network. Users can enter the name of certain genes, and this tool generates a figure to show the network that contains these genes as key nodes. Seventh, we introduced two datasets of QTLs from Q-TARO (68) and Gramene database (69) and find their locations by medium of Nipponbare genome. Users can search their traits of interest and check sequence variations in the corresponding regions by means of hyperlink to Gbrowse.
Future work
We will keep updating the genome assemblies of the four rice varieties by filling gaps, correcting assembly errors and annotating genes based on both software upgrades and new data since only the Nipponbare genome has been considered a ‘finished map’ by the rice community until now. We will also carry out large-scale sequencing and re-sequencing projects to generate more data on different rice breeds or varieties. We will build a reference genome or ‘pangenome’ of rice, identify variety-specific variations and establish genotype–phenotype relations for agronomically important traits. The ultimate goals of constructing RGKbase include genome annotations, comparative genomics, evolutionary studies, trait mapping and identifications of genetic markers for marker-assisted breeding of rice and other grass crops.
DISCUSSION AND CONCLUSION
We built RGKbase for three fundamental scientific questions. First, what are the common features or conserved contents within the rice genome and distinct from other monocotyledons? Second, what are discriminative patterns among various rice subspecies? And how does rice evolve during domestication processes from the wild to the cultivated in multiple geographic regions? Last, how can we link genome variations/genetic markers to phenotypes/traits? We are sure that such information provides valuable clues for molecular biologists and agriculturists to exploit potentials of rice as a major crop to feed the world. We not only contribute original data for downloading but also visualization tools for multiple datasets suitable for comparative genome studies. We are working on a series of specific methodologies for plant research, especially rice genome annotations and population genetics analyses to address specific questions for rice biology, genetics and evolution. For example, we will build knowledge networks for the sequence-composition-to-function complexity. Ultimately, we will update the data and annotations hosted by RGKbase when any new data or novel analysis methods become available and keep this database up-to-date, becoming a curation and distribution center of the knowledge of rice genome and biology.
FUNDING
Funding for open access charge: National Basic Research Program [973 Program; 2011CB944100 and 2011CB944101]; National Programs for High Technology Research and Development [863 Program; 2012AA020409]; National Natural Science Foundation of China [90919024]; Special Foundation Work Program [2009FY120100].
Conflict of interest statement. None declared.
REFERENCES
Author notes
The authors wish it to be known that, in their opinion, the first two authors should be regarded as joint First Authors.

Comments