


ABSTRACT
There is a lack of blazar detections in the galactic plane area, even in the most recent blazar catalogues, mainly due to incompleteness resulting from interstellar dust and stellar contamination of our Galaxy. The VISTA Variables in the Vía Láctea survey (VVV) aims to map variable sources towards the galactic plane in the near-infrared (IR). There are three catalogued and one candidate blazars in the VVV area, which are also detected by Fermi-LAT in the gamma-ray band and by the Wide-field Infrared Survey Explorer (WISE) at mid-IR wavelengths. We study the physical properties of these blazars in order to use them as a reference that would allow us to find counterparts of other unidentified gamma-ray sources in the future. All four sources have VVV counterparts, and two of them, 5BZUJ1731−3003 and 5BZQJ1802−3940 are also associated with WISE sources. They present very different properties compared with stellar or extragalactic objects. Their VVV Ks light curves show significant variability, and are characterized using a machine learning analysis. In particular, the blazar 5BZQJ1802−3940, a flat spectrum radio quasar, exhibits the smallest uncertainties in the Fermi-LAT position and it is a bright WISE source. Its near-IR properties in the colour–magnitude and colour–colour diagrams are very different from the stars and extragalactic objects in the field. It has the highest amplitude in the Ks differential light curve and fractional variability amplitude. This pilot study will allow us to search for and identify other blazars hidden behind the Galactic plane using the VVV survey data base.
1 INTRODUCTION
The Fermi Large Area Telescope Third Source Catalogue (hereafter 3FGL; Acero et al. 2015) has a total of 3033 high-energy gamma-ray sources detected at a significance level above 4σ in the whole sky. These sources have, in general, large uncertainties in their positions and it is hard to find counterparts at other wavelengths. So far, a third of the sources remain unidentified. More than 1100 of the identified or associated sources are active galaxies such as blazars. The new release, the Fermi Large Area Telescope Fourth Source Catalogue (the Fermi-LAT collaboration 2019) has increased the detected sources to a total of 5048 high-energy gamma-ray sources with ∼3000 blazars.
Blazars are one of the most extreme class of radio-loud active galactic nuclei (AGNs) whose emission extends from radio to TeV energies with the presence of a relativistic jet aligned with the observer line of sight (Blandford & Rees 1978). Their spectral energy distribution is dominated by non-thermal emission, synchrotron at low frequencies, and inverse Compton emission at higher frequencies (Ghisellini, Maraschi & Treves 1985). The unified model (Antonucci 1993; Urry & Padovani 1995) explains most of the peculiar properties of blazars as rapid and large-amplitude flux variability. They are classified mainly as BL Lacertae objects that present very faint emission lines with the spectrum dominated by the continuum (Falomo, Pian & Treves 2014) or flat spectrum radio quasars (FSRQs) dominated by emission lines. Blazars account for about one third of the Fermi-LAT-detected objects (Acero et al. 2015) and for probably a significant fraction of the unidentified/unassociated gamma-ray sources (e.g. Massaro et al. 2012, 2013).
The 5th Edition of the Multifrequency Catalogue of Blazars (hereafter Roma-BZCAT; Massaro et al. 2015) is the main catalogue to identify blazars as counterparts of high-energy sources, and it is useful for investigating the populations of extragalactic sources at other frequency bands such as in the far- and mid-infrared (IR). The Roma-BZCAT includes positions and multifrequency data of 3561 sources, either confirmed blazars or exhibiting characteristics close to this type of sources.
The analysis of the gamma-ray source association involves statistical methods such as the Bayesian Association Method (Mattox et al. 1997); the Likelihood Ratio method (Ackermann et al. 2011; Nolan et al. 2012); and the logN–logS association method (Ackermann et al. 2011). These techniques, together with new procedures, were also improved and used to build all the Fermi-LAT catalogues available to date. Ackermann et al. (2012) using these methods showed that more blazars should be found within the unidentified sources, especially at low galactic latitudes. This lack of blazars in the galactic plane can also be seen in the Roma-BZCAT. Thus, the key to finding plausible counterparts to the unidentified Fermi-LAT sources is cross-checking with observations in other wavelengths, such as X-rays, optical, radio, IR, etc (e.g. Masetti et al. 2013; Paggi et al. 2013; Pichel & Rovero 2013; Mandarakas et al. 2019).
The VISTA Variables in the Vía Láctea (VVV) is a deep near-IR ZYJHKs photometric survey of the Galactic bulge and southern plane (Hambly et al. 2004; Minniti et al. 2010; Cross et al. 2012). The main goal is to search for variable objects in the Galaxy, such as RR-Lyrae, variable stars belonging to known star clusters, eclipsing binaries, and rare variable sources. The VISTA survey of the Magellanic Clouds system (VMC; Cioni et al. 2011) is a near-IR YJKs survey to determine the spatially resolved star formation history and the three-dimensional structure of the Magellanic system. Both surveys use the same camera and the results can be comparable. They identified quasar candidates using colours that are different from Galactic stars and those of the Magellanic Clouds. The quasars populate a specific region in the colour–colour diagrams (CCDs) defined by (J − Ks) = −1.25 × (Y − J) + 1.05, (J − Ks) = 2.05 × (Y − J) − 0.15, and (J − Ks) = −1.25 × (Y − J) + 1.90.
The Wide-field Infrared Survey Explorer (WISE; Wright et al. 2010) has mapped the sky in the mid-IR at 3.4, 4.6, 12, and 22 µm, enabling the investigation of the properties of a large, statistically significant sample of confirmed blazars. Using WISE magnitudes, Massaro et al. (2011) discovered that Fermi-LAT blazars inhabit a region of the mid-IR CCDs, which is well-separated from the location of other extragalactic sources. Blazars populate different regions in the diagrams because they are dominated by non-thermal emission in the mid-IR. This two-dimensional region in the mid-IR CCD [3.4]–[4.6]–[12]–[22] µm was originally indicated as the WISE Gamma-ray Strip (WGS; D’Abrusco et al. 2012), and the method was improved in the WISE locus of gamma-ray blazars in D’Abrusco et al. (2013,2014) and tested with the 3FGL catalogue and the latest WISE catalogue in Massaro et al. (2016).
Our main goal is to identify unidentified 3FGL sources with near-IR and mid-IR counterparts using the VVV survey and WISE, respectively and determine the possible criteria for the identification of blazars using only VVV observations. Pichel et al. (2016) showed the first results of the blazar association between a gamma-ray source and the near-IR source in a crowded region of the Galactic plane. Recently, Saito et al. (2019) reported a near-IR variable source (VVV-WIT-04) towards the Galactic disc about 0.2 arcsec from a radio source. The paper is organized as follows. In Section 2, we discuss the data and applied methodology. In Section 3, we describe the near- and mid-IR properties of the blazars. In Section 4, we show the VVV Ks light curves of the blazars and variability analysis. Finally, in Section 5, we present a summary of the data analysis and main results.
2 DATA AND METHODOLOGY
2.1 High-energy gamma-ray sources
Gamma-ray sources have been associated with counterparts at different wavelengths such as X-ray, optical, near-IR, and radio (Massaro et al. 2015). In particular, blazars in the Roma-BZCAT were previously associated with 3FGL sources (Maselli et al. 2015). Massaro et al. (2011) studied the blazars at galactic latitudes higher than 10° to reduce the contamination from Galactic diffuse emission and sources.
At lower galactic latitudes, we have found 156 3FGL Fermi-LAT sources in the VVV region: 107 sources with previous associations at different wavelengths and 49 sources without any counterparts. Four of these sources with associations correspond to Roma-BZCAT blazars in the Galactic bulge of the VVV survey. Table 1 shows the positions of the 3FGL sources and the associated blazars in the Roma-BZCAT, listed in columns (1)–(4), the 3FGL identification; the J2000 coordinates; and the semimajor axis of Fermi-LAT error ellipse at 95 per cent confidence level in arcminutes taken from 3FGL, and in columns (5)–(7), the Roma-BZCAT identification and J2000 coordinates taken from Roma-BZCAT, respectively. Table 2 shows the main properties of these four blazars from the Roma-BZCAT, columns (1) and (2) show the Roma-BZCAT and NVSS (Condon et al. 1998) identifications, respectively; column (3), the spectrum subclass; columns (4) and (5), the flux densities at 1.4/0.843 GHz and at 143 GHz, respectively; and column (6), the X-ray flux at 0.1–2.4 keV. These associations are all well inside the corresponding 3FGL 95 per cent error ellipse. The NVSS sources are the only ones in the 10 × 10 arcmin2 region centred in the Roma-BZCAT objects with distances of about 45 arcsec at most.
3FGL sources and the associated Roma-BZCAT blazars.
| 3FGL ID | RA | Dec. | Semimajor error ellipse | Roma-BZCAT ID | RA | Dec. |
|---|---|---|---|---|---|---|
| (J2000) | (J2000) | (arcmin) | (J2000) | (J2000) | ||
| 3FGL J1717.8−3342 | 17:17:48.22 | −33:42:01.08 | 2.322 | 5BZBJ1717−3342 | 17:17:36.02 | −33:42:08.78 |
| 3FGL J1731.8−3001 | 17:31:51.26 | −30:01:17.04 | 2.268 | 5BZUJ1731−3003 | 17:31:46.86 | −30:03:08.89 |
| 3FGL J1802.6−3940 | 18:02:41.57 | −39:40:26.76 | 1.056 | 5BZQJ1802−3940 | 18:02:42.67 | −39:40:07.89 |
| 3FGL J1823.6−3453 | 18:23:38.04 | −34:53:41.64 | 1.506 | 5BZUJ1823−3454 | 18:23:38.58 | −34:54:11.98 |
Roma-BZCAT blazars and their properties.
| Roma-BZCAT ID | NVSS ID | Type | FR | F143 | FX |
|---|---|---|---|---|---|
| (GHz) | (GHz) | (keV) | |||
| 5BZBJ1717−3342 | NVSS J171736−334208 | BL Lac | 624.0 | 1907.0 | – |
| 5BZUJ1731−3003 | NVSS J173146−300309 | Uncertain | 91.0 | – | – |
| 5BZQJ1802−3940 | NVSS J180242−394005 | FSRQ | 2273.0 | 1470 | 0.59 |
| 5BZUJ1823−3454 | NVSS J182336−345412 | Uncertain | 132.0 | – | 0.12 |
For these blazars, we analyse multiwavelength archival data, aiming to determine their physical nature. The methodology consists of examining the regions within a circle of twice the semimajor axis of the LAT uncertainty ellipse at 95 per cent confidence level, centred at the position of the 3FGL sources, using the VVV and WISE data in the near- and mid-IR, respectively. Thus, we generate the criteria to select near-IR counterpart candidates to be associated with other 3FGL sources lacking information in previous surveys.
2.2 The VVV IR association
To study the near-IR objects around the 3FGL sources, we have defined a search region of twice the semimajor axis of the error ellipse at 95 per cent confidence level centred at the 3FGL source position. Table 3 shows some characteristics of the VVV regions where the blazars are located: column (1) gives the Roma-BZCAT identifications; column (2), the VVV Tile ID; column (3), the Ks extinction; and column (4), the box size we have used to obtain the photometry. With the VVV images, we have performed the photometry using the combination of SE xtractor + psf (Bertin 2011) in the five VVV passbands: Z, Y, J, H, and Ks of all the sources in the region, as extensively described in Baravalle et al. (2018). These authors defined some morphological parameters to characterize the sources as the half-light radius (R1/2, the radius that encloses 50 per cent of the object total flux); the ellipticity (ϵ); the concentration index (C, the ratio of two circular radii that contain 80 per cent and 20 per cent of the total Petrosian flux, Conselice, Bershady & Jangren 2000); the |${\tt CLASS\_STAR}$| parameter (a stellarity index associated with the light distribution of the source); another star–galaxy classifier (the |${\tt SPREAD\_MODEL}$|, Φ parameter) and the spheroid Sersic index (n, Sersic 1968). The extended sources have |${\tt CLASS\_STAR}$| < 0.3; 1.0 < R1/2 < 5.0 arcsec; 2.1 < C < 5; Φ > 0.002. The extragalactic sources also satisfy the colours: 0.5 mag < (J − Ks) < 2.0 mag; 0.0 mag < (J − H) < 1.0 mag; 0.0 mag < (H − Ks) < 2.0 mag; and (J − H) + 0.9 (H − Ks) > 0.44 mag. The stellar objects should satisfy |${\tt CLASS\_STAR}$| > 0.9 and Φ < 0.003.
Roma-BZCAT blazars and the corresponding VVV tiles.
| Roma-BZCAT ID | Tile ID | A|$_{K_s}$| | Box size |
|---|---|---|---|
| (mag) | (arcmin × arcmin) | ||
| 5BZBJ1717−3342 | b356 | 0.756 | 4.6 × 4.6 |
| 5BZUJ1731−3003 | b360 | 0.929 | 4.6 × 4.6 |
| 5BZQJ1802−3940 | b216 | 0.044 | 2.1 × 2.1 |
| 5BZUJ1823−3454 | b206 | 0.040 | 3.1 × 3.1 |
| Roma-BZCAT ID | Tile ID | A|$_{K_s}$| | Box size |
|---|---|---|---|
| (mag) | (arcmin × arcmin) | ||
| 5BZBJ1717−3342 | b356 | 0.756 | 4.6 × 4.6 |
| 5BZUJ1731−3003 | b360 | 0.929 | 4.6 × 4.6 |
| 5BZQJ1802−3940 | b216 | 0.044 | 2.1 × 2.1 |
| 5BZUJ1823−3454 | b206 | 0.040 | 3.1 × 3.1 |
In this study, we have associated the Roma-BZCAT blazars with the closest near-IR source that might be stellar or extragalactic objects. All the detections were performed in the Ks passband and they were matched with the other four IR passbands using an angular separation of 0.1 arcsec, which is only a fraction of a pixel and is a typical separation for matching sources. In the case of 5BZUJ1823−3454, the angular separation was higher, 0.3 arcsec, closer to 1 pixel, which is also a marginal acceptable match. The Roma-BZCAT and VVV positions are the same in the four cases.
Fig. 1 shows the 1 arcmin × 1 arcmin images of the four studied blazars centred at these sources in the Z, Y, J, H, and Ks passbands. From visual inspection, it is evident that the first two blazars (5BZBJ1717−3342 and 5BZUJ1731−3003) are fainter in both Z and Y than J, H, and Ks passbands. This is the typical behaviour of extragalactic sources in the near-IR as described in Baravalle et al. (2018). In the other two blazars (5BZQJ1802−3940 and 5BZUJ1823−3454), the brightness is approximately constant in the five passbands, which is a typical characteristic of stellar objects.
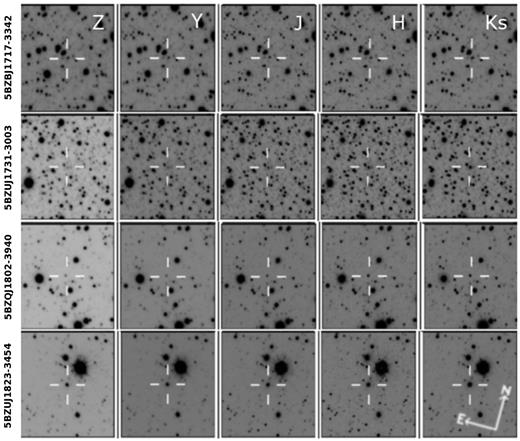
1 arcmin × 1 arcmin VVV images of the four studied blazars in the Z, Y, J, H, and Ks passbands. The orientation is shown in the bottom right panel.
Total magnitudes are psf magnitudes and colours are obtained with aperture magnitudes within 2 arcsec aperture radius. The magnitudes and colours of all the sources were corrected by extinction along the line of sight using the maps of Schlafly & Finkbeiner (2011) and the relative extinctions of Cardelli, Clayton & Mathis (1989) for the VVV near-IR passbands.
Table 4 shows the morphological properties of the four studied blazars. Column (1) gives the Roma-BZCAT identifications; column (2), |${\tt CLASS\_STAR}$|; column (3), Φ; column (4), the ellipticities; column (5), R1/2; column (6), C; column (7), n; and column (8), the near-IR morphologies.
The blazars: near-IR morphological properties obtained with VVV data.
| Roma-BZCAT ID | |${\tt CLASS\_STAR}$| | Φ | ϵ | R1/2 | C | n | Near-IR morphology |
|---|---|---|---|---|---|---|---|
| (arcsec) | |||||||
| 5BZBJ1717−3342 | 0.882 | 0.0014 | 0.189 | 1.285 | 3.729 | 7.036 | Extended |
| 5BZUJ1731−3003 | 0.030 | 0.0036 | 0.389 | 1.039 | 3.539 | 8.401 | Extended |
| 5BZQJ1802−3940 | 0.969 | 0.0003 | 0.012 | 0.483 | 2.303 | 9.168 | Stellar |
| 5BZUJ1823−3454 | 0.991 | 0.0021 | 0.100 | 0.886 | 4.640 | 8.917 | Stellar |
Table 5 shows the near-IR photometric properties of the four blazars. Column (1) gives the Roma-BZCAT identifications; column (2), the VVV identifications; and columns (3)–(7), the Z, Y, J, H, and Ks magnitudes. For each object, the first line corresponds to psf magnitudes and the second line to the aperture magnitudes within 2 arcsec.
The blazars: near-IR total and aperture magnitudes obtained with VVV data.
| Roma-BZCAT ID | VVV ID | Z | Y | J | H | Ks |
|---|---|---|---|---|---|---|
| Z2 arcsec | Y2 arcsec | J2 arcsec | H2 arcsec | Ks 2 arcsec | ||
| 5BZBJ1717−3342 | VVV-J171736.02−334208.78 | – | – | 18.18 ± 0.06 | 16.82 ± 0.05 | 15.74 ± 0.03 |
| – | – | 16.26 ± 0.07 | 15.70 ± 0.06 | 15.03 ± 0.04 | ||
| 5BZUJ1731−3003 | VVV-J173146.86−300308.89 | 13.68 ± 0.05 | 13.71 ± 0.04 | 13.66 ± 0.03 | 13.42 ± 0.02 | 12.68 ± 0.01 |
| 13.63 ± 0.06 | 13.65 ± 0.05 | 13.45 ± 0.03 | 13.05 ± 0.02 | 12.62 ± 0.01 | ||
| 5BZQJ1802−3940 | VVV-J180242.67−394007.89 | 18.01 ± 0.02 | 17.80 ± 0.03 | 17.16 ± 0.03 | 16.22 ± 0.02 | 15.06 ± 0.01 |
| 17.81 ± 0.03 | 17.58 ± 0.03 | 17.01 ± 0.02 | 16.13 ± 0.02 | 14.84 ± 0.01 | ||
| 5BZUJ1823−3454 | VVV-J182338.58−345411.98 | 15.54 ± 0.01 | 15.28 ± 0.01 | 14.72 ± 0.01 | 14.03 ± 0.01 | 13.18 ± 0.01 |
| 15.46 ± 0.01 | 15.23 ± 0.01 | 14.75 ± 0.01 | 14.15 ± 0.01 | 13.15 ± 0.01 |
Fig. 2 shows the 0.5 arcmin × 0.5 arcmin stacked Ks images centred at the blazars. The blazars, 5BZBJ1717−3342 and 5BZUJ1823−3454, have a nearby star with strong contamination. The images of the first two blazars, 5BZBJ1717−3342 and 5BZUJ1731−3003, correspond to extragalactic sources with fainter regions at the outer parts that might be associated with the host galaxy. The other two blazars are star-like objects in the near-IR.
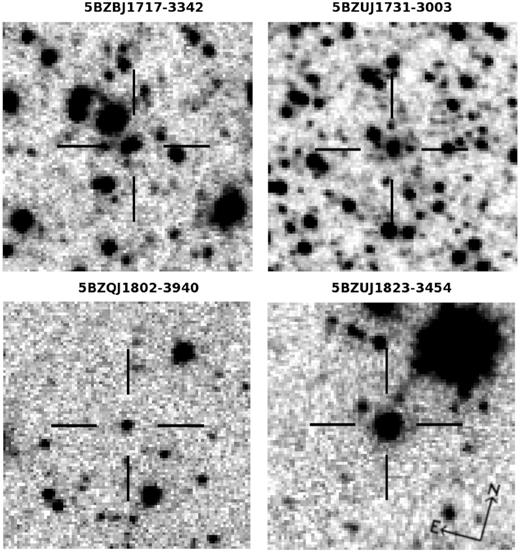
Stacked 0.5 arcmin × 0.5 arcmin Ks images of the four blazars. The orientation is shown in the bottom right panel.
For the studied blazars, colour–magnitude diagrams (CMDs) and CCDs with the near-IR data will be presented in next section.
2.3 The WISE blazar association
The WISE mission observed the sky in four passbands: 3.4, 4.6, 12, and 22 µm, with an angular resolution of 6.1, 6.4, 6.5, and 12.0 arcsec achieving 5σ point source sensitivities of 0.08, 0.11, 1, and 6 mJy, respectively, in unconfused regions on the ecliptic (Wright et al. 2010). All the WISE magnitudes are in the Vega system.
For the four Roma-BZCAT blazars associated with the 3FGL sources, we searched for all the IR sources in a region twice the size of the uncertainties of the 3FGL blazar positions. For the analysis, unless stated otherwise, we considered only WISE sources detected with a minimum signal-to-noise ratio of 7 in at least one passband. Using the WGS and the WISE locus method described previously, we applied the criterion that blazars lie in a distinctive region in the three-dimensional mid-IR CCDs using observations at 3.4, 4.6, 12, and 22 µm.
The blazar candidates were selected using two-dimensional projections in the CCDs, and as a result different options are possible depending on the number of candidates found. For the particular case of these known blazars, only one candidate is expected to be found. In any case, we cross-check all the candidates found with those obtained with the VVV method (see Section 2.2).
Table 6 shows the Roma-BZCAT and WISE identifications in columns (1) and (2), respectively; WISE magnitudes at 3.4, 4.6, 12, and 22 µm from columns (3) to (6).
The blazars: mid-IR photometric properties with WISE data.
| Roma-BZCAT ID | WISE ID | [3.4] | [4.6] | [12] | [22] |
|---|---|---|---|---|---|
| (mag) | (mag) | (mag) | (mag) | ||
| 5BZBJ1717−3342 | – | – | – | – | – |
| 5BZUJ1731−3003 | J173143.52-300216.7 | 13.34 ± 0.07 | 11.96 ± 0.03 | 8.44 ± 0.03 | 5.96 ± 0.05 |
| 5BZQJ1802−3940 | J180242.66-394007.9 | 8.24 ± 0.04 | 7.50 ± 0.02 | 4.94 ± 0.01 | 3.22 ± 0.02 |
| 5BZUJ1823−3454 | – | – | – | – | – |
For the blazars, CCDs: (3.4–4.6) versus (4.6–12); (3.4–4.6) versus (12–22); and (4.6–12) versus (12–22) with the WISE data will be presented in next section.
3 THE BLAZARS
We analysed the photometric properties of the objects that are around the four 3FGL sources, discussing their main characteristics and properties in detail.
In the near-IR, the stellar objects found in the four fields have similar photometric and structural properties. Together, with 1300 stars, the mean values of the morphological parameters are: Φ= −0.001 ± 0.002; ϵ = 0.139 ± 0.105; R1/2 = 0.514 ± 0.083 arcsec; n = 8.304 ± 2.89; CLASS_STAR = 0.96 ± 0.03; and C = 2.52 ± 0.37. The mean colours of the stellar objects are: (H − Ks) = 0.053 ± 0.129; (J − H) = 0.375 ± 0.189; (J − Ks) = 0.428 ± 0.284; and (Y − J) = 0.314 ± 0.236 mag.
Cioni et al. (2013) identified quasar candidates in (Y − J) versus (J − Ks) CCDs from the VMC data using the VISTA camera. They defined two regions for quasars depending on their morphologies: star- and galaxy-like objects. For instance, in the (J − Ks) versus (Y − J) and (J − H) versus (H − Ks) CCDs they have different photometric properties that allow us to identify AGNs in general from extragalactic sources and Galactic stars (Cioni et al. 2013; Massaro & D’Abrusco 2016). Massaro et al. (2016) also showed that the Fermi-LAT blazars are located in specific regions both in mid- and near-IR CCDs, clearly separated from other extragalactic sources. Based on these previous results, we studied the photometric properties of the four blazars, comparing them with the stellar and extragalactic objects.
3.1 5BZBJ1717−3342
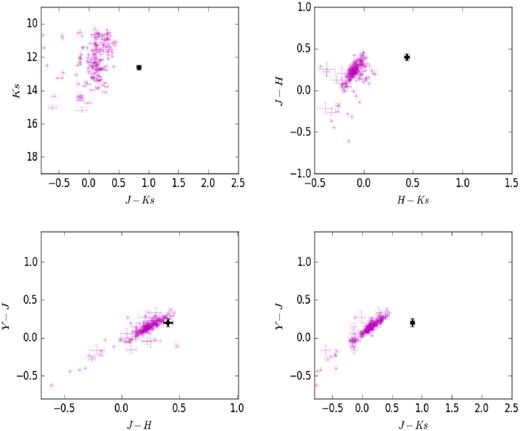
The blazar is a BL Lac object candidate identified in the Roma-BZCAT catalogue as an AGN with a featureless optical spectrum, or having absorption lines and either weak or narrow emission lines of galaxy origin. We found the blazar 5BZBJ1717.8−3342 at 2.541 arcmin of the 3FGL source centroid. The VVV source is the faintest object of the present sample, with a nearby bright star that was masked using the procedure of Baravalle et al. (2018). These results should be taken with caution due to the higher uncertainties. The VVV source is an extragalactic object without detection in Z and Y passbands at variance with the other objects of our sample. The morphological and photometric near-IR properties are shown in Tables 4 and 5.
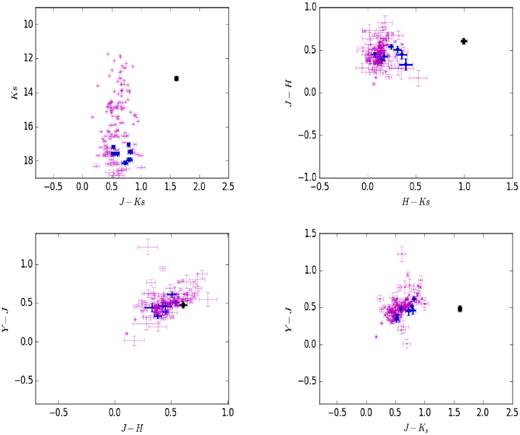
Fig. 3 shows the (J − Ks) versus Ks CMD and the (J − H) versus (H − Ks) CCD of the search region of the 3FGL source using near-IR data from the VVV survey. Stellar objects are represented by small and violet points, extragalactic sources with blue triangles, and the blazar with a bigger circle in black. We found a total of 949 sources in the J, H, and Ks passbands, of which 28 are extragalactic objects with mean values of Φ = 0.006 ± 0.004; ϵ = 0.33 ± 0.11; R1/2 = 1.32 ± 0.33 arcsec; n = 5.87 ± 2.10; CLASS_STAR = 0.05 ± 0.07; and C = 3.17 ± 0.41. Mean colours are (J − H) = 0.465 ± 0.108, (H − Ks) = 0.134 ± 0.077, and (J − Ks) = 0.596 ± 0.077 mag suggesting that they are extragalactic candidates. The blazar has different colours in comparison with both stellar and extragalactic objects: (J − H) = 0.562 ± 0.094, (H − Ks) = 0.664 ± 0.074, and (J − Ks) = 1.226 ± 0.078 mag.
5BZBJ1717−3342. (J − Ks) versus Ks CMD and (H − Ks) versus (J − H) CCD using near-IR data from the VVV survey. Small and violet points represent stellar objects; blue triangles, the extragalactic sources; and the bigger black circle, the blazar.
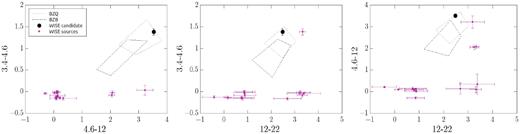
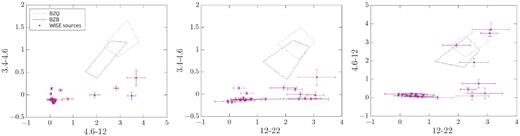
Fig. 4 shows the WISE CCDs: (3.4–4.6) versus (4.6–12); (3.4–4.6) versus (12–22); and (4.6–12) versus (12–22) for all the 152 WISE sources, which were detected in the twice-error region of the Fermi-LAT gamma-ray source. Using the WGS criteria mentioned above, we found 152 WISE sources but none of them matches the criteria to be classified as a blazar candidate. In the position of the Roma-BZCAT blazar and the VVV source there is a WISE source (WISE J171736.24−334207.5) with these colours: (3.4–4.6) = 0.238 ± 0.036, (4.6–12) = 2.080 ± 0.055, and (12–22) = 2.639 ± 0.068 mag, but these do not comply with the WGS colour–colour criteria in all the diagrams, to be associated with a blazar.
5BZBJ1717−3342. (3.4–4.6) versus (4.6–12), (3.4–4.6) versus (12–22), and (4.6–12) versus (12–22) CCDs using mid-IR data from WISE. The two blazar classes of BZBs (BL Lac) and BZQs (FSRQ) are shown in dash and dot black lines.
3.2 5BZUJ1731−3003
This is a blazar object with unclear type, exhibiting blazar properties mixed with other features which make classification difficult. We found the blazar 5BZUJ1731−3003 at 2.093 arcmin of the 3FGL source centroid. The VVV source is an extragalactic object with detections in the five passbands of the survey (Tables 4 and 5). Fig. 5 shows the (J − Ks) versus Ks CMD and (J − H) versus (H − Ks), (J − H) versus (Y − J), and (J − Ks) versus (Y − J) CCDs of the search region of the 3FGL source using near-IR data from the VVV survey. The objects are represented with the same symbols as Fig. 3. Using the Baravalle et al. (2018) criteria, we found a total of 183 sources with only one extragalactic object in the field, which is the studied blazar. The colours are (J − H) = 0.40 ± 0.04, (H − Ks) = 0.43 ± 0.03, (J − Ks) = 0.83 ± 0.04, (Y − J) = 0.20 ± 0.06, and (Z − Y) = −0.03 ± 0.07 mag, which are very different from those of stellar objects. By visual inspection, this blazar is an extragalactic source.
5BZUJ1731−3003. (J − Ks) versus Ks CMD, (H − Ks) versus (J − H), (J − H) versus (Y − J), and (J − Ks) versus (Y − J) CCDs using near-IR data from the VVV survey. The symbols are represented as in Fig. 3.
Using the WISE criteria, we found 109 WISE sources detected in the error region of the gamma-ray source. Fig. 6 shows the WISE CCDs for these WISE sources, similar to Fig. 4. It can be noticed that only one WISE object was found as the counterpart of the blazar (WISE J173143.52−300216.7), coinciding with the position of the Roma-BZCAT and the VVV survey. The distance between the 3FGL centroid and WISE sources is 1.948 arcmin. We suggest that this blazar could be a BL Lac due to its position in the mid-IR CCD.
5BZUJ1731−3003. (3.4–4.6) versus (4.6–12), (3.4–4.6) versus (12–22), and (4.6–12) versus (12–22) CCDs using mid-IR data from WISE. The two blazar classes of BZBs (BL Lac) and BZQs (FSRQ) are shown in dash and dot black lines. The WISE blazar candidate is shown with a black circle symbol.
3.3 5BZQJ1802−3940
The object is an FSRQ object identified in the Roma-BZCAT catalogue as an FSRQ with an optical spectrum showing broad emission lines and dominant blazar characteristics. The object has a redshift of 0.296 (Liang & Liu, 2003). The blazar 5BZQJ1802−3940 has been identified with the centroid of the 3FGL source at a distance of 0.379 arcmin. The near-IR source is a stellar object and its corresponding photometric and morphological parameters are shown in Tables 4 and 5.
Fig. 7 shows the (J − Ks) versus Ks CMD and (J − H) versus (H − Ks), (J − H) versus (Y − J), and (J − Ks) versus (Y − J) CCDs in the search region of the 3FGL source using near-IR data. The different points are represented with the same symbols as Fig. 3. We found a total of 57 sources in the J, H, and Ks passbands with only one extragalactic object with Φ = 0.064; ϵ = 0.17; R1/2 = 1.2821 arcsec; n = 4.0; CLASS_STAR = 0.02; and C = 3.08. The colours are (J − H) = 0.194 ± 0.074, (H − Ks) = 0.387 ± 0.079, (J − Ks) = 0.581 ± 0.061, (Y − J) = 0.339 ± 0.056, and (Z − Y) = 0.158 ± 0.053 mag. The blazar has a stellar morphology (Table 5) and the colours are (J − H) = 0.88 ± 0.03, (H − Ks) = 1.30 ± 0.02, (J − Ks) = 2.17 ± 0.03, (Y − J) = 0.58 ± 0.04, and (Z − Y) = 0.23 ± 0.04 mag, which are very different from those of stellar objects and the extragalactic source.
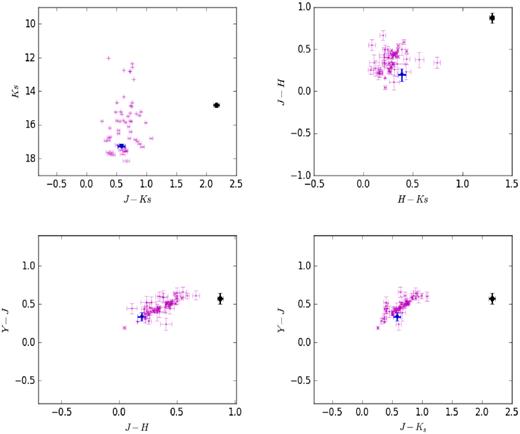
5BZQJ1802−3940. (J − Ks) versus Ks CMD, (H − Ks) versus (J − H), (J − H) versus (Y − J), and (J − Ks) versus (Y − J) CCDs using near-IR data from the VVV survey. The symbols are represented as in Fig. 3.
Fig. 8 shows the CCDs in the mid-IR for the 14 WISE sources detected in the error region of the gamma-ray source. Only one WISE source was found as the counterpart of the FSRQ (WISE J180242.66−394007.9) matching the position found using the near-IR with the VVV survey and the Roma-BZCAT, located at 0.378 arcmin of the 3FGL source centroid of 3FGL J1802.6−3940. In this case, the WISE source is located in the BZQ region, as expected.
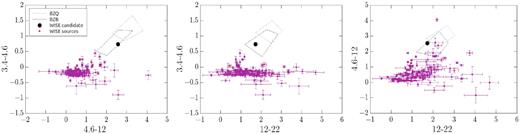
5BZQJ1802−3940. (3.4–4.6) versus (4.6–12), (3.4–4.6) versus (12–22), and (4.6–12) versus (12–22) CCDs using mid-IR data from WISE. The two blazar classes of BZBs (BL Lac) and BZQs (FSRQ) are shown in dash and dot black lines. The WISE blazar candidate is shown with a black circle symbol.
3.4 5BZUJ1823−3454
The object has an uncertain type. There are two bright stars nearby that might contaminate the photometric properties. Blazar 5BZUJ1823−3454 is found at 0.518 arcmin of the 3FGL source centroid of 3FGLJ1823.6−3453.
Fig. 9 shows the (J − Ks) versus Ks CMD and (J − H) versus (H − Ks), (J − H) versus (Y − J), and (J − Ks) versus (Y − J) CCDs in the search region of the 3FGL source using near-IR data. The objects are represented with the same symbols as in Fig. 3. We found a total of 148 sources of which seven extragalactic objects have the mean morphological parameters: Φ = 0.006 ± 0.004; ϵ = 0.40 ± 0.22; R1/2 = 1.49 ± 0.75 arcsec; n = 5.97 ± 2.03; CLASS_STAR = 0.02 ± 0.01; and C = 3.62 ± 0.28. The mean colours are (J − H) = 0.440 ± 0.066; (H − Ks) = 0.239 ± 0.109 and (J − Ks) = 0.68 ± 0.121 mag; (Y − J) = 0.461 ± 0.082 and (Z − Y) = 0.159 ± 0.068 mag. The blazar has the morphology of a stellar object (Table 4). The colours are (J − H) = 0.60 ± 0.01, (H − Ks) = 1.00 ± 0.01, (J − Ks) = 1.60 ± 0.01, (Y − J) = 0.48 ± 0.01, and (Z − Y) = 0.23 ± 0.01 mag, which are different from those of both stellar and extragalactic objects.
5BZUJ1823−3454. (J − Ks) versus Ks CMD, (H − Ks) versus (J − H), (J − H) versus (Y − J)and (J − Ks) versus (Y − J) CCDs using near-IR data from the VVV survey. The symbols are represented as in Fig. 3.
We found only 11 WISE sources detected in the four passbands in the defined region of the blazar 5BZUJ1823−3454. Fig. 10 shows the WISE CCDs, similar to those of Fig. 4. We note that none of these sources follow the WGS criteria. These WISE results of the blazar 5BZUJ1823−3454 may have strong contamination due to the bright star in the field.
5BZUJ1823−3454. (3.4–4.6) versus (4.6–12), (3.4–4.6) versus (12–22), and (4.6–12) versus (12–22) CCDs using mid-IR data from WISE. The two blazars classes of BZBs (BL Lac) and BZQs (FSRQ) are shown in dash and dot black lines.
As a summary of the main results of this section, we found a VVV source associated with each blazar. The blazars are also located in specific regions of the near-IR CMDs and CCDs. We showed that the positions of these sources in the (J − Ks) versus (H − Ks) CCDs are very different from those of the stellar and extragalactic sources in the studied regions. The following colour cuts might be used to identify blazar candidates in the near-IR data: (J − Ks) > 1.0 mag and (H − Ks) > 0.5 mag. Saito et al. (2019) reported a (J − Ks) variation of 1.58–2.52 for the source VVV-WIT-04. The colour (J − H) is different only in the case of the FSRQ blazar 5BZQJ1802−3940. This result should be better investigated in the near future with other gamma-ray sources. For two of the blazars (5BZUJ1731−3003 and 5BZQJ1802−3940), we were also able to identify them with a WISE source associated with these blazars matching the position of the VVV and Roma-BZCAT catalogue, and applying the WGS method indicates that 5BZUJ1731−3003 could be a BL Lac type.
The blazar candidate, 5BZBJ1717−3342, has a nearby star that complicates the analysis. Using the VVV data we found that this source is a very faint object with no detection in Z and Y bands, but with the rest of the bands (J, H, and Ks) we were able to identify a VVV blazar candidate. Using the WISE data, we were not able to find any WISE source candidate to be a blazar, due to the contamination from the star. This result is also confirmed by D’Abrusco et al. (2014, 2019) with the WISE blazar candidate catalogues. Also, there is no mention of the source in the Gaia-WISE AGN catalogue (Shu et al. 2019). Clearly more information is needed in order to determine its extragalactic origin and to definitely confirm this source as a genuine blazar, like new spectroscopic observations in the IR or X-ray observations.
4 THE VVV LIGHT CURVES OF THE BLAZARS
We used the aperture photometry available from the Cambridge Astronomical Survey Unit catalogues (CASU (Irwin et al. 2004); Emerson, McPherson & Sutherland 2006; Lewis et al. 2006) for the blazars with an aperture radius of 3 pixels (∼1 arcsec) for each individual epoch (Minniti et al. 2010; Saito et al. 2011; Hempel et al. 2014). Under seeing conditions of 0.8 arcsec, this aperture radius contains roughly 75 per cent of the flux for stellar objects. The absolute flux calibration of the VISTA images displayed small variations of about 0.1 mag across different epochs, mainly due to the calibration to the 2MASS system using stars in high crowding regions with different resolutions and different seeing conditions. For this reason, we decided to obtain a set of reference stars to have relative photometry, therefore eliminating all possible sources of errors in the light curves due to atmospheric, instrument, or calibration differences with 2MASS photometry. We selected five, non-saturated stars near the blazars. All the aperture magnitudes were uncorrected for galactic extinction. For the individual light curves of the reference stars, we subtracted the median magnitude and we median combined all the light curves, creating a ‘master’ light curve. We obtained the Ks differential light curves of the blazars, subtracting both the median values of the blazar magnitude and the ‘master’ light curve. The residuals were median combined and added in quadrature.
Fig. 11 shows the Ks differential light curves of the four blazars including residuals. For magnitudes, the scales are the same for three of the blazars and double for 5BZQJ1802−3940, clearly the most prominent curve. The blazar 5BZUJ1731−3003 is located in a crowded region with high extinction and also presents the largest uncertainties in the light curve.
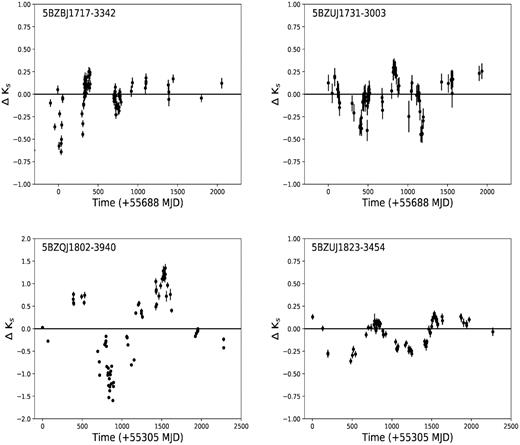
Ks differential light curves of the studied blazars.
4.1 Variability analysis
We applied different methods to analyse the variability of the blazars using the Ks light curves, some statistics, and machine learning (ML) techniques.
Cioni et al. (2013) analysed the linear fit of the light curve variation in the Ks passband to identify quasar candidates. They found that about 75 per cent of the quasars in their sample had slopes greater than the variability limit of 10−4 mag d−1. Sandrinelli, Covino & Treves (2014) characterized the intrinsic variability amplitude of seven blazars defining the fractional variability amplitude as |$\sigma ^2_{\mathrm{ rms}} = \frac{1}{N \mu ^2} \sum [(F_i - \mu)^2 - \epsilon ^2_i]$|, where N is the number of flux values Fi with uncertainties ϵi, and μ is the average flux. This relationship reflects an excess of variability that cannot be explained by the flux errors. We applied a linear fit to the 5σ clipped blazar Ks light curves, obtaining robust estimations of the mean magnitudes, slope of the variation, and fractional variability amplitude.
We also performed a variability analysis using the feets software (Cabral et al. 2018), which calculates several features that are useful for ML techniques. These methodologies need larger samples than the one presented in this work so, instead, an individual analysis of the feature values was performed. In order to obtain a comparison sample, we constructed the light curves of all the VVV sources located in a circle of twice the uncertainties in the 3FGL positions. Using feets, we extracted the light curve features for both the blazars and the comparison sample, and contrasted the distributions for each different feature. As an example, Fig. 12 shows the distribution of the variability Amplitude, a simple feature obtained from the ML analysis. This is calculated following the Richards et al. (2011) robust amplitude determination method1 and it is equal to half the distance between the median of the 5 per cent brightest and 5 per cent faintest points of the light curve. Other interesting features are the Lomb–Scargle periodogram (VanderPlas 2018) and the period false-alarm probability (PFAP). The former is the standard method for characterizing periodicity in unevenly sampled time series by estimating a Fourier power for each possible period, and the PFAP is the probability of finding a period with the same Fourier power in a random generated light curve.
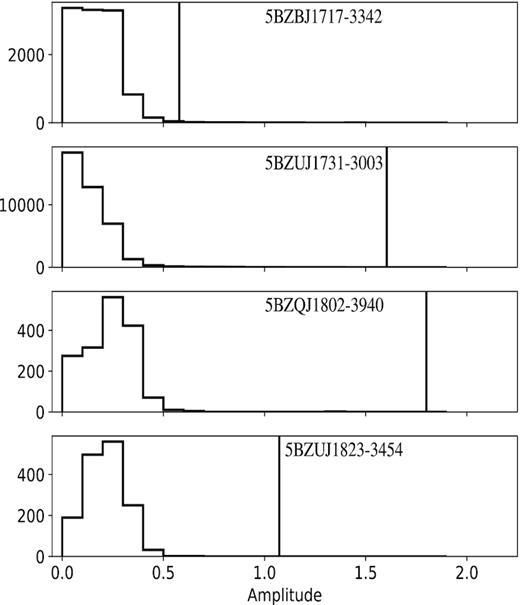
Distribution of the feature Amplitude obtained with the feets software. The histograms correspond to the values of the comparison samples, and the vertical lines represent the value obtained for each of the blazars.
Table 7 shows the results of the Ks variability for the four blazars, with the IDs in column (1); the mean magnitude in column (2); the absolute value of the slope of the variation in column (3); the fractional variability amplitude (×100 per cent) in column (4); and the variability Amplitude from the ML analysis in column (5). The mean magnitudes were only corrected for galactic extinction and the presence of bright nearby stars was not taken into account. These parameters were also obtained for the reference stars. Median values of the slope of the variation and the fractional variability amplitude are at most 10−5 and 35 per cent, respectively. These values are too small compared with those of the blazars quoted in the table.
The blazars: Ks variability.
| Roma-BZCAT ID | Mean | Slope variation | σrms (×100 per cent) | Variability |
|---|---|---|---|---|
| magnitude | magnitude/day | Amplitude | ||
| 5BZBJ1717−3342 | 13.86 | 0.00014 | 194.60 | 0.58 |
| 5BZUJ1731−3003 | 12.42 | 0.00007 | 165.23 | 1.60 |
| 5BZQJ1802−3940 | 15.09 | 0.00012 | 698.93 | 1.80 |
| 5BZUJ1823−3454 | 13.04 | 0.00001 | 138.29 | 1.07 |
From the analysis of the linear fit slope of the Ks variation, we observed that the slope of the blazars, 5BZBJ1717−3342 and 5BZQJ1802−3940, are comparable, within the limit value reported by Cioni et al. (2013) for quasars. The blazars, 5BZUJ1731−3003 and 5BZUJ1823−3454, have smaller slopes and amplitude magnitudes greater than 1 mag. The blazar 5BZQJ1802−3940, which has an FSRQ type, shows the highest σrms value, in agreement with the results of Sandrinelli et al. (2014) for the only FSRQ object in their sample of seven blazars. In Fig. 12, the blazar amplitudes are clearly different from the values of the comparison sample for all the blazars in general, and especially for 5BZQJ1802−3940. The most probable Lomb–Scargle periodogram for this blazar is 1397.5 d, obtained in an observation range of 2500 d. In the other three blazars, the Lomb–Scargle periodograms yielded longer values than the observation range, and so they are considered unreliable. In the four cases, we obtained PFAP = 0, which means that it is unlikely to have a random data set with this period.
The blazar 5BZQJ1802−3940 shows the most relevant results: the slope of the variation is 12 × 10−5, the fractional variability amplitude near 700 per cent, and the variability amplitude of 1.80. The four blazars have larger values in these properties compared with those of the stars in the analysed regions. All these results support the distinct variability case, and therefore a more deep and thorough analysis may shed more light on the nature of these interesting objects.
5 SUMMARY
The blazars account for about one third of the Fermi-LAT-detected objects (Acero et al. 2015) and there is an association of these objects in the Roma-BZCAT with 3FGL sources (Massaro et al. 2012,2013). We examined the regions around the four 3FGL sources associated with Roma-BZCAT blazars, using search areas of around twice the position uncertainties.
Our main goal was to identify 3FGL sources with near- and mid-IR counterparts using the VVV and WISE surveys, respectively. For the near-IR data, we performed the photometry using the combination of SE xtractor + psf (Bertin 2011) in the five VVV passbands: Z, Y, J, H, and Ks (Baravalle et al. (2018) and we obtained the morphological parameters, magnitudes, and colours of the objects. We also used the WISE survey (Wright et al. 2010) to obtain mid-IR information at 3.4, 4.6, 12, and 22 µm of the objects. We selected all the WISE sources with an S/N > 7 in one passband using the WGS method developed by Massaro et al. (2011) and D’Abrusco et al. (2012).
The two first blazars (5BZBJ1717−3342 and 5BZUJ1731−3003) have higher uncertainties in their 3FGL positions and the distances between these 3FGL sources and Roma-BZCAT blazars are of the same order. The other two sources (5BZQJ1802−3940 and 5BZUJ1823−3454), with uncertainties of about 1.1 and 1.5 arcmin in their 3FGL positions, have distances smaller than 0.5 arcmin. The Roma-BZCAT positions of the blazars coincide with those of the VVV survey.
We analysed the blazars using near- and mid-IR CMDs and CCDs from the VVV and WISE surveys, respectively. The objects, 5BZUJ1731−3003 and 5BZQJ1802−3940, have both near- and mid-IR data from the VVV and WISE surveys. The other two have only near-IR photometry. In the near-IR CMD and CCDs, the four sources are located in different places compared with the stars and extragalactic sources, with the exception of the (J − H) versus (Y − J) CCD. We found that the colour cuts (J − Ks) > 1.0 mag and (H − Ks) > 0.5 mag might be used to identify blazars in the near-IR data. The only blazar with clear difference in the colour (J − H) is 5BZQJ1802−3940. The blazar candidate, 5BZBJ1717−3342, is the faintest object with no detection in Z and Y bands of the VVV. Using the CCDs in the other bands, we found a VVV candidate well separated from the rest of the objects, in coincidence with the position of the Roma-BZCAT. In the WISE domain, we were unable to find any WISE candidate to be a blazar due to the contamination of a nearby star. Thus, we could not rule out the galactic origin and we need spectroscopic observations to determine its extragalactic nature. We defined the blazar 5BZUJ1731−3003 as a BL Lac object based on its position in the mid-IR CCDs with WISE data. From the VVV data base, we also analysed the Ks light curves of the blazars, nearby stars, and all the objects within specified regions. The variability analysis allowed us to obtain main parameters, such as the slope of the linear fit of the variation and the fractional variability amplitude. From the ML analysis, we obtained the amplitude, the LS period, and the PFAP as main features.
The blazars 5BZBJ1717−3342, 5BZUJ1731−3003, and 5BZUJ1823−3454 show some of the analysed properties. The blazar 5BZQJ1802−3940, a flat spectrum radio quasar, is the one with the most important results in the properties. It has the smallest uncertainties in the Fermi-LAT position and it is the brightest WISE source of our sample. It is the only one with all the near-IR properties in the CMD and CCDs very different from the stars and extragalactic objects in the field. It is a stellar source with the highest amplitude in the Ks differential light curve and fractional variability amplitude. Using ML techniques, it has a Lomb–Scargle period of 1397.5 d and a PFAP = 0. These results are very different from those of the comparison sample and they show that they are genuine, which means that it is unlikely to have a random data set with this period.
The WISE’s WGS method is appropriate to find blazars at higher latitudes but, in the area of the Galactic plane, it is not as reliable. Two of the four studied blazars were found in the WISE survey with this methodology. On the other hand, the four blazars were found in the VVV survey, which is dedicated to studying the variability of Milky Way stars. At these lower galactic latitudes, the VVV survey is appropriate to find near-IR sources associated with blazars in combination with WISE mid-IR data.
In general, these results show that multifrequency analysis is of paramount importance, especially in studies of high-energy sources. In particular, this kind of work is very important because it will allow us to find many more blazars at low galactic latitudes minimizing the lack of these in this area of the sky.
ACKNOWLEDGEMENTS
We sincerely thank the anonymous referee for the valuable comments and suggestions. This work was partially supported by Consejo de Investigaciones Científicas y Técnicas (CONICET) and Secretaría de Ciencia y Técnica de la Universidad Nacional de Córdoba (SecyT). We gratefully acknowledge data from the ESO Public Survey program ID 179.B-2002 taken with the VISTA telescope, and products from the CASU. DM is supported by the BASAL Center for Astrophysics and Associated Technologies (CATA) through grant AFB 170002, by the Programa Iniciativa Científica Milenio grant IC120009, awarded to the Millennium Institute of Astrophysics (MAS), and by Proyecto FONDECYT No. 1170121. We also thank Román Vena Valdarenas for helping us to improve the Figures.
Footnotes
See https://feets.readthedocs.io for additional reference.
