


Abstract
Spectral observations of the massive colliding wind binary Eta Carinae show phase-dependent variations, in intensity and velocity, of numerous helium emission and absorption lines throughout the entire 5.54-yr orbit. Approaching periastron, the 3D structure of the wind–wind interaction region (WWIR) gets highly distorted due to the eccentric (e ∼ 0.9) binary orbit. The secondary star (ηB) at these phases is located deep within the primary's dense wind photosphere. The combination of these effects is thought to be the cause of the particularly interesting features observed in the helium lines at periastron. We perform 3D radiative transfer simulations of η Car's interacting winds at periastron. Using the simplex radiative transfer algorithm, we post-process output from 3D smoothed particle hydrodynamic simulations of the inner 150 au of the η Car system for two different primary star mass-loss rates (|$\dot{M}_{\eta _{\mathrm{A}}}$|). Using previous results from simulations at apastron as a guide for the initial conditions, we compute 3D helium ionization maps. We find that, for higher |$\dot{M}_{\eta _{\mathrm{A}}}$|, ηB He0+-ionizing photons are not able to penetrate into the pre-shock primary wind. He+ due to ηB is only present in a thin layer along the leading arm of the WWIR and in a small region close to the stars. Lowering |$\dot{M}_{\eta _{\mathrm{A}}}$| allows ηB's ionizing photons to reach the expanding unshocked secondary wind on the apastron side of the system, and create a low fraction of He+ in the pre-shock primary wind. With apastron on our side of the system, our results are qualitatively consistent with the observed variations in strength and radial velocity of η Car's helium emission and absorption lines, which helps better constrain the regions where these lines arise.
1 INTRODUCTION
The massive colliding wind binary Eta Carinae (η Car) is one of the most luminous stellar objects in the Galaxy (LTotal ≳ 5 × 10⁶ L⊙). During its highly eccentric (e ∼ 0.9), 5.54 -yr orbit, the slow but dense wind of the primary star ηA (v∞ ≈ 420 km s−1, |${\dot{M}_{\eta _{\mathrm{A}}}}$| ≈ 8.5 × 10⁻⁴ M⊙ yr−1; Hillier et al. 2001; Groh et al. 2012a) collides with the faster (v∞ ≈ 3000 km s−1; Pittard & Corcoran 2002; Parkin et al. 2009), but less dense (|${\dot{M}_{\eta _{\mathrm{B}}}}$| ≈ 1.4 × 10⁻⁵ M⊙ yr−1) wind of the secondary star ηB. Every periastron, orbital motion and the binary's large eccentricity highly distort the stellar winds and wind–wind interaction region (WWIR), causing ηB to become deeply embedded within the denser ηA wind (Okazaki et al. 2008; Madura 2010; Parkin et al. 2011; Madura et al. 2012a, 2013). At periastron, the dense distorted ηA wind and WWIR trap the ionizing radiation from ηB that is responsible for the formation of numerous high-ionization (ionization potential ≳13.6 eV) emission and absorption lines observed during the broad part of the orbit around apastron (Verner, Bruhweiler & Gull 2005; Damineli et al. 2008b; Gull et al. 2009, 2011; Madura 2010; Madura & Groh 2012; Madura et al. 2012a, 2013; Teodoro et al. 2013).
In a recent paper, Clementel et al. (2015, hereafter C15) presented results from 3D radiative transfer (RT) simulations focusing on the ionization structure of helium, due to ηB's ionizing radiation, in the inner ∼155 au of the η Car system at an orbital phase of apastron. As summarized in C15, helium spectral features provide important information on both the geometry and physical properties of the η Car binary and the individual stars. While various helium features are present throughout the entire orbit, they show their most interesting behaviour during periastron passage (Nielsen et al. 2007; Damineli et al. 2008b; Teodoro et al. 2012).
The goal of this paper is to extend the work of C15 and analyse the effects of ηB's ionizing radiation during the spectroscopic low state at periastron. As in C15, we focus on the inner ∼155 au of the η Car system and apply RT post-processing simulations to 3D smoothed particle hydrodynamics (SPH) simulations of η Car's colliding winds (Madura et al. 2013, hereafter M13) to compute 3D maps of the ionization structure of He. This work sets the stage for future efforts to compute synthetic He line profiles for direct comparison with available observations. The goal is to constrain where and how the observed broad He emission and absorption lines form during the periastron event. We further aim to explain the temporal behaviour of the broad He lines as the η Car system moves from apastron through periastron. Again, we note that we focus solely on interpreting the broad emission and absorption features of He that arise in the stellar winds and WWIRs, and not the narrower (≲50 km s−1) features that form in the Weigelt blobs and other dense, slow-moving near-equatorial circumstellar ejecta (Weigelt & Ebersberger 1986; Damineli et al. 2008b).
This paper is organized as follows. In Section 2, we summarize our numerical approach. Section 3 describes the results. A discussion of the results and their implications is in Section 4. Section 5 summarizes our conclusions and outlines the direction of future work.
2 METHODS
The numerical approaches in this paper, both for the SPH and RT simulations, are identical to those in C15. As in previous works, we use the simplex algorithm (Ritzerveld & Icke 2006; Ritzerveld 2007; Kruip et al. 2010; Paardekooper, Kruip & Icke 2010; Kruip 2011) to post-process 3D SPH simulation output (M13). For further details, we refer the reader to Clementel et al. (2014), C15, and references therein. We also retain the naming convention used in M13, Clementel et al. (2014), and C15 when referring to the SPH and simplex simulations in this paper, namely, Case A (|${\dot{M}_{\eta _{\mathrm{A}}}} = {8.5 \times 10^{-4}}$| M⊙ yr−1), Case B (|${\dot{M}_{\eta _{\mathrm{A}}}} = {4.8 \times 10^{-4}}$| M⊙ yr−1), and Case C (|${\dot{M}_{\eta _{\mathrm{A}}}} = {2.4 \times 10^{-4}}$| M⊙ yr−1). In the following, we briefly describe only the key aspects and differences that are directly relevant to this work.
Due to the high eccentricity of the η Car system (e ∼ 0.9), as the stars approach periastron, both the 3D structure and dynamical evolution of the individual stellar winds and WWIR change drastically, compared to the majority of the orbital period. The stellar separation drops to ∼ 1.5 au and orbital speeds increase greatly, becoming comparable to the wind speed of ηA (see Section 3 for details). The rapid orbital motion during periastron thus leads to major changes in the structure of the winds and WWIR on relatively short time-scales of the order of a few days (Okazaki et al. 2008; Parkin et al. 2011; Madura et al. 2012a; M13).
To properly resolve this complex situation, we use two different SPH simulation domain sizes from M13. The larger domain is the same as the one used in C15 (r = 10 a = 155 au, where a = 15.45 au is the length of the orbital semimajor axis), and allows for a direct comparison of the results in this paper with those at apastron in C15. The smaller domain simulations have a computational domain radius r = 1.5 a = 23 au and eight times the number of SPH particles used in the r = 10 a simulations, leading to a roughly factor of 2 improvement in the overall spatial resolution compared to the r = 10 a simulations. The high-resolution simulations focus only on phases around periastron (ϕ = 0.97–1.03, where by convention, ϕ = t/2024 = 0, 1, 2, …, is defined as periastron, and ϕ = 0.5, 1.5, …, is defined as apastron), with output written every Δϕ ≈ 8 × 10⁻⁴, which is approximately every 1.6 d of the 2024-d orbit. These smaller, higher-resolution simulations ensure that we are adequately resolving the stellar winds and WWIR directly between the stars, as well as any possible WWIR ‘collapse’ that may affect the escape of ηB's ionizing radiation (M13). The higher resolution r = 1.5 a simulations are also useful for checking the accuracy of the r = 10 a results.
We consider the ionization of hydrogen and helium atoms by both collisional- and photoionization, and assume the same abundance by number of He relative to H as Hillier et al. (2001), nHe/nH = 0.2. We employ a single photoionizing source located at the position of ηB. As in C15, we consider ηB to be an O5 giant with Teff ≈ 40, 000 K, we assume a total ionizing flux for H and He of 3.58 × 1049 photons s−1 (Martins, Schaerer & Hillier 2005), and we use three bins to sample the stellar spectrum, which we approximate with a blackbody. The bin edges of each frequency bin are set by the ionization energy of each species. The first bin ranges from the ionization frequency of H0+ (|$\nu _{{\mathrm{H}^{0+}}}$| = 3.28 × 10¹⁵ Hz) to that of He0+ (|$\nu _{{\mathrm{He}^{0+}}}$| = 5.93 × 10¹⁵ Hz), the second from |$\nu _{{\mathrm{He}^{0+}}}$| to |$\nu _{{\mathrm{He}^{+}}}$| (1.31 × 10¹⁶ Hz), and the third from |$\nu _{{\mathrm{He}^{+}}}$| to a maximum frequency equal to ten times |$\nu _{{\mathrm{H}^{0+}}}$|. We use an effective cross-section representation to determine the correct number of absorptions within each frequency bin. We set the blackbody temperature to the value that produces the correct ratio |$\mathrm{photons}_{{\mathrm{H}^{0+}}} / \mathrm{photons}_{{\mathrm{He}^{0+}}}$| (in this case Tbb = 49 000 K), in accordance with the |$q_{{\mathrm{H}^{0+}}} / q_{{\mathrm{He}^{0+}}}$| ratio in Martins et al. (2005). |$q_{{\mathrm{He}^{+}}}$| is effectively zero for ηB.
In figures displaying our simplex results for density and temperature, we visualize the average of the four vertices that compose each Delaunay cell. Unfortunately, this approach leads to cell values that are difficult to interpret if the vertex values differ by several orders of magnitude. This might occur for the fractions of He0+, He+, and He2+. In order to visualize results for these quantities in an understandable way that more truthfully represents the physics of our RT simulations, we adopt the visualization approach described in section 2.2.5 of C15. In all figures showing ionization structure, we display the minimum vertex value for the fraction of He0+ and the maximum vertex value for the fraction of He2+. For He+, we show the maximum value whenever the temperature of the gas is lower than 105 K, and the minimum otherwise (for temperatures >105 K, the fraction of He+, due to collisional ionization, is ≈ 10−3 or lower). For the reasons discussed in section 2.3.1 of C15 (i.e. H is already ionized in the inner ∼ 120–150 au region centred around ηA), we do not include plots of the ionization structure of H. We emphasize that the visualizations are merely to help guide the reader, and neither the physics nor the conclusions of our work depend on them (see C15 for details).
Using the method described in section 2.3.1 of C15, we account for the inner He+ volume around ηA (r ∼ 3 au for Case A, and ∼ 7.5 au for Case B) based on 1D cmfgen models of η Car by Hillier et al. (2001, 2006). We do not include the inner He2+ zone in ηA's wind in the r = 10 a simulations since it is of negligible size (r < 1 au), and because ηB produces essentially zero He+-ionizing photons. Due to their smaller domain size, for added accuracy, the 23 au simulations do include the He2+ structure in ηA's innermost wind (r ∼ 0.7 au for Case A, and ∼0.8 au for Case B).
As discussed in C15, our results at apastron appear to rule out low values of |$\dot{M}_{\eta _{\mathrm{A}}}$|, such as that in Case C. This is supported by the work of M13 and recent observations of η Car (Gull and Corcoran, private communication). Therefore, we focus in this paper on simulation Cases A and B, which represent the most likely values of ηA's current mass-loss rate. Moreover, little information would be obtained by including Case C since for such a low mass-loss rate ηA already singly-ionizes He throughout the entire computational domain in the r = 1.5 a simulations, and nearly the entire domain (out to r ≈ 120 au) in the r = 10 a simulations.
Finally, we note that we use a standard Cartesian coordinate system with the origin located at the system centre of mass and the orbital plane set in the xy plane, with the major axis along the x-axis. The stars orbit counterclockwise if viewed from along the +z-axis. In this system of reference, at periastron, ηA is to the right and ηB is to the left.
2.1 Initial ionization state of the gas
As in C15, we post-process the SPH simulation output. This approach works well for the η Car system at apastron, when the ionization state reaches an equilibrium value on a time-scale much shorter than the orbital time-scale. More importantly, at apastron, the ηB wind cavity is an almost axisymmetric cone, allowing ηB's ionizing photons to completely ionize the low-density secondary wind. In other words, it is reasonable at apastron to assume that knowledge of the ionization structure of the preceding SPH time-step is not required for accurate RT results.
In this paper, however, we deal with phases at periastron where, due to rapid orbital motion, the interacting wind structures evolve on a time-scale comparable to the time necessary for the RT simulations to reach a stable ionization state. Moreover, the ηB wind cavity at periastron is strongly asymmetrical and distorted. Regions that were ionized by ηB in an earlier snapshot may not be reachable by ηB's photons in the next snapshot. To tackle these issues, we use a slightly different approach than that in C15.
Using collisional ionization equilibrium, the results of C15, and estimates for the recombination time of He+ as a function of gas density and temperature, we are able to better constrain the initial ionization state of the gas for use as an initial condition in our periastron simplex simulations. We know that He0+ in the cooler (T ≈ 104 K) unshocked gas in the ηB wind on the apastron side of the system is completely photoionized by ηB during most of the binary orbit around apastron (C15). Observations with the Hubble Space Telescope/Space Telescope Imaging Spectrograph (HST/STIS) show that numerous high-ionization lines that require ηB's ionizing flux are present for most of the orbit and do not start to fade until phase ϕ ≈ 0.984 (approximately one month before periastron; Gull et al. 2009; M13). Therefore, we can safely assume that ηB is able to completely ionize He0+ throughout its unshocked wind at least until ϕ ≈ 0.985 (and at least for the length scales of interest here, r ≲ 155 au from the stars, since the HST observations show ionized structures extending several thousand au from the stars). After ϕ ≈ 0.985, ηB becomes deeply embedded in the dense wind of ηA and the WWIR becomes so distorted by orbital motion that we can no longer assume that ηB can efficiently ionize He0+ throughout its entire cool unshocked wind. If the He in the low-density (n ≲ 106 cm−3) unshocked ηB gas is no longer photoionized by the star, then, at T = 104 K, He+ should recombine on a time-scale trec ≈ 42.4 d (or longer). Thus, around periastron, for gas with T ≈ 104 K and n ≈ 106 cm−3, the recombination time-scale for He+ is about an order of magnitude larger than the orbital time-scale.
Any gas that recombines very slowly compared to the orbital time-scale around periastron poses a potential problem for the accuracy of our RT simulations, mainly because we are post-processing the SPH simulation output. The SPH output contains no information about the previous ionization state of the gas before we start our simplex simulations. However, any gas with a low enough recombination rate should remain ionized from one snapshot to the next, even though ηB photons no longer reach that material.1 Therefore, we should preserve the ionization state of low-recombination-rate gas in the initial condition of our RT simulations.
The time difference between ϕ = 0.985 and periastron is ≈ 30 d. The recombination time for He+ gas with T ≈ 104 K and n ≈ 106 cm−3 is about two weeks longer than this. Lower-density gas at T ≈ 104 K will have even longer recombination times. If we assume that the ηB ionizing flux becomes trapped by ηA's dense wind and the WWIR at ϕ ≈ 0.985, then at periastron, any such low-recombination-rate gas that was initially photoionized by ηB at ϕ ≈ 0.985 should still be ionized.
Therefore, to mimic the fact that the low-density, cool ηB wind on the apastron side of the system should remain ionized at periastron, we set the He fractions in the ηB wind material with n < 107 cm−3 and T < 4 × 10⁴ K to be ∼97 per cent He+. This should generate an initial condition closer to the previous ionization state of the photoionized ηB gas, since for gas with n < 107 cm−3 and T < 4 × 10⁴ K, the He+ recombination time-scale is ≈ 4 d or longer. The use of collisional ionization equilibrium as an initial condition for the remaining gas remains a valid approximation even around periastron, since for the pre- and post-shock ηA wind, the high densities allow the gas to recombine almost instantaneously. Hot (T > 4 × 10⁴ K) gas in the post-shock ηB wind is collisionally ionized to He+ or higher.
Due to the shorter dynamical time-scales around periastron, which alter the gas distribution from snapshot to snapshot, we must also run simplex for a much shorter simulation time, compared to that used at apastron in C15. In our simulation testing we find that, setting the initial condition of the gas as described above, in Case A, the ionization state reaches an equilibrium value in less than one day. In Case B, the gas reaches ionization equilibrium in ∼ 2–3 d. Since significant changes to the gas density and temperature distributions around periastron also occur on a time-scale of ∼ 2–3 d, we use a total RT simulation time of 2.5 d and a simulation time-step of ∼5 min in order to achieve an accurate RT calculation of the ionization volumes and fractions. At these time-scales, the gas distribution, even around periastron, can be assumed to be roughly constant.
3 RESULTS
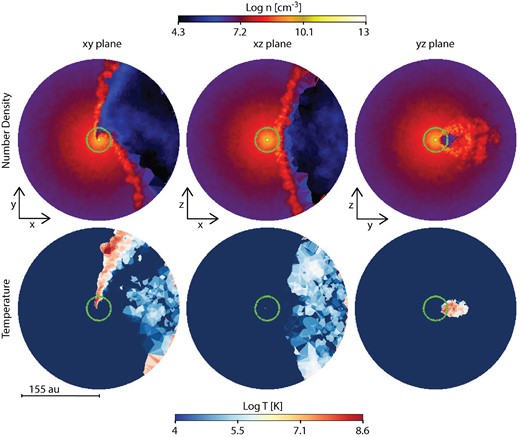
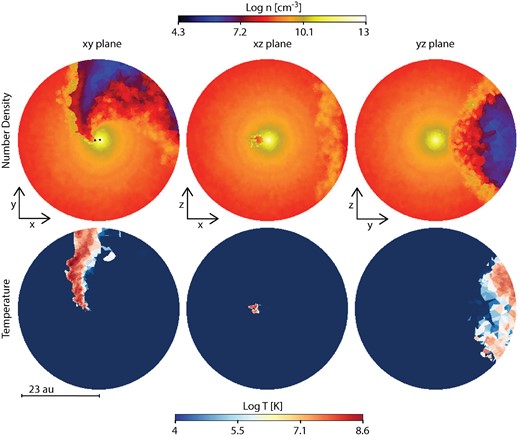
To help the reader better understand the RT results, we first briefly describe the density and temperature structure in the xy, xz, and yz planes. For more details on the hydrodynamical simulation results, see M13. Figs 1 and 2 show the number density (top row) and temperature (bottom row) for the 155 au and 23 au Case A simulations, respectively (the green circles in Fig. 1 mark the domain size of the 23 au simulations). As described in M13, approaching periastron, the orbital speed of ηA relative to ηB increases to ≈360 km s−1, close to ηA's wind speed (420 km s−1), highly distorting the WWIR. The small stellar separation at periastron (∼1.5 au) also prevents ηB's wind from reaching its terminal speed before colliding with ηA's wind. Combined with the effects of radiative inhibition by ηA (M13), this leads to a significant slowing of ηB's pre-shock wind, which alters the wind momentum ratio at the WWIR. This decreases the WWIR opening angle and moves the WWIR apex closer to ηB. This behaviour occurs in the Case B simulations in Figs 3 and 4 as well, although lowering |$\dot{M}_{\eta _{\mathrm{A}}}$| further increases the WWIR opening angle and moves the WWIR apex closer to ηA.
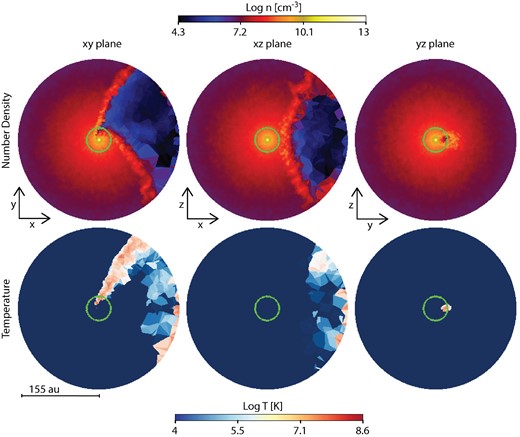
Slices in the orbital xy (left-hand column), xz (middle column) and yz (right-hand column) planes through the larger (10 a) 3D simulation volume for the Case A simulation of η Car at periastron. Rows show the number density (top, log scale, cgs units) and temperature (bottom, log scale, K). The length scale is shown under the bottom-left panel. In the first column (i.e. the orbital plane) ηA is to the right and ηB is to the left. The green circle marks the boundary of the smaller (r = 1.5a = 23 au) domain simulations (see Fig. 2).
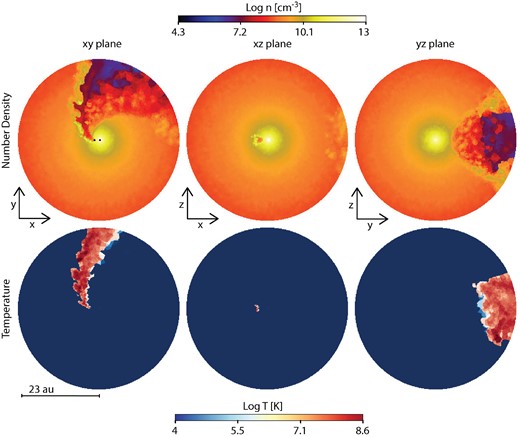
Same as Fig. 1, but for the smaller (i.e. 1.5 a) simulation domain. The black dots in the centre of the top-left panel mark the positions of the stars.
The above effects create a high asymmetry between the trailing and leading arms of the WWIR at periastron, as ηB becomes deeply embedded in ηA's dense inner wind. The only direction ηB can effectively drive its wind is away from ηA (top-left panel of Figs 2 and 4). This has a strong impact on the location of the shock-heated gas. As shown in the bottom-left panel of Figs 2 and 4, the post-shock secondary wind is heated to temperatures higher than 106 K only where the ηB wind collides with the highly distorted leading arm of the WWIR (in red). The trailing wind of ηB is unable to collide with ηA's downstream wind, and so there is no hot shocked gas there. This effect is also visible in the bottom-left panel of Figs 1 and 3. However, in the larger domain simulations, some residual hot gas remains at the outermost right edge of the simulation domain in the xy and xz plane slices. This is the expanding, adiabatically-cooling remnant of the trailing arm of the WWIR from just before periastron.
Looking at the xz plane (middle column of Figs 1–4), during periastron, ηB passes behind ηA, allowing, for a short period, the primary wind to expand in the apastron (+x) direction. During this time, the apex of the low-density cavity on the apastron side of the system fills with dense primary wind. The thickness and density of this inner primary wind region increases with |$\dot{M}_{\eta _{\mathrm{A}}}$|, since higher |$\dot{M}_{\eta _{\mathrm{A}}}$| move the apex of the WWIR farther from ηA, allowing the primary wind to fill a larger volume in the apastron direction. Slices in the xz plane also sample mostly cold (104 K) gas from both winds, although the ηB wind cavity in the Case B simulations contains warmer material due to the larger WWIR opening angle and less oblique shocks (M13).
Slices in the yz plane (right-hand column of Figs 1–4) simply show that at periastron, the leading arm of the WWIR has passed through the yz plane. There are now clear differences in both the density and temperature along the y axis. The −y side of the system still consists of unshocked ηA wind, but to the +y side there is a small cavity filled with hot, shocked ηB wind that is bordered by dense post-shock ηA wind. This cavity is larger in the Case B simulations due to that simulation's larger WWIR opening angle.
3.1 He ionization structure and influence of |$\dot{M}_{\eta _{\mathrm{A}}}$|
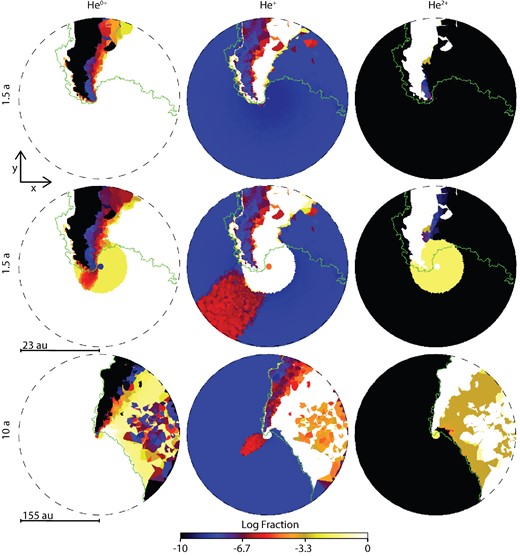
Figs 5 and 6 present the He ionization structure in the orbital xy plane for Cases A and B, respectively. In all figures, columns illustrate, left to right, the fractions of He0+, He+, and He2+. Rows display the 23 au domain without the inner ionization volume due to ηA (top), the same domain with the inner He+ and He2+ ionization volumes (middle, filled yellow, and blue circles in the leftmost panel, respectively), and the larger (155 au) simulation domain with the inner He+ ionization volume due to ηA included (bottom). The green contour highlights the boundary between the unperturbed pre-shock ηA wind and the density-enhanced post-shock ηA wind. Due to the complex situation at periastron, the green contour is meant more as a guide to better understand the results than a precise position for the pre-shock ηA wind.
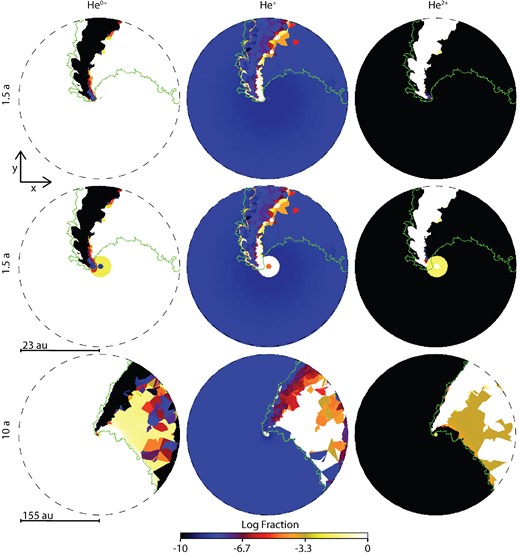
Slices in the orbital plane through the 3D simplex simulation volume for the Case A simulation. Columns, from left to right, show the computed fractions of He0+, He+, and He2+ (log scale). Rows show, from top to bottom, the smaller (23 au) simulation domain without the inner ionization volumes due to the primary, the smaller (23 au) simulation domain with the He+ and He2+ inner ionization volumes due to the primary included, and the bigger (155 au) simulation domain including the He+ ionization volume due to the primary. In this and Fig. 6, the green line marks the edge of the pre-shock primary wind.
As discussed in C15, ηB should not have many He+-ionizing photons and, therefore, He2+ is produced principally through collisional ionization. As expected, neglecting the inner He2+ region in ηA's wind, He2+ is only present in the hottest (T ≳ 105 K) regions of the system, i.e. the shock-heated gas in the leading arm of the WWIR, and the adiabatically-cooling hot gas in the remnant of the trailing arm (from before periastron passage).
Similar to the case at apastron (C15), ηB ionizing photons create different He+ structures depending on the value of |$\dot{M}_{\eta _{\mathrm{A}}}$|. In Case A, the He0+-ionizing photons are only able to ionize a thin layer within the leading arm of the WWIR, and a rather small volume of the diffuse ηA wind that is expanding into the ηB wind cavity located near the remnant of the WWIR's trailing arm (first row of Fig. 5). The dense primary wind expanding into the ηB wind cavity is able to stop ηB's He0+-ionizing photons. The He+ present in the cooler, unshocked ηB wind on the apastron side of the system is the previously photoionized gas that is slowly recombining. The inclusion of the inner He+ and He2+ regions due to ηA have basically no effect on the larger-scale He ionization structures in Case A (compare the top and middle rows of Fig. 5). The only noticeable difference is that the He0+-ionizing photons are able to penetrate through the leading arm of the WWIR and further ionize a very small area inside the inner 3 au ηA He+ ionization volume (the red within the yellow circle, close to the centre in the −y direction in the first panel of the middle row). For Case A, the dense outer primary wind (i.e. the area beyond the green contour) is almost entirely He0+.
The larger WWIR opening angle in Case B, due to the lower |$\dot{M}_{\eta _{\mathrm{A}}}$|, allows the He0+-ionizing photons to escape the inner core and singly-ionize He in a portion of the expanding primary and secondary winds on the apastron side of the system (right-hand side of the panels in Fig. 6). Contrary to Case A, introducing the regions of ionized He in ηA's inner wind changes the extent of the ionization front in both the primary and secondary winds. The larger (7.5 au) He+ zone in Case B allows ionizing photons to penetrate deeper into the receding primary wind, producing a region of He+ (although the fraction of He+ remains quite low, see the red region in the middle column in the middle and bottom rows of Fig. 6). The He+ on the apastron side of the system is a combination of ongoing photoionization and previously ionized gas which is slowly recombining. However, as in Case A, the dense primary wind is mostly composed of He0+ and very effectively traps ηB's He0+-ionizing photons (bottom row of Fig. 6).
4 DISCUSSION
From the discussions in Sections 2 and 3, it is evident that the interpretation of the results at periastron is much more difficult than at apastron, especially in terms of trying to understand how the results relate to observations of the various He line profiles (Nielsen et al. 2007; Damineli et al. 2008b). Nevertheless, we can use our results to try to better constrain the regions where the He emission and absorption features are generated. We focus on the Case A simulation results, since as discussed in M13, C15, and above, they most likely better represent the current value of |$\dot{M}_{\eta _{\mathrm{A}}}$|. We note that spectroscopic phase, defined by e.g. the disappearance of the narrow component of the He i lines (Damineli et al. 2008b, or alternatively, the minimum in the observed X-ray light curve, Corcoran et al. 2010), may differ from true orbital phase by up to one month.
Our results show that, at periastron, ηB is able to singly-ionize He in only a very thin layer of the post-shock ηA wind along the WWIR leading arm, and a very small region close to the stars. The denser ηA wind, expanding into the secondary wind cavity, is effectively able to stop the He0+-ionizing photons. Therefore, the lower-density receding secondary wind on the apastron side and the adiabatically-cooling trailing arm of the WWIR from before periastron are shielded from ionizing photons from ηB. We do not expect this material to be neutral due to the long recombination time-scales for gas at these densities (n < 107 cm−3) and temperatures (≳104 K). The disappearance of the shock-heated region in the trailing arm of the WWIR, caused by the curvature of the WWIR, causes a strong asymmetry in the high-temperature gas which is now mainly present in the WWIR leading arm. The He in this very hot region (T > 106 K) is collisionally doubly-ionized. With the exception of the inner He+ and He2+ ionization regions due to ηA's ionizing flux, He in the extended primary wind is mostly neutral. This includes post-shock gas in the remnant of the trailing arm, and a significant portion of the extended leading arm, of the WWIR.
Observations show that the broad He i lines are blueshifted for most of the orbital period, both in emission and absorption. The P Cygni absorption starts increasing approximately three weeks before spectroscopic phase zero, reaching maximum absorption around phase zero, before decreasing to a complete disappearance ∼20 d after phase zero (Nielsen et al. 2007; Damineli et al. 2008a). The radial velocity of the absorption reaches its maximum blueshifted value (−610 km s−1) shortly before periastron, and then suddenly shifts during periastron down to ∼−250 km s−1. This absorption must be produced by material between the observer and ηA, either in the WWIR or in the pre-shock ηA wind.
Because the radial velocity variations seen in the He i λ7067 absorption are reminiscent of those observed from a star in a highly eccentric orbit, Nielsen et al. (2007) assumed that the He i absorption is associated with the pre-shock wind of ηA, ionized by the far-UV flux from ηB. However, this assumption leads to an unusual, extreme system mass ratio of q ∼ 0.1, with a mass for ηB of 210 M⊙ and a mass for ηA of ∼20 M⊙, in strong disagreement with the most commonly accepted values. In contrast, based on the maximum velocity of the absorption seen in the He i line and the requirements of high excitation flux and gas density, Damineli et al. (2008a) conclude that the only plausible locations for the formation of the broad He i absorptions are the walls of the WWIR. Our RT results favour this second scenario. At periastron, ηB is deep within the primary wind and its He0+-ionizing photons are not able to reach the pre-shock ηA wind or penetrate beyond the dense layer of post-shock ηA wind. As shown in Fig. 5 (central column, middle, and bottom rows), He in the pre-shock ηA wind is almost entirely neutral. The region of He+ is confined to the centre of the system.
Modelling of η Car's X-ray light curve and observed broad, extended emission from numerous forbidden emission lines have helped constrain the orbital inclination (i), argument of periapsis (ω), and sky position angle (PAz) of the η Car binary system (Okazaki et al. 2008; Parkin et al. 2009; Madura et al. 2012a). It is generally agreed that the η Car binary is inclined away from the observer by roughly ∼45°, with ω ≈ 240°–285° and PAz ≈ 302°–327°, which places ηB at apastron on the observer's side of the system and implies that ηB orbits clockwise on the sky. With this orientation of the binary on the sky, at apastron, our line of sight (LOS) is more perpendicular to the apex of the WWIR surface. Based on the results in C15, we propose that the much denser WWIR (specifically, the compressed post-shock ηA wind) should dominate the P Cygni absorption at phases around apastron. However, because our LOS is more perpendicular to the WWIR around apastron, the column density of He+ material between us and the continuum source ηA is relatively modest, resulting in a moderate amount of absorption. Moreover, because we are viewing the WWIR inclined away from us at roughly 45 deg, material flowing towards us within the wall of post-shock ηA wind will have a maximum LOS velocity of ∼ 300 km s−1, since the maximum true velocity of the gas within the compressed wall of post-shock ηA wind will be roughly equal to the terminal velocity of ηA's wind.
When approaching periastron, the trailing arm of the WWIR sweeps across our LOS. When this occurs, our LOS is parallel to and intersecting the WWIR. This results in a significantly increased column of He+ between us and ηA, producing an increase in the amount of He i absorption. Because we are now looking directly down the WWIR, we are also seeing the fastest material in LOS, resulting not only in an increase in the amount of He i absorption, but also an increase in the blueshifted velocity of this absorption. This scenario is in qualitative agreement with both the increase in the absorption and its shift towards more blueshifted velocities of the observed He i P Cygni profiles going into periastron. Just after periastron, the strong He i λ7067 absorption component rapidly vanishes. This is also consistent with our results, since we see that at periastron, ηB is no longer able to ionize the WWIR or the primary wind. With the observer on the apastron side of the system, the gas in LOS, further away from the central region, cannot be ionized by ηB, resulting in effectively no He+ between us and the central ηA He+ region, and thus a lack of He i absorption.
The results in C15 imply that the He i emission seen around apastron should arise from a combination of the inner ηA He+ zone, the pre-shock ηA wind close to the WWIR apex ionized by ηB, and the layer of post-shock ηA wind in the WWIR that is also ionized by ηB. The different regions, depending on the orbital phase, where the He i emission can form might help explain the multiple emission components observed in the line profiles (Nielsen et al. 2007). At periastron, as discussed in M13, the WWIR apex is inside ηA's He+ region. The fact that ηB is able to ionize an extremely small region close to the centre of the system during periastron means that the dominant source of He i emission at periastron is the inner ηA He+ region. Based on our models, little to no He i emission is expected from the WWIR at and just after periastron.
Just before periastron, the He ii λ4686 line intensity increases suddenly and then drops sharply to zero, after which it recovers to a second peak before declining back to zero (Steiner & Damineli 2004; Martin et al. 2006; Mehner et al. 2011; Teodoro et al. 2012). Based on the density and energy required for the formation of this line, the most plausible region in which it can form during periastron passage is close to the WWIR apex (Martin et al. 2006; Teodoro et al. 2012). Our results support the scenario proposed by M13 in which the He ii λ4686 emission, observed at phases ϕ ∼ 0.98–1.3, is generated in the inner He+ region of ηA's dense wind, with the necessary He+-ionizing photons coming from the radiatively-cooling shocks in the WWIR. Our RT results show that, near periastron, ηB's ionizing flux is unable to produce a significant, extended region of He+ in either the dense pre-shock ηA wind or the densest parts of the WWIR. Even though the unshocked ηB wind remains in the He+ state during periastron, as discussed by e.g. Martin et al. (2006) and Teodoro et al. (2012), the much lower-density ηB wind is incapable of adequately explaining the observed He ii λ4686 emission around periastron. Thus, the only remaining region that can give rise to the observed He ii λ4686 emission is the He+ zone in ηA's dense inner wind.
The sharp drop in He ii λ4686 emission seen near periastron might be caused by a combination of two effects. First, we note that at periastron, the WWIR opening angle decreases considerably due to the much lower wind momentum ratio, caused by a large decrease in the pre-shock velocity of ηB's wind due to the decreased orbital separation and radiative inhibition effects (see Section 3 and M13). At periastron, ηB and the narrowed WWIR are also behind ηA and its optically thick wind (relative to the observer). Thus, ηB and the WWIR are both ‘eclipsed’ by ηA and its dense wind at periastron. Secondly, if the WWIR ‘collapses’ at periastron due to the reduced ηB wind speed (see discussions in e.g. Corcoran et al. 2010; Parkin et al. 2011; M13), the radiatively-cooling WWIR shocks might disappear. If this occurs, the source of He+-ionizing photons (i.e. the soft X-rays generated in the radiative shocks) necessary to produce the He ii emission might also disappear. There would then be no significant He ii emission at periastron. We believe that a combination of a wind-eclipse by ηA and a ‘collapse’ of the WWIR is currently the best scenario for explaining the observed drop in He ii λ4686 emission near periastron.
The Case B simulation results are similar to those of Case A, but with two major differences. The 1D cmfgen models (Hillier et al. 2001, 2006) predict a radius for the inner He+ region, due to ηA ionization, of ∼7 au, more than a factor of 2 larger than in Case A. Even without this larger ionization region, ηB photons are able to ionize the denser primary wind that is expanding into the ηB wind cavity and reach the receding unshocked ηB wind on the apastron side of the system. Qualitatively, we expect these differences to produce variations, compared to Case A, both in the strength and velocity of the He emission and absorption lines. Moreover, the fact that ηB ionizing photons are still able at apastron to reach the periastron side of the system, have important implications on the phases at which these observed features occur. The increase in WWIR opening angle as |$\dot{M}_{\eta _{\mathrm{A}}}$| drops should also alter the timing of when specific He emission and absorption features are observed.
Finally, we wish to comment on one detail not implemented in our 3D simulations that may alter slightly the He ionization structure around periastron. Our current models do not include an ionizing source at the location of ηA. The reasons for this, discussed in Clementel et al. (2014), are related to the complexities of proper spectroscopic modelling of the dense, extended wind photosphere of ηA, which requires inclusion of the many ionization states of metals up to and including iron. However, we note that during periastron passage, ηB and the WWIR penetrate deep within the extended wind of ηA, down into its hotter regions where He is ionized to He+. This ‘bore-hole’ effect has many repercussions for multiwavelength observables (see Madura & Owocki 2010; Groh et al. 2012a,b; Madura et al. 2012b), and it may affect the He ionization structure of the innermost regions of the η Car system as well. This is because the hole created by the WWIR cavity within the innermost ηA wind may provide an escape path for higher-energy photons from ηA. These higher energy ηA photons may be able to escape through the WWIR cavity and help ionize He in portions of the dense arms of the WWIR, and possibly a very thin layer of pre-shock ηA wind located beyond the WWIR. Such an effect would be limited to around periastron and extremely short-lived since the WWIR geometry changes so rapidly. Escaping higher-energy photons from the interior of ηA would only be able to escape in very specific directions and travel a limited distance before the WWIR geometry shifted and shut-off (or changed the direction of) the escaping radiation. Thus, the effect would be limited to the innermost regions. It is also questionable whether such changes to the He ionization structure would even be observable, since the WWIR and bore-hole would be located on the opposite side of ηA and directed away from the observer. More detailed 3D radiation-hydrodynamics simulations are necessary to accurately determine how much this bore-hole effect may alter the inner He ionization structure and affect observations of different He lines.
5 SUMMARY AND CONCLUSION
We presented the ionization structure of helium at periastron in the inner regions of the η Car binary system due to the hot secondary star's ionizing flux and collisional ionization. In our analysis, we considered two different |$\dot{M}_{\eta _{\mathrm{A}}}$|, i.e. Case A (|${\dot{M}_{\eta _{\mathrm{A}}}} = {8.5 \times 10^{-4}}$| M⊙ yr−1) and Case B (|${\dot{M}_{\eta _{\mathrm{A}}}} = {4.8 \times 10^{-4}}$| M⊙ yr−1). We created He ionization maps by post-processing 3D SPH simulations of the η Car system with simplex. Below we summarize our most important results and conclusions.
At periastron, in the Case A simulation, the dense ηA wind expanding into the ηB wind cavity is able to stop ηB's He0+-ionizing photons. Helium is only singly-ionized by ηB in a very thin layer along the WWIR leading arm, and in a very small region close to the stars.
In Case B, the larger WWIR opening angle and lower |$\dot{M}_{\eta _{\mathrm{A}}}$| allow ηB to ionize a region of the lower-density unshocked ηB wind expanding in the apastron direction.
The inner He+ volume due to ηA does not produce relevant differences in the final ionization structures due to ηB in simulation Case A. In Case B, the larger ηA He+ radius allows the ηB ionizing photons to reach deeper into the dense ηA wind and create a lower ionization fraction in the pre-shock primary wind.
Collisional ionization creates He2+ in the hot shock-heated gas in the leading arm of the WWIR and in the adiabatically-cooling remnant of the trailing arm formed just before periastron.
Our RT results support a binary orientation in which apastron is on the observer's side of the system, with the trailing arm of the WWIR sweeping across our LOS as periastron is approached.
The small He+ region at the centre of the system is the main region where He i emission can form during periastron. There is little to no He i absorption at periastron because ηB's ionizing flux is effectively trapped by ηA's dense wind, leading to a lack of dense He+ gas between us and the continuum source ηA. This is consistent with the observed changes in strength and radial velocity of the He i P Cygni lines across periastron.
A lack of any significant He+ in/near the WWIR at periastron, due to ηB, implies that the increased He ii λ4686 emission that is observed around periastron must arise from the inner He+ region in ηA's dense wind. Our results favour a scenario in which a combination of a wind-eclipse by ηA and a ‘collapse’ of the WWIR are responsible for the observed drop in He ii λ4686 emission at periastron.
Our model He-ionization structures at periastron are in qualitative agreement with available observations of η Car's He lines. In the future, we plan to generate synthetic He line profiles for comparison to available observational data in order to place tighter constraints on the orbital, stellar, and wind parameters of η Car. These synthetic spectra, together with those generated for the spectroscopic high state around apastron, will help us better understand the numerous observed spectral features generated in the inner ∼150 au of the system. Our final aim is to use 3D time-dependent radiation-hydrodynamics simulations to more properly follow the ionization and recombination of the gas without post-processing. This is particularly important in the rapidly changing conditions and highly asymmetric situation at periastron.
TIM is supported by an appointment to the NASA Postdoctoral Programme at the Goddard Space Flight Center, administered by Oak Ridge Associated Universities through a contract with NASA.
Of course, this depends on how long it has been since the supply of ionizing photons has been cut off.
