-
PDF
- Split View
-
Views
-
Cite
Cite
Liang Gao, Tom Theuns, Volker Springel, Star-forming filaments in warm dark matter models, Monthly Notices of the Royal Astronomical Society, Volume 450, Issue 1, 11 June 2015, Pages 45–52, https://doi.org/10.1093/mnras/stv643
Close - Share Icon Share
Abstract
We performed a hydrodynamical cosmological simulation of the formation of a Milky Way-like galaxy in a warm dark matter (WDM) cosmology. Smooth and dense filaments, several comoving mega parsec long, form generically above z ∼ 2 in this model. Atomic line cooling allows gas in the centres of these filaments to cool to the base of the cooling function, resulting in a very striking pattern of extended Lyman-limit systems (LLSs). Observations of the correlation function of LLSs might hence provide useful limits on the nature of the dark matter. We argue that the self-shielding of filaments may lead to a thermal instability resulting in star formation. We implement a sub-grid model for this, and find that filaments rather than haloes dominate star formation until z ∼ 6, although this depends on how stars form in WDM. Reionization decreases the gas density in filaments, and the more usual star formation in haloes dominates below z ∼ 6, although star formation in filaments continues until z = 2. 15 per cent of the stars of the z = 0 galaxy formed in filaments. At higher redshift, these stars give galaxies a stringy appearance, which, if observed, might be a strong indication that the dark matter is warm.
INTRODUCTION
The Λ cold dark matter (CDM) model has had tremendous success in providing a cosmogony that links the state of the very high redshift Universe as inferred from cosmic microwave background observations and big bang nucleosynthesis considerations, with the observed large-scale distribution of galaxies and its evolution at later times. In this paradigm, the observed structures grew due to gravitational amplification of initially small perturbations, perhaps seeded by inflation (Guth 1981), with most of the gravitating mass in the form of ‘dark matter’, an as of yet unknown type of matter that apart from gravitationally, interacts only very weakly if at all with baryonic matter and radiation, see e.g. Frenk & White (2012) for a recent review. Observations on smaller, sub galactic scales, have proven more problematic for ΛCDM, with suggestions that the low abundance (e.g. Klypin et al. 1999; Moore et al. 1999) and shallow density profiles (e.g Gilmore et al. 2007; de Vega & Sanchez 2010) inferred for haloes hosting Milky Way satellites are inconsistent with the numerous substructures with cuspy density profiles that form in Milky Way-like CDM haloes. Indeed the substructures in the haloes of the Aquarius project (Springel et al. 2008) and the GHALO project (Stadel et al. 2009) may be difficult to reconcile with those inferred to host Milky Way satellites. Even if many of the smaller DM substructures may not have a sufficiently deep potential well to form stars after reionization (e.g Efstathiou 1992; Benson et al. 2002) and so may well be dark, some of the more massive ones are probably too big to be affected (Okamoto, Gao & Theuns 2008) and would hence appear to be ‘too big to fail’ (Boylan-Kolchin, Bullock & Kaplinghat 2011, 2012). However, the jury on this is still out: the Milky Way's halo may simply be of lower mass than those of the Aquarius haloes and hence have fewer massive satellites (Wang et al. 2012). The status of the density profiles of the satellite's haloes – cored versus cuspy – is similarly unresolved. Strigari, Frenk & White (2010) claim that the stellar dynamics observations of the satellites do not imply cores at all and hence may be consistent with CDM cusps. But even if the satellites had cored profile, this might result from the action of baryonic feedback processes (Governato et al. 2012; Pontzen & Governato 2012), and hence still be consistent with CDM.
Irrespective of these astrophysical considerations, particle physics has several candidates for the dark matter. A popular kind is a super symmetric particle with negligible intrinsic velocity dispersion (Bertone, Hooper & Silk 2005), which would qualify as ‘cold’ DM. However, other viable candidates have considerable intrinsic velocities, and these would constitute ‘warm’ dark matter (WDM), for example a keV scale gravitino or a sterile neutrino (e.g. Dodelson & Widrow 1994). Such intrinsic velocities – as opposed to velocities induced by gravity – have two (related) effects on the formation of structure. First, the motion of WDM particles quenches the growth of structure below a ‘free-streaming scale’, which we loosely define here as the maximum distance over which such a particle can travel. As a consequence, WDM haloes have far less substructures with masses below the corresponding free-streaming mass – potentially alleviating the ‘missing satellites’ problem discussed before (Bode, Ostriker & Turok 2001). Secondly, the intrinsic velocities of WDM particles imply a finite phase-space density – which is conserved during halo growth (e.g. Tremaine & Gunn 1979; Hogan & Dalcanton 2000). This finite phase-space density might be the origin of the cores inferred to exist in Milky Way satellite haloes – if indeed they are cored.
Even though these considerations stimulated much of the astronomical interest in WDM, detailed analyses yielded slightly disappointing results. Shao et al. (2013) demonstrated that – although WDM haloes are indeed cored – cores as large as suggested by Milky Way satellite observations will only form if the WDM free-steaming lengths is so large that the satellites themselves would fail to form, resulting in a ‘too small to succeed’ problem (see also Macciò et al. 2013). Lovell et al. (2012) demonstrated that WDM does help with the satellites’ profiles: since the haloes hosting satellites form later in WDM than in CDM on average, they tend to have lower central densities – alleviating the ‘too big to fail’ problem. Requiring that enough satellites form leads to a conservative lower limit to the (thermal equivalent) WDM particle mass of 1.5 keV (Lovell et al. 2013), not far from the lower limits inferred from the Lyα forest by Boyarsky et al. (2009). Consequently there is still a window for WDM to have some effect on galaxy formation, although it seems that by itself it will not resolve the issues with the ‘too big to fail’ problem, and the alleged presence of cores in satellite haloes.
The study of Gao & Theuns (2007) points out that the formation of the first stars could proceed very differently in a WDM Universe. The reason is that the filaments that form naturally in hierarchical models have potential wells that are so deep that gas in them forms molecular hydrogen and cools. Such filaments also form in CDM, yet there they break up into star-forming mini haloes due to CDM's small-scale power. Numerical fragmentation who's origin is discussed by Wang & White (2007) prevented Gao & Theuns (2007) from making firm predictions about the nature of first star formation in WDM, but they argue that star formation may be very efficient and result in a range of stellar masses, which is quite different from the inefficient formation of a ‘single’ massive star expected to form in CDM mini haloes (e.g. Abel, Bryan & Norman 2002).
Here, we present results from zoomed cosmological hydrodynamical simulations that follow the formation of a Milky Way-like galaxy in WDM. In particular, we want to test whether the filaments that form around such objects could host star formation initiated by atomic line cooling, which would be the galaxy formation analogue of first star formation in WDM discussed by Gao & Theuns (2007). We introduce the simulations in Section 2 and present our results in Section 3; Section 4 summarizes.
ZOOMED SIMULATIONS OF THE FORMATION OF A GALAXY IN WDM: SET-UP
Our simulations were performed with gadget-3, a Tree plus smoothed particle hydrodynamics (SPH; Gingold & Monaghan 1977; Lucy 1977, see e.g. Springel 2010 for a recent review) code based on gadget-2 last described by Springel (2005). We include gas cooling and photo-heating of optically thin primordial gas in the presence of an imposed UV/X-ray background from Haardt & Madau (1996), under the assumption of collisional ionization equilibrium as in Katz, Weinberg & Hernquist (1996). We assume H i reionization occurs at redshift z = 6. We do not include a model for molecular hydrogen formation and hence neglect effects of ‘first stars’. The halo we simulate is ‘halo A’ from the Aquarius project (Springel et al. 2008), and the assumed cosmological parameters (Ωm = 0.25, ΩΛ = 0.75, σ8 = 0.9 and h = 0.73) are taken from that paper.
Using a zoomed technique, the formation of structure in a box of 100h−1 comoving mega parsecs on a side is followed by massive dark matter particles, with the proto-halo itself represented by much lower mass particles with masses of 2.4 × 10⁵ h−1 M⊙ and 5.2 × 10⁴ h−1 M⊙, for dark matter and gas, respectively. Basic parameters of our simulation are provided in Table 1.
Basic parameters of our numerical simulation. MDM is the dark matter particle mass, MGAS the SPH particle mass; ϵ is the comoving softening length.
| MDM ( h−1 M⊙) . | MGAS ( h−1 M⊙) . | ϵ ( h−1 kpc) . |
|---|---|---|
| 2.35 × 10⁵ | 5.16 × 10⁴ | 0.5 |
| MDM ( h−1 M⊙) . | MGAS ( h−1 M⊙) . | ϵ ( h−1 kpc) . |
|---|---|---|
| 2.35 × 10⁵ | 5.16 × 10⁴ | 0.5 |
The WDM linear power-spectrum is calculated by exponentially truncating the corresponding CDM power below a free-streaming scale that corresponds to that of a 1.5 keV equivalent thermal relic particle. Such an exponential truncation of the power spectrum does not do justice to the real underlying physics of WDM, but the effects on galaxy formation discussed here will nevertheless be quite generic. We use the same random phases for initializing the Gaussian field as for Aq-A, allowing a straightforward comparison between the CDM and WDM runs. In order to illustrate differences in CDM and WDM model, we have repeated the simulation for the case of CDM.
The main objective of this exploratory study is to investigate whether in a WDM model star formation is likely to occur in filaments around young galaxies. Unfortunately it is unclear which physical conditions are required for this. In galaxies, stars form in molecular clouds which themselves are thought to result from disc instabilities. A prerequisite for this to happen is that gas self-shields from the UV background allowing it to cool radiatively, as in the model of Schaye (2004). We implement this by specifying a density threshold above which gas (i.e. SPH) particles are converted to stars. For this to happen, we require that the physical hydrogen density nH > 0.1 cm−3 and that the over density |$\rho /\bar{\rho }>2000$|.1 Hydrodynamical simulations with radiative transfer applied in post-processing (e.g. Altay et al. 2011; Rahmati et al. 2013) show that cosmic gas turns mostly neutral above such a threshold. These radiative transfer calculations apply to CDM – but the same physics should of course apply to the WDM case as well. A more physical description should consider the instability of the (nearly) one-dimensional filament (Inutsuka & Miyama 1997), but our simulation lacks the physics and resolution to warrant a more detailed star formation description. For the same reason, we neglect feedback processes in this study.
In CDM galaxy formation simulations, the rate at which galaxies form stars is in fact mostly set by their feedback efficiency rather than by the assumed star formation rate itself, as explicitly demonstrated using the owls simulations by Haas et al. (2013a,b). The reason for this is that star formation is self-regulating, at least in these models (Schaye et al. 2010). In the present calculations, we do not include any feedback from forming stars, and that is of course a concern. Our motivation is that we wish to examine whether stars form at all. In addition, the feedback descriptions in use are tuned to CDM, and may need to be modified before being applied to star formation in filaments.
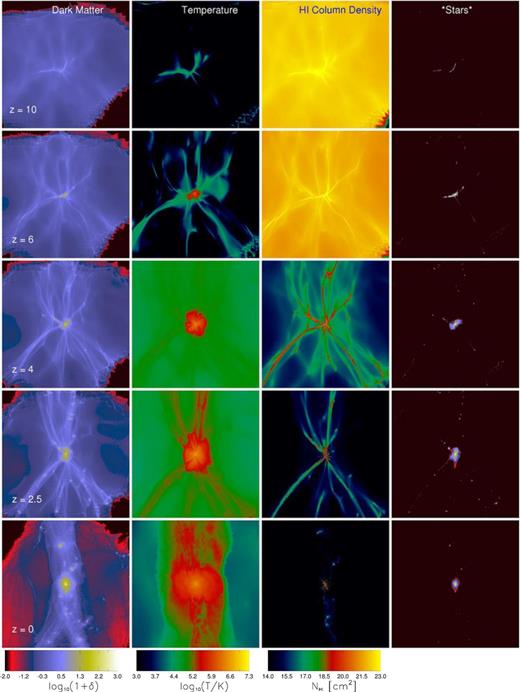
A visual impression of the formation of a galaxy in WDM is presented in Fig. 1. Numerous smooth filaments dominate the z > 2.5 dark matter density field, each containing a considerable amount of gas. In the highest redshift, z = 10, snapshot (top row), the halo itself has only barely started to form, yet the formation of the filaments is already well advanced. Gas in the filaments is compressed, cools, reaches the threshold for star formation, and is converted to stars, producing the very filamentary ‘galaxy’ seen in the top right panel. Given our simplified star formation recipe, we find that there is more star formation in filaments than in haloes up to redshift z = 6. At this stage, the simulated gas is assumed to become reionized, and the photo-heating of the gas to temperatures T ∼ 104 K decreases its density in filaments, suppressing star formation. Since we do not perform radiative transfer, the photo-heating of filaments is overestimated as in reality they are self-shielded, hence we may have underestimated how many stars would form in the filaments.
Image of the galaxy forming in the Aquarius-A simulation in a warm dark matter Universe, shown at various redshifts (different rows, redshifts are indicated in the left-hand panels). From left to right, different panels indicate the dark matter over density, gas temperature, hydrogen column density, and the density of stars, respectively; each panel is 4 comoving h−1Mpc across. The panels are centred on the galaxy, and colour bars are presented for the left three columns. The big filaments visible in dark matter and gas are very striking, as time progresses they become fewer in number but continue to dominate the visual impression. Artificial fragmentation is visible in the dark matter, but is less pronounced in the gas. Gas shock heats into the filaments, partially cools, and drains into the main galaxy. The density map of stars (right-hand column) is normalized separately for each redshift, to bring out the formation of stars in the filaments.
At and below z = 4 (bottom three rows), the formation of the halo itself has caught up, leading to the appearance of a shock-heated halo of gas, some of which cools to form the main galaxy – the more familiar mode of galaxy formation in CDM. In the z = 2.5 and z = 4 snapshots, several high column density filaments (NH > 1017–1020 cm−2) extend over the full 4 h−1 mega parsecs of the panels, star formation is now mostly inside the main halo, with remaining low levels of star formation in the filaments. At z = 0 (bottom row), dark matter filamentary structure around the main halo is still very pronounced, and the halo and two main filaments visible in the image contain hot, T ∼ 106 K, gas. Stars are overwhelmingly inside the main galaxy, with several smaller satellites visible inside the filaments. Throughout the simulation, artificial fragmentation of the dark matter in filaments (Wang & White 2007) is visible.
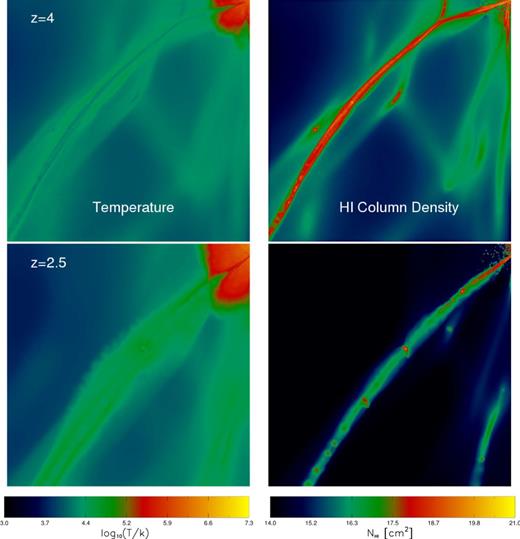
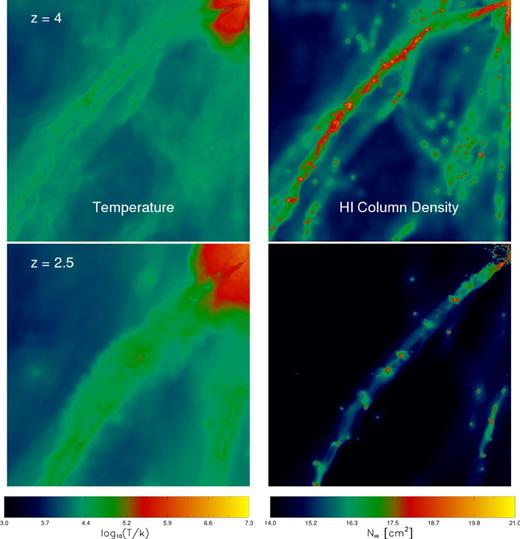
In Fig. 2, we zoom in closer to the galaxy in WDM. A very dense, cold filament is seen to extent over the full 1.5 h−1 comoving mega parsecs extent of the plot. It is dense enough that when it penetrates the halo of the forming galaxy (top right in each of the panels) it remains cold, T ∼ 104 K, near the base of the cooling function in the absence of metals or molecules. The lower z = 2.5 redshift filament is thicker and slightly hotter, with hydrogen column ∼1017 cm−2. It contains a number of higher column fragments, which may result from artificial fragmentation in the underlying dark matter. A direct comparison of the structure around the galaxy in CDM is possible by comparing to Fig. 3 in which we show the CDM version of the same plot. As expected, the filaments in CDM are much less smooth and break up in small clumps, an effect most striking at the higher z, where the WDM filaments are far denser and smoother.
Zoomed-in temperature (left-hand panels) and (total) hydrogen column density plots (right-hand panels) near the forming galaxy (the dense and hot structure on the top right of each panel) at z = 4 (top row) and z = 2.5 (bottom row). Each panel is 1.5h−1 comoving Mpc on a side. At z = 4, the filament has very high column, ≳1020 cm−2, and is so dense that the gas cools towards the centre. As this cold gas penetrates the hot halo of the forming galaxy, it remains mostly cool. The lower z filament is wider and less dense, with some substructure that may be a consequence of artificial fragmentation of the underlying dark matter.
Temperature and density around the galaxy at redshift z = 4 (top panels) and z = 2.5 ( bottom panels) in the CDM case. Compare with Fig. 2 for the corresponding WDM case.
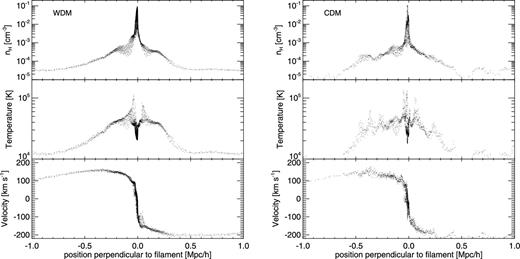
We select a small section of a filament in WDM at z = 2.5 of length 2 h−1 comoving kilo parsecs and rotate it so that its long axis lies along the x-axis. We then plot density, temperature and velocity of each SPH particle in the segment against perpendicular distance from the centre of the filament (left-hand panel of Fig. 4). Gas accretes on to this filament at speeds ∼150 km s−1, shock heats, then cools radiatively to the base of our cooling curve, as it collapses to the centre. As it reaches a (hydrogen number) density of ≳ 0.1 cm−3, we convert it to stars. Although one might question the simple star formation criterion, we employ here, or criticize the fact that our filaments fragment artificially, the fact that gas accretes on to WDM filaments and is able to cool to high densities through atomic line cooling before accreting on to a halo, is unambiguously demonstrated by Figs 1–4.
Left-hand panel: hydrogen gas number density, temperature and velocity of SPH particles ( top to bottom) as function of distance to a WDM filament around a Mily Way-like progenitor galaxy at redshift z = 4. Cold gas, T ∼ 104 K, accretes on to the filament with velocities of ∼150 km s−1, shocks to temperatures of ∼104.5–105 K and densities nH ∼ 5 × 10⁴ − 10−3 cm−3 at 100 h−1 kpc from the centre of the filament, cools radiatively and gets compressed to T ∼ 2 × 10⁴ K and nH > 0.1 cm−3. Above this density our star formation algorithm converts gas to stars. Right-hand panel: same plot as the left-hand panel but for the CDM simulation.
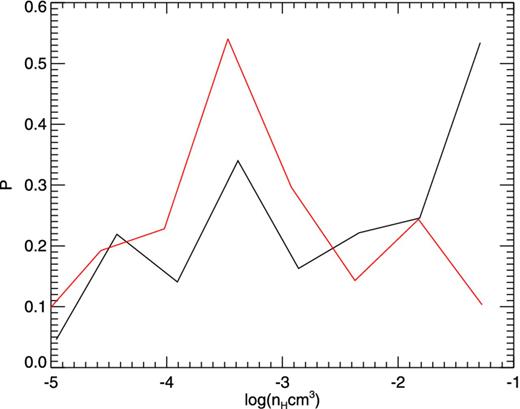
In the right-hand panel of Fig. 4, we show a matched plot to the left-hand panel but for the CDM case. Comparing to WDM, the CDM filament has more complex structure presumably arising from small-scale density fluctuation imprinted in the CDM initial condition. The gas density histogram of the same set of SPH particles is shown in Fig. 5. The WDM filament apparently has more SPH particles distributed in the high density regime, consistent with the appearance from the Figs 2 and 3.
Comparison of gas density histogram of SPH particles shown in the Fig. 4. The red solid line is for the CDM simulation, while the black sold line is for the WDM run.
What is the fate of this gas? If the filament's column density is high enough, |$N_{\rm H\,{{\small i}}}\gtrsim 10^{17}$| cm−2, it will self-shield from the UV-background. Clearly the filaments around the Aq-A WDM galaxy are (far) above this threshold. In our simulations, this gas becomes self-gravitating, and cools and collapses as far as we allow it to. We speculate that if we were to include molecular hydrogen formation, the gas would continue to cool further. The situation is then very similar to that discussed by Gao & Theuns (2007) in the context of first star formation in WDM.
Our simulated WDM filaments currently fragment artificially therefore it would be unwise to over interpret their fate. In reality, perturbations are seeded by the finite size of the filaments, i.e. by the tidal field around them, because of the absence of small-scale structure in WDM. Perturbations started on these large scales can propagate into the filament and potentially make them unstable. The stability of gaseous filaments been investigated in the context of the formation of cloud cores (e.g. Larson 1985; Inutsuka & Miyama 1997), and the basic physics should still apply: if the growth rate of perturbations is higher than the collapse rate of the filament as a whole, the gas will fragment. Determining the growth rate requires much more detailed simulations that include the chemistry of molecule formation and its impact on cooling – and importantly avoid artificial fragmentation; we leave this to future work. Nevertheless, we think it is likely that filaments will fragment into clouds that eventually form stars at sufficiently high redshift, z ≳ 2 say for 1.5 keV thermal equivalent WDM particles. At lower z, these stars accrete on to the main galaxy.
Although we have concentrated on star formation, the high column density of the filaments in WDM above z = 2 say, and their remarkable uniformity and extent are very striking. Such structures would be detectable in absorption as Lyman-limit (LLS) or Damped Lyman α systems (DLAs). It would be worth exploring if their properties are sufficiently different from the LLS and DLAs that form in CDM that we could distinguish the WDM-type models discussed here from CDM. In particular, we expect the autocorrelation function of LLS to be significantly different between CDM and WDM.
We can speculate about the fraction of stars that forms in filaments in WDM versus in the main galaxy, but we caution that this is necessarily uncertain given our simplified star formation implementation and even more importantly our neglect of feedback. Traditionally, the dark matter and stellar distribution of a simulation is dissected in ‘haloes’ – defined by linking close enough particles together in a friends-of-friends (FOF) halo (Davis et al. 1985) to select nearly spherical regions within which the density is ∼200 times the critical density. In Wdm models, this dissection does not work properly because FOF will select not just the halo but most of the surrounding filament as well. We therefore run a spherical over density algorithm (hereafter denoted SO) centred at the location of the most bound FOF particle to define the halo instead as a spherical region within which the mean density is ∼200 times the critical density. At high z ≳ 7 say, this assigns most of the mass that eventually ends up in the z = 0 object to filaments – consistent with the visual appearance from Fig. 1. We can now distinguish between stars inside and outside the SO. We will refer to the most massive SO as the progenitor of the z = 0 galaxy.
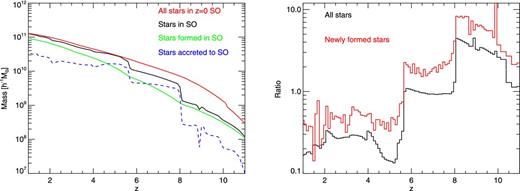
How the z = 0 galaxy is build up of stars formed in its main progenitor, and stars formed in filaments, is illustrated in Fig. 5, left-hand panel. The red curve is the total mass of stars formed up to redshift z, that are inside the SO galaxy at z = 0. The black curve is the mass of the SO galaxy at redshift z – which is much less than the red curve above z = 6 because most stars are still in filaments at this early time. The green and dashed-blue curve are the stellar masses of the SO galaxy that formed in situ (green), or were accreted on to the SO (dashed blue). The black line in the right-hand panel is the ratio of stellar mass outside the SO galaxy to mass inside the SO galaxy, for stars that are in the galaxy at z = 0. The red line shows this ratio for stars that formed recently – in the small redshift bins indicated in the panel. We see that star formation is higher in filaments than in the SO galaxy above z = 6 – by up to a factor of 10. Two large accretion events (at z ∼ 6 and z ∼ 8) drain filament stars into the SO galaxy, and by z ∼ 6 the mass in the SO galaxy becomes comparable to the mass of stars in filaments.
Fig. 6 quantitatively confirms the visual impression from Figs 1–3, that star and galaxy formation is dominated by filaments in the WDM model, of this particular galaxy before z = 6. Star formation in filaments accounts for ∼3 × 10¹⁰ h−1 M⊙ of stellar mass by z = 0, or 15 per cent of the ∼2 × 10¹¹ h−1 M⊙ of the final galaxy.
Star formation history of the Aq-A galaxy in warm dark matter. Left-hand panel: the stellar mass formed up to redshift z that resides in the spherical over density (SO) galaxy at z = 0 is shown as the red line, the stellar mass that already resides in the SO's progenitor at redshift z is shown as the black line. Above z ∼ 6, the red line is far above the black line because most stars are in filaments. The stellar mass indicated by the black line is the sum of the green mass – stars formed in the SO, and the dashed blue line – stars accreted to the SO. Right-hand panel: ratio of all stars (black line) and newly formed stars (red line), outside the main halo to those in the main halo, as a function of redshift. The red line is above one for z > 6, again showing that early on most stars form in filaments, and star formation in filaments continues to at least z = 1. The black line is also mostly above one for z > 6, meaning that most stars also reside in filaments at z > 6.
SUMMARY AND DISCUSSION
We have performed cosmological hydrodynamical simulations of the formation of a Milky Way-like galaxy in a WDM scenario. The model we investigate uses a CDM transfer function exponentially cut-off below the free-streaming scale of a WDM particle which is equivalent to that of a 1.5 keV thermal relic. The simulation includes radiative cooling from hydrogen and helium, inverse Compton cooling off the CMB, and thermal bremsstrahlung, in the presence of an imposed uniform optically thin UV/X-ray background, but ignores cooling from metals and from molecules. The simulation uses a very simple sub-grid model for star formation and neglects feedback from star formation. We examined to what extent star formation in the dense filaments that are characteristic for this WDM model contributes to the final redshift z = 0 stellar mass and its build-up.
At very high redshifts, z ≳ 8 say, dense and extended filaments several comoving mega parsecs long, form before dark matter haloes themselves appear. Gas in those filaments is cold (T ∼ 104 K, the base of the cooling function in the absence of metals and molecules) and dense (nH ≳ 0.1 cm−3) enough to form stars in our sub-grid model for star formation. Filaments continue to dominate star formation, with gas accreting on to them at high speed (∼150 km s−1), where it shock heats and subsequently cools radiatively through atomic line cooling. The column density of gas through these filaments is very high (≳ 1018 cm−2), and the presence of very long and narrow LLSs in WDM is very striking. It might be possible to test observationally for the presence or absence of such WDM filamentary LLS, for example by studying the LLS correlation function, and hence constrain the nature of the dark matter particle. Stars formed in filaments drain in haloes. Reionization – in these simulations assumed to occur at z = 6 – causes the gas density in filaments to decrease, and star formation in haloes starts to dominate; however, stars continue to form in filaments until z ∼ 2, after which their column density drops below the threshold for star formation. By z = 0, 15 per cent of stars in the final galaxy formed in filaments.
We stressed that there is no accepted theory of how stars form in filaments, nor has it been investigated if and how star formation in filaments is regulated by feedback. In addition, our simulation suffers from the well-known artificial fragmentation of the dark matter. Consequently, we are hesitant to draw quantitative conclusions from this run. However, what the simulation demonstrates unambiguously is that in this WDM model, very long and dense filaments form around Milky Way-like proto-galaxies, which would be observable as LLS or DLAs. Gas in these filaments cools radiatively through atomic line cooling, and can shield itself from the UV-background. The thermal instability that results from this is likely to lead to star formation, even at lower redshifts z ∼ 2. In the simulation, this results in the appearance of curiously shaped stringy ‘chain’ galaxies, which, if observed, might be a strong indication that the dark matter is warm.
The simulations used in this work were carried out on the Lenova Deepcomp7000 supercomputer of the super Computing Centre of Chinese Academy of Sciences, Beijing, China. LG acknowledges support from the NSFC grant (Nos 11133003,11425312), the Strategic Priority Research Program ‘The Emergence of Cosmological Structure’ of the Chinese Academy of Sciences (No. XDB09000000), MPG partner Group family, and an STFC Advanced Fellowship, as well as the hospitality of the Institute for Computational Cosmology at Durham University. VS acknowledges support by the European Research Council under ERC-StG grant EXAGAL-308037. This work was supported by the Science and Technology Facilities Council [grant number ST/F001166/1] and by the Interuniversity Attraction Poles Programme initiated by the Belgian Science Policy Office ([AP P7/08 CHARM]). It used the DiRAC Data Centric system at Durham University, operated by the Institute for Computational Cosmology on behalf of the STFC DiRAC HPC Facility (www.dirac.ac.uk). This equipment was funded by BIS National E-infrastructure capital grant ST/K00042X/1, STFC capital grant ST/H008519/1, STFC DiRAC Operations grant ST/K003267/1 and Durham University. DiRAC is part of the National E-Infrastructure. The data used in the work are available through collaboration with the authors.
We have used a higher density threshold nH > 5 cm−3 for the star formation, and re-run our simulation to redshift 6, the results are qualitatively similar to what we present below (see appendix).
REFERENCES
APPENDIX A:
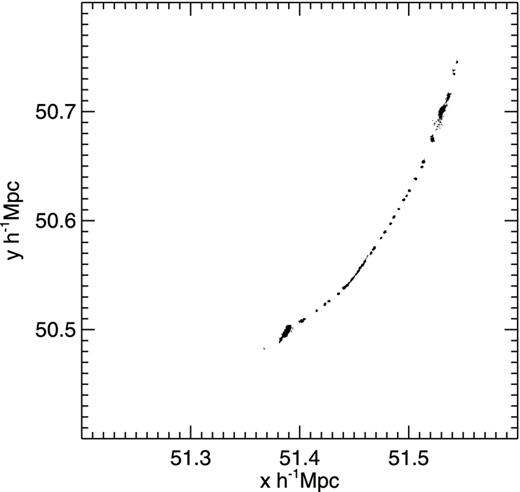
We have re-run our WDM simulation to redshift z = 6 by adopting a higher density threshold nh = 5/cm3 for the star formation. The result is qualitatively similar to our previous one, namely star formation still occur in WDM filaments. Of course, the exact amount of stars formed at given epoch is lower as we expected. As an example, in Fig. A1, we show positions of all star particles formed in a filament of our new simulation at z = 10.
Positions of star particles in a filament of our new simulation at z = 10.


