


Abstract
SDSS J0015+0104 is the lowest metallicity low surface brightness dwarf (LSBD) galaxy known. The oxygen abundance in its H ii region SDSS J001520.70+010436.9 (at ∼1.5 kpc from the galaxy centre) is 12+log (O/H) = 7.07 (Guseva et al.). This galaxy, at the distance of 28.4 Mpc, appears to reside deeply in the volume devoid of luminous massive galaxies, known as the Eridanus void. SDSS J235437.29−000501.6 is another Eridanus void LSBD galaxy, with parameter 12+log (O/H) = 7.36 (also Guseva et al.). We present the results of their H i observations with the Nançay Radio Telescope revealing their high ratios of M(H i)/LB ∼ 2.3. Based on the Sloan Digital Sky Survey images, we derived for both galaxies their radial surface brightness profiles and the main photometric parameters. Their colours and total magnitudes are used to estimate the galaxy stellar mass and ages. The related gas mass fractions, fg ∼ 0.98 and ∼0.97, and the extremely low metallicities (much lower than for their more typical counterparts with the same luminosity) indicate their unevolved status. We compare these Eridanus void LSBDs with several extreme LSBD galaxies residing in the nearby Lynx–Cancer void. Based on the combination of all their unusual properties, the two discussed LSBD galaxies are similar to the unusual LSBDs residing in the closer void. This finding presents additional evidence for the existence in voids of a sizeable fraction of low-mass unevolved galaxies. Their dedicated search might result in the substantial increase of the number of such objects in the local Universe and in the advancement of understanding their nature.
1 INTRODUCTION
The modern cosmological cold dark matter (CDM) models of the large-scale structure and galaxy formation, including the state-of-the-art N-body simulations, predict that galaxy properties and evolution can significantly depend on their global environment (e.g. Peebles 2001; Gottlöber et al. 2003; Hoeft et al. 2006; Hahn et al. 2007, 2009; Hoeft & Gottlöber 2010; Kreckel, Joung & Cen 2011b, and references therein). However, the role of the most rarefied environment (typical of voids) in galaxy formation and evolution is not well studied both theoretically and observationally.
The Lynx–Cancer void, one of the nearest, is situated in the sky region well covered by the Sloan Digital Sky Survey (SDSS). In Pustilnik & Tepliakova (2011, hereafter Paper I), we described this void and the sample of 79 galaxies residing inside it. Their absolute magnitudes MB range from −12.0 to −18.4 with the median value of −14.0. In Pustilnik, Tepliakova & Kniazev (2011a, hereafter Paper II), we presented the results of their gas metallicity study.
In course of systematic study of dwarf galaxies in the Lynx–Cancer void, we have already discovered half-dozen unusual objects, including DDO 68 (Pustilnik, Kniazev & Pramskij 2005; Izotov & Thuan 2007; Pustilnik, Tepliakova & Kniazev 2008), J0926+3343 (Pustilnik et al. 2010) and other very metal poor low surface brightness dwarfs (LSBDs; Pustilnik et al. 2011b, hereafter Paper III). The recent Giant Metrewave Radio Telescope (GMRT) mapping of a subsample of this void galaxies revealed two extremely gas-rich blue dwarfs (Chengalur & Pustilnik 2013). In total, ∼10 per cent of the void dwarfs show very unusual properties. They are very gas rich LSBDs with values of O/H which are several times lower than expected for their LB from the relation ‘O/H versus LB’ for a denser environment in the Local Volume (e.g. van Zee & Haynes 2006). Some of them have rather blue colours of outer parts that correspond to ages of their main stellar population of T ∼ 1–4 Gyr. The high concentration of unusual, ‘unevolved’ dwarfs in this void is a clear indication on the importance of void conditions for the slow galaxy evolution and/or for the retarded galaxy and star formation (SF).
Recently Guseva et al. (2009) presented, among other new metal-poor galaxies, the second most metal-poor galaxy SDSS J0015+0104, with 12+log (O/H) = 7.07. This is a bona fide LSBD with a single faint H ii region on the edge of the optical body. For comparison, in the record-holder dIrr galaxy SBS 0335−052W this parameter varies a little along the galaxy body around ∼7.0 (Izotov et al. 2009). We present here new H i observations of J0015+0104 and the analysis of its SDSS u, g, r, i images along with the examination of its large-scale environment. This LSBD appears to reside in a large region devoid of luminous galaxies, known as the Eridanus void. We therefore compare its properties with those of several of the most metal-poor LSBD galaxies in the Lynx–Cancer void. We present also the similar study of another very metal poor dwarf in the Eridanus void, SDSS J2354−0005. The paper is organized as follows. In Section 2, we briefly describe observations and reduction of obtained data. Section 3 presents the results of observations and their analysis. In Section 4, we discuss the results and their implications in a broader context and summarize our conclusions.
2 OBSERVATIONS AND DATA REDUCTION
2.1 H i observations
H i observations with the Nançay1 Radio Telescope (NRT) with a collecting area of 200 × 34.5 m2 are characterized by a half-power beam width of 3.7 arcmin (east–west) × 22 arcmin (north–south) at declination δ = 0° (see also http://www.obs-nancay.fr/nrt). The data were acquired during 2011 June– 2012 February, with the total time on-source of ∼140 min for J0015+0104 and ∼110 min for J2354−0005. We used the antenna/receiver system FORT (e.g. Martin et al. 2002). The system temperature was ∼35 K for the two circular polarization outputs of the receiver. The gain of the telescope was 1.5 K Jy−1 at declination δ = 0°. The 8192-channel correlator was used covering the total bandwidth of 12.5 MHz. The total velocity range covered was about 2700 km s−1, with the channel spacing of 1.3 km s−1 before smoothing. For more details on the NRT observations, see the description in the paper by Pustilnik & Martin (2007).
The left and right polarization spectra were calibrated and processed independently and then averaged together. The error estimates were calculated following Schneider et al. (1986). The baseline was well fitted by a third-order or lower polynomial and was subtracted out. The NRT full width at half-maximum = 22 arcmin corresponds to angular distances of ±11 arcmin in the NS direction. At distances of the target LSBDs of ∼30 Mpc, this corresponds to linear separations of ∼100 kpc. No potential confusing neighbours were found within the NRT beam.
2.2 Imaging data from the SDSS
The SDSS (York et al. 2000) is well suited for photometric studies of various galaxy samples due to its homogeneity, area coverage and depth (SDSS Project Book2). SDSS is an imaging and spectroscopic survey that covers about one-quarter of the celestial sphere. The imaging data are collected in drift scan mode in five bandpasses (u, g, r, i and z; Fukujita et al. 1996) using mosaic CCD camera (Gunn et al. 1998). An automated image-processing system detects astronomical sources and measures their photometric and astrometric properties (Lupton et al. 2001; Smith et al. 2002; Pier et al. 2003) and identifies candidates for multi-fibre spectroscopy. At the same time, the pipeline-reduced SDSS data can be used for making one's own photometry (e.g. Kniazev et al. 2004) any project needs. For our current study the images in the respective filters were retrieved from the SDSS Data Release 7 (Abazajian et al. 2009). The respective finding charts with the field size of ∼40 arcsec are shown in Fig. 1.
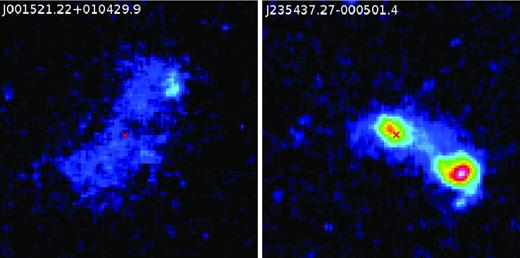
Left-hand panel: the g-filter image of SDSS J0015+0104 in conditional colours, centred at the geometrical centre of the LSB body, marked by cross. The total size of the field is ∼40 arcsec by ∼40 arcsec. North is up, east is to the right. Right-hand panel: the similar image of SDSS J2354−0005. The neighbouring object at ∼10 arcsec to SW is a background galaxy with redshift of ∼0.165 (Guseva et al. 2009). It was masked in making surface photometry of the studied galaxy.
Since the SDSS provides users with the fully reduced images, the only additional step we needed to perform (apart the photometry in round apertures) was the background subtraction. For this, all bright stars were removed from the images. After that, the studied object was masked and the background level within this mask was approximated with the package aip from midas. In more detail the method and the related programs are described in Kniazev et al. (2004). To transform instrumental fluxes in apertures to stellar magnitudes, we used the photometric system coefficients defined in SDSS for the used fields. The accuracy of zero-point determination was ∼0.01 mag in all filters.
3 RESULTS
3.1 H i parameters
The profiles of the 21 cm H i-line emission at positions of SDSS J0015+0104 and J2354−0005 obtained with the NRT are shown in Fig. 2. The high S-to-N ratio narrow H i profile of J0015+0104 looks as a simple Gaussian and its parameters are determined rather straightforwardly. Its integrated H i-line flux F(H i) = 0.81 ± 0.04 Jy km s−1. The central velocity of the profile is 2035 ± 3 km s−1 (in comparison to the SDSS emission-line value for the NW H ii region Vopt = 2066 ± 64). The profile widths are W50 = 21.2 ± 2 km s−1 and W20 = 29.4 ± 3 km s−1.
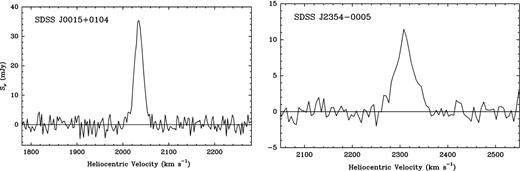
The NRT profiles of H i-line emission in galaxies SDSS J0015+0104 and SDSS J2354−0005. The X-axis shows radial heliocentric velocity in km s−1. The Y-axis shows the galaxy flux density in mJy.
For SDSS J2354−0005, the profile is broader and its S-to-N ratio is lower. Its integrated H i-line flux F(H i) = 0.50 ± 0.04 Jy km s−1. The parameter W50 = 38.5 ± 7.3 km s−1. The central velocity of the H i peak (2310 ± 4 km s−1) is very close to the SDSS optical velocity of Vopt = 2311 km s−1 and the independent similar value of Guseva et al. (2009).
To estimate the galaxies’ global parameters, we adopted the distance D = 28.4 Mpc for J0015+0104. This is based on the NASA/IPAC Extragalactic Database (NED) value with the Hubble constant of 73 km s−1 Mpc−1, with the Virgo infall model, and with correction down by 0.4 Mpc, accounting for the difference between the NED Vhel = 2066 ± 64 km s−1 and a new one of better accuracy, derived from our H i profile. Similarly, for J2354−0005, we adopted the distance D = 32.1 Mpc. The respective scales are 138 and 156 pc in 1 arcsec. The H i mass of the galaxies is determined by the well-known relation for optically thin H i-line emission from Roberts (1969). This gives M(H i) = (1.82 ± 0.15) × 108 M⊙ for J0015+0104 and (1.22 ± 0.11) × 108 M⊙ for J2354−0005.
3.2 Photometric properties and the age estimates
To construct surface brightness (SB) profiles, we adopted a geometrical centre for each galaxy as determined by eye and measured values for concentric round apertures. The centre of J0015+0105 is situated ∼10 arcsec SE from the position of the edge H ii region catalogued as the SDSS emission-line galaxy and whose spectrum was taken in Guseva et al. (2009). Similarly, for J2354−0005, the centre for round apertures was put at ∼1 arcsec SW from the position of the emission knot, catalogued as the SDSS galaxy with the respective emission-line redshift. From the SB radial profiles in the g filter and the colour (g − r) shown in Fig. 3, one can derive the ‘mean’ colour of the underlying ‘disc’ (excluding outer parts with large noisy deviations). For the J0015+0104 region within R =15 arcsec, this mean (g − r) = ∼0.15. Using the transformation formula of Lupton et al. (2005), this translates to the relation μB = μg+0.27 mag arcsec−2. Then, from the galaxy SB profile in the g filter, the ‘optical’ radius Ropt at μB = 25 mag arcsec−2 and the Holmberg radius RHol at μB = 26.5 mag arcsec−2 are Ropt, eff = 6.4 arcsec and RHol, eff = 12.4 arcsec. To transform these effective radii to real ones, the correction factor (b/a)−1/2 = 1.17 should be applied, where the galaxy axial ratio b/a = 0.73 was adopted from our photometry. This results in the ‘optical’ radius of Ropt = 7.5 arcsec (∼1.03 kpc) and in the ‘Holmberg’ radius of RHol = 14.5 arcsec (∼2.0 kpc). Similar estimates for J2354−00005 with the ‘mean’ (g − r) = ∼0.10 result in Ropt, eff = 5.0 arcsec and RHol, eff = 8.7 arcsec, and transforming them to the real values gives Ropt = 6.7 arcsec (∼1.04 kpc) and RHol = 11.6 arcsec (∼1.8 kpc).
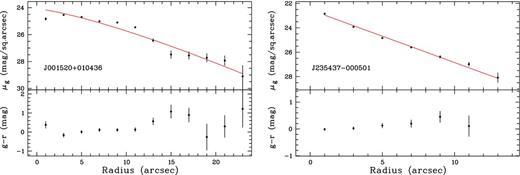
Left-hand panel: the SB in the g filter and g − r colour of SDSS J0015+0104 versus the effective radius. The solid lines show the Sérsic model fit on the profile part with <23 arcsec with exclusion of the very central depression and two points at R = 9 and 11 arcsec as clearly related to the light of the superimposed H ii region. Right-hand panel: same for galaxy SDSS J2354−0005.
From the above fits (for the internal regions with R <12 arcsec for J0015+0104 and with 2 <R < 12 arcsec for J2354−0005, excluding the central SF knot), we also estimated the central SB. For J0015+0104, the best fits are for g and r filters, which give |$\mu _{g}^0$| = 24.04 and |$\mu _{r}^0$| = 24.40 mag arcsec−2 with the scalelength of 7.3 arcsec, which corresponds to the linear scalelength of 1.01 kpc. When corrected for (b/a)−1/2, this gives the radial disc scalelength of 1.18 kpc. For J2354−0005, the similar best fits for g and r filters give |$\mu _{g}^0$| = 22.85 and |$\mu _{r}^0$| = 22.75 mag arcsec−2, with the scalelength of 2.7 arcsec, which corresponds to the linear scalelength of 0.42 kpc. When corrected for (b/a)−1/2, this gives the radial disc scalelength of 0.56 kpc. With the same magnitude transform as above, we derive the observed central blue SB of both galaxies: |$\mu _{\rm B}^0$| = 24.14 and 22.87 mag arcsec−2 (after corrections for AB = 0.11 and 0.14 according to Schlegel et al. 1998). Due to the galaxy disc inclination, their observed central SB are somewhat enhanced. We correct the latter values, taking the visible axial ratios p = b/a = 0.73 and 0.56, and adopting the internal axial ratio q =0.20. The respective inclination angles i, derived from the well-known formula: cos (i)2 = (p2 − q2)/(1 − q2), are i =45|${^{\circ}_{.}}$|1 and 57|${^{\circ}_{.}}$|5, respectively. The respective corrections for |$\mu _{\rm B}^0$| are equal to 0.33 and 0.68 mag arcsec−2. Thus, the central SB corrected for inclination appear as follows: μB, 0, c, i = 24.47 and 23.55 mag arcsec−2, and both objects should be classified as genuine ‘low surface brightness’ galaxies.
The measured gtot magnitudes and respective colours (u − g), (g − r) and (r − i) for the whole galaxies and the derived Btot as well as the axial ratio b/a are given in the upper part of Table 1. In the middle part, we give the derived central SB in g and r filters, the respective central brightness in B, transformed according to Lupton at al. (2006), and this parameter corrected for the Milky Way extinction (Schlegel, Finkbeiner & Douglas 1998) and inclination. Also the model fit parameters for the g filter are included: the Sérsic profile index and its characteristic radius. In the bottom three rows, we present the extinction-corrected (u − g), (g − r) and (r − i) colours for the outer regions of both galaxies. The last row shows the age estimates of the respective model stellar populations as derived from the comparison with the model evolutionary tracks. Both the colours and ages are explained below.
Photometric parameters of J0015+0104 and J2354−0005.
| Parameter | J0015+0105 | J2354−0005 |
|---|---|---|
| gtot | 18.02 ± 0.01 | 18.52 ± 0.02 |
| (u − g)tot | 0.91 ± 0.03 | 0.58 ± 0.04 |
| (g − r)tot | 0.19 ± 0.01 | 0.10 ± 0.03 |
| (r − i)tot | −0.08 ± 0.01 | 0.13 ± 0.04 |
| Btot | 18.31 ± 0.02 | 18.79 ± 0.03 |
| (b/a)25 | 0.734 | 0.563 |
| μ0, g (mag arcsec−2) | 24.04 ± 0.28 | 22.75 ± 0.08 |
| μ0, r (mag arcsec−2) | 24.40 ± 0.15 | 22.85 ± 0.10 |
| μ0, B (mag arcsec−2) | 24.15 ± 0.32 | 23.01 ± 0.12 |
| μ0, B, c, i (mag arcsec−2) | 24.47 ± 0.32 | 23.55 ± 0.12 |
| ng (Sérsic) | 1.23 ± 0.24 | 1.00 ± 0.01 |
| αg (arcsec) | 7.3 ± 1.8 | 2.7 ± 0.1 |
| (u − g)outer, c | 0.93 ± 0.08 | 0.79 ± 0.05 |
| (g − r)outer, c | 0.19 ± 0.05 | 0.09 ± 0.03 |
| (r − i)outer, c | 0.15 ± 0.07 | 0.03 ± 0.04 |
| T (‘old’ population) | 4.5 ± 1.5 Gyr | 2.7 ± 0.8 Gyr |
(1) All values of the total magnitudes are not corrected for the foreground MW extinction; (2) colours of the outer parts are corrected for the foreground MW extinction.
One of our main goals was to compare the observed colours of stellar population with the pegase2 model evolutionary tracks, in order to obtain the estimates of the maximal stellar ages in these very metal poor galaxies. As one can see from the (g − r) colour radial profile of J0015+0104 in Fig. 3 (left-hand panel), due to the contribution of the above-mentioned H ii region to the light of the outer parts of the galaxy, it is difficult to estimate from the profile the outer colours and to decide whether there is a colour gradient in the underlying stellar population.
In Fig. 4, we compare the derived colours of the outer parts for J0015+0104 and J2354−0005 (squares with error bars) from Table 1 with the model tracks from the pegase2 package (Fioc & Rocca-Volmerange 1999). To derive the upper limit of the visible stellar population ages, we exploit the evolutionary tracks for the two extreme SF laws: instantaneous SF burst and continuous SF with constant SF rate. For both SF laws, we show tracks with the Salpeter initial mass function (IMF; solid) and with the IMF of Kroupa et al. (dotted line) for metallicity z = 0.0004, which is the best proxy for the O/H values of the galaxies in question. The integrated colours of J0015+0104 fall in between the Salpeter and Kroupa et al. IMF continuous SF law tracks. Its rather blue colours (u − g), (g − r) correspond to ages of ∼3 Gyr. The square with error bars, corresponding to colours of the outer parts (obtained by integrating the light in 14 small round apertures at the mean radial distance of 11 arcsec or ∼1.5 kpc), falls also in between the Salpeter and Kroupa et al. continuous SF law tracks, but in the region with ages of ∼4.5 ± 1.5 Gyr, in difference with the ages of ∼10–13 Gyr, corresponding to red colours of the majority of late-type dwarf galaxies, for which the similar data are acquired (e.g. Parodi, Barazza & Binggeli 2002; Kniazev et al. 2009; Bergvall, Zackrisson & Caldwell 2010). For J2354−0005, the total colours appear somewhat bluer than the model tracks. This can be related to the significant contribution of the central starburst emission. The colours of the outer parts, obtained by integrating the light in five small round apertures at the mean radial distance of 4.4 arcsec (∼0.7 kpc), are redder in (u − g). The position of the respective square is closer to the Salpeter IMF continuous SF track, with the mean age of ∼2.7 ± 0.8 Gyr. In the gri colour plot (not shown), both tracks go too close to each other, so the galaxy gri colours alone would be inconclusive. However, the measured (r − i) colours are consistent with the above conclusions derived from ugr colours.
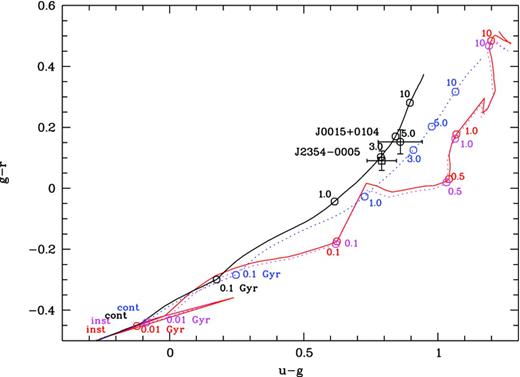
Two squares with error bars show the ugr colours of the outer parts (see the description in the text) of SDSS J0015+0104 and J2354−0005 in comparison with the pegase2 evolutionary tracks (accounting for small shift due to galaxies’ redshift) for instantaneous (rightmost) and continuous (leftmost) SF laws. The ticks along the tracks mark the time (in Gyr) since the beginning of SF episode. Stellar metallicity is z = 0.0004, the best model proxy for the real gas metallicities in these galaxies. The solid lines are for the Salpeter IMF, while the dotted ones are for the Kroupa et al. IMF.
4 DISCUSSION
In Table 2, we present the main parameters of the studied galaxies. Since the LSBD galaxy J0015+0104 is not properly identified in the SDSS, we adopt for its coordinates those of its geometrical centre, instead of the H ii region located at the edge of the galaxy. For J2354−0005, however, we keep the SDSS coordinates of the emission-line knot, which differ from the main body centre only by ∼1 arcsec. From the total magnitudes in filters g and r (Table 1), with the transformation equations of Lupton et al. (2005), we derived the total B-band magnitudes, Btot = 18.31 ± 0.03 and 18.79 ± 0.03, respectively. For their adopted distance moduli μ = 32.27 (D = 28.4 Mpc) and μ = 32.53 (D = 32.1 Mpc), their absolute magnitudes are |$M_{\rm B}^0 = -$|14.07 and −13.88. The latter correspond to LB = 6.55 and 5.47 × 10⁷LB⊙. Then, from the M(H i) derived in the previous section, one obtains the ratios M(H i)/LB ∼ 2.35 and ∼2.2 (in solar units).
Main parameters of SDSS J0015+0104, J2354−0005, J0926+3343 and median for the nine typical LSBD sample.
| Parameter | J0015+0104 | J2354−0005 | J0926+3343 | ‘Typical’ LSBDh |
|---|---|---|---|---|
| RA (J2000.0) | 00 15 21.22 | 23 54 37.30 | 09 26 09.45 | – |
| Dec. (J2000.0) | +01 04 29.9 | −00 05 06.1 | +33 43 04.1 | – |
| AB (from NED) | 0.11 | 0.14 | 0.08 | – |
| Btot | 18.31d | 18.79d | 17.34g | – |
| Vhel(H i) (km s−1) | 2035 ± 1d | 2310 ± 4d | 536g | – |
| VLG(H i) (km s−1) | 2207 | 2489 | 488g | – |
| Distance (Mpc) | 28.4d | 32.1d | 10.7g | 16.0 |
| |$M_{\rm B}^0$| | −14.07d | −13.88d | −12.90g | −15.53 |
| Opt. size (arcsec)a | 7.5 × 5.5d | 6.5 × 3.6d | 35.8 × 9.9g | – |
| Opt. size (kpc) | 1.03 × 0.75 | 1.01 × 0.56 | 0.93 × 0.26g | – |
| |$\mu _{B,c,i}^0$| (mag arcsec−2) | 24.47 d | 23.55d | 25.4g | 23.70 |
| 12+log (O/H) | 7.07 ± 0.07e | 7.36 ± 0.13e | 7.12g | 8.0 |
| H i int. fluxb | 0.81 ± 0.04f | 0.50 ± 0.04f | 2.54g | – |
| W50 (km s−1) | 22 ± 2f | 38 ± 7f | 47.4g | – |
| W20 (km s−1) | 32 ± 3f | 70 ± 12f | 80.5g | – |
| Vrot (H i) (km s−1) | 7::f | 29f | 32g | – |
| M(H i) (10|$^{7} \text{M}$|⊙) | 15.4d | 12.2f | 6.8g | 45.6 |
| Mdyn (10|$^{7} \text{M}$|⊙) | – | 101d | 124g | 339 |
| M(H i)/|$L_{\rm B}^{c}$| | 2.35d | 2.2d | 3.0g | 2.2 |
| fgas | 0.98d | 0.97d | 0.98d | 0.89 |
| T (main star population) | 3–6 Gyrf | 0.9–2.5 Gyrf | 1–3 Gyrg | 10 Gyr |
From the H i linewidths at the 20 per cent level of the maximal intensity, W20, one can estimate the maximal rotational velocities, using the standard approximation, as, e.g., formula 12 from Tully & Fouqué (1985) or in Tully et al. (2008). If one assumes that the planes of H i and stellar discs are close, the inclination corrections are 1/sin (i) = 1.4 and 1.18. For the measured linewidths W20 = 29.4 and 68 km s−1, accounting for the velocity dispersion of H i gas, σV = 8 km s−1, the derived Vrot ∼ 5 km s−1 [Tully & Fouqué (1985), since for Tully et al. (2008) the value W20 < 38 km s−1 implies zero rotation velocity] and 24.3 km s−1. Respectively, the inclination-corrected velocities are Vrot = 7 and 28.6 km s−1. The former value is substantially smaller than Vrot typical of dwarf galaxies with comparable MB in the faint dwarf sample Faint Irregular Galaxies GMRT Survey of Begum et al. (2008b). Indeed, the recent H i mapping with GMRT (Chengalur et al., in preparation) reveals that the very small width of the H i profile in galaxy J0015+0104 is due to almost face-on inclination of its H i disc. Therefore, the correct deprojection should increase the apparent rotation velocity amplitude by several times. Having Vrot and the characteristic size of the galaxy, one can estimate its total (dynamical) mass which is necessary to balance the centrifugal force within a certain radius. Due to the above-mentioned situation (which is quite rare), for J0015+0104 such an estimate, based only on the NRT profile and the optical body inclination, is highly unreliable. We refer to the GMRT data analysis in preparation for its better dynamical mass estimate.
The typical radii of H i discs (at the column density level of 1019 atoms cm−2) in dwarf galaxies with MB ∼ −13, close to those of the studied LSBDs, are 2.5–3 times larger than the Holmberg radius (e.g. Begum et al. 2008a,b). Therefore, we accept that the H i radius of J2354−0005 is |$R_{\rm H\,{\small {I}}} = 5.3$| kpc. Then, from the relation |$M(R < R_{\rm H\,{\small {I}}}$|) = |$V_{\rm rot}^2 \times$||$R_{\rm H\,{\small {I}}}/G$|, where G is the gravitational constant, one derives the total mass within |$R_{\rm H\,{\small {I}}}$| as follows: Mtot = 10.1 × 10⁸ M⊙. To get the estimates of the gas mass in both galaxies, we sum M(H i) and M(He) (a fraction of 0.33 of H i mass) that gives, respectively, Mgas = 2.05 × 10⁸ and 1.85 × 10⁸ M⊙.
The mass of stars can be estimated as follows. We take from Table 1 the total g magnitude of J0015+0104 equal to 18.02. This corresponds to the extinction-corrected absolute magnitude Mg = −14.35. Following the prescripts of Zibetti, Charlot & Rix (2009),3 we use the mass-to-light ratio ϒ based on g-filter luminosity and the extinction-corrected colour (g − i)tot = 0.06 ± 0.04. This reads as log ϒg = −1.197 + 1.431 × (g − i). Hence, log ϒg = −1.111 ± 0.057, and ϒg is 0.077|$\pm ^{0.011}_{0.009}$|. For the absolute magnitude of J0015+0104 of Mg = −14.35 and the absolute Mg, ⊙ = 5.15, the galaxy luminosity appears Lg, J0015 = 6.3 × 10⁷ L⊙. With ϒg = 0.077 from above, this implies the total stellar mass of (|$0.048\pm ^{0.007}_{0.006}$|) × 108 M⊙. Then the baryonic mass is Mbary = (2.10 ± 0.13) × 108 M⊙ and the gas mass fraction fgas = Mgas/(Mgas + Mstar) = 0.976. The similar estimate of the stellar mass for galaxy J2354−0005, based on its (g − i)tot = 0.17 ± 0.05, uses the value of ϒg = 0.108|$\pm ^{0.019}_{0.017}$|. With its absolute magnitude of Mg = −14.05, its luminosity is Lg, J2354 = 4.7 × 10⁷ L⊙. Then its total stellar mass is (0.051 ± 0.008) × 108 M⊙. The respective baryonic mass is Mbary = 1.90 × 10⁸ M⊙, and fg = 0.973.
The ratio of Mtot [inside R(H i)] to Mbary for J2354−0005 is ∼5.3, rather close to the cosmic mean value derived for the best-fitting ΛCDM cosmology. For galaxy J0015+0104, if we adopt its rotation velocity as derived with the inclination correction for its optical body, and similar H i radius, such a ratio will be ∼0.2, while by the definition this should not be less than 1. The latter directly indicates that the H i disc is much closer to face-on. Even in the case when the ratio R(H i)/RHolm is significantly larger than that adopted here (2.75), that is similar to those of a few very gas rich galaxies, with the ratio R(H i)/RHolm of 5–10 [e.g. as in And IV and NGC 3741 (Begum et al. 2008a) and KK 246 (Kreckel et al. 2011a)], the estimate of Mtot within R(H i) will be still smaller than Mbar. Anyway, to get a better quality estimate of the dark matter halo mass and its radial distribution, one needs H i mapping of the galaxy. In Table 2, along with the summary of the main parameters for SDSS J0015+0104 and J2354−0005, we remind the properties of SDSS J0926+3343 with 12+log (O/H) = 7.12 (Pustilnik et al. 2010), in order to emphasize the range of other parameter diversity in the two most metal poor LSBD galaxies known. As one can see, the difference of their main parameters (gas mass, corrected central SB, blue luminosity) does not exceed a factor of 2–3. Their O/H and very high gas mass fractions are very close; the ages of the main visible old population being non-cosmological can differ in several times, or can be about the same if T ∼ 3 Gyr.
While we consider these two LSBDs and several of their counterparts in the Lynx–Cancer void as unusual, it is reasonable to illustrate the properties of more or less typical LSBDs. One of the best LSBD samples is a subsample of late-type galaxies in the Local Volume and its environment studied by van Zee & Haynes (2006). We made a simple statistical analysis of that subsample's properties (which includes UGC 2684, UGCA 20, UGC 3174, UGCA 357, UGC 891, UGC 5716, UGC 300, UGC 11820 and UGC 634) and summarize their medians in the last column of Table 2. They appear quite similar on luminosity, the central SB (as expected from their definition) and M(H i)/LB ratio. However, their O/H typically is four to eight times higher and their gas mass fraction corresponds to a significantly larger proportion of stellar mass. The latter is related to their redder integrated colours. Thus, one can conclude that the main differences between the LSBDs studied in this paper and more typical ones are their too low metallicity (in comparison to that expected for their luminosity; see Papers II and III) and too blue integrated and the outer region colours.
Such unusual LSBDs which combine the very low metallicity, very high gas mass fraction and blue colours of stellar population in galaxy outer parts are extremely rare. So far they are found mostly in voids (and probably sometimes at the periphery of groups; Paper III and Chengalur & Pustilnik 2013). A few galaxies with fgas ∼ 0.9 found in Geha et al. (2006) and McGaugh et al. (2010) can appear as similar objects, but this needs a careful study. Three very gas rich dwarf galaxies also were recently found near void centres in the Void Galaxy Survey (Kreckel et al. 2012). Therefore, it is natural to look for surroundings of galaxies in the question. The examination of the immediate environment of SDSS J0015+0104 with NED shows no catalogued galaxy with known radial velocity within the projected distance of ∼2 Mpc and ΔV ∼ 500 km s−1. The careful study of the neighbouring sky region reveals no luminous galaxies (with MB <−19) at the projected distances closer than 7 Mpc with ΔV < 500 km s−1. This is consistent with the separation of this cell of the local Universe as a part of the ‘Eridanus void’ according to the description by Fairall (1998). In his table 4.1, the Eridanus void is centred on the sky at RA ∼ 1.0 h, Dec. ∼0° and at the distance corresponding to VLG ∼ 2500 km s−1. The similar inspection of J2354−0005 surroundings with NED shows that it also resides within the void but closer to its border. The nearest luminous galaxy NGC 7716 is at ∼2.5 Mpc in projection, with ΔV = 260 km s−1, that is at the physical distance of 4.3 Mpc. The nearest subluminous galaxy UGC 12857 is located at the projected distance of 0.86 Mpc and ΔV = 166 km s−1, or at the physical distance of 2.4 Mpc.
The two very metal poor LSBDs discussed above are similar to several of the most metal poor LSBDs in the Lynx–Cancer void, described in Paper III. The very high concentration of such ‘unevolved’ dwarfs in that void allowed us to conclude that the very low density environment provides the special conditions for (a part of) low-mass galaxy formation and evolution. The existence in the Eridanus void of these two unusual extremely metal deficient (XMD) LSBDs, as well as of several other XMD galaxies (work in progress), is consistent with a more general statement on the causal relations between voids and ‘unevolved’ dwarf galaxies.
Summarizing the results and discussion above, we draw the following conclusions.
The two genuine LSBD galaxies SDSS J0015+0104 and J2354−0005 with the extremely low metallicities are situated deeply in the Eridanus void, with distances to the nearest luminous galaxies of |$D_{\text{NN}}$| of >7 and 4.3 Mpc, respectively.
The H i integrated flux of these galaxies, along with the SDSS-based optical photometry, indicates that they are very gas rich objects, with M(H i)/LB ∼ 2.35 and ∼2.3, and with the derived gas mass fractions of fgas ∼ 0.98 and 0.97, respectively.
For J2354−0005, the total mass estimate based on the galaxy W20, size and inclination angle derived from the optical axial ratio leads to |$M_{\text{tot}}/M_{\text{bary}}$| ∼ 5.3. For J0015+0104, having a very narrow H iprofile, the related low rotation velocity estimate is due to the large misalignment between the optical and H i discs. The orientation of the latter (as evident from the GMRT H i mapping) is close to face-on.
The (u − g), (g − r) and (r − i) colours of SDSS J0015+0104 and J2354−0005 are rather ‘blue’. The ‘outer’ region colours show no tracers of ubiquitous old stellar population with ages of 10–12 Gyr. They well match the pegase2 model track for the evolving stellar population with continuous SF for ages of T∼ 4.5 Gyr for the former and T ∼ 2.7 Gyr for the latter. Thus, all three observational parameters: O/H, fg and blue colours consistently evidence for evolutionary young status of these dwarfs.
Void-type environment seems to favour the appearance of unusual dwarf galaxies with properties of unevolved matter (very low metallicity and very high gas mass fraction). Therefore, the dedicated search for such objects among void sample galaxies can be one of the most efficient means.
SAP and YAL acknowledge the partial support of this project through the RFBR grant no. 11-02-00261 and the Russian Federal Innovation Program (contract no. 14.740.11.0901 and proposal no. 2012-1.5-12-000-1011-004). SAP and JMM acknowledge the NRT TAC for allocation of TOO for this programme in 2011–2012. This work was started during SAP visit to Observatoire de Paris, GEPI in 2011. He thanks it for support and hospitality. AYK acknowledges the support from the National Research Foundation (NRF) of South Africa. The questions and suggestions of the anonymous reviewer helped to improve the paper quality. The authors acknowledge the spectral and photometric data and the related information available in the SDSS data base used for this study. The Sloan Digital Sky Survey (SDSS) is a joint project of the University of Chicago, Fermilab, the Institute for Advanced Study, the Japan Participation Group, the Johns Hopkins University, the Max-Planck-Institute for Astronomy (MPIA), the Max-Planck-Institute for Astrophysics (MPA), New Mexico State University, Princeton University, the United States Naval Observatory and the University of Washington. Apache Point Observatory, site of the SDSS telescopes, is operated by the Astrophysical Research Consortium (ARC). This research has made use of the NASA/IPAC Extragalactic Database (NED), which is operated by the Jet Propulsion Laboratory, California Institute of Technology, under contract with the National Aeronautics and Space Administration.
The Nançay Radioastronomy Station is part of the Observatoire de Paris and is operated by the Ministère de l’Education Nationale and Institut des Sciences de l’Univers of the Centre National de la Recherche Scientifique.
We choose this prescript as the most advanced and, in contrast with previous works, incorporating the SF history at relatively late epochs, which better corresponds to LSBD galaxies considered here.
