


Abstract
Unveiling the structural evolution of spheroids, and in particular the origin of the tight size–stellar mass relation, has become one of the hottest topics in cosmology in the last years and it is still largely debated. To this purpose, we present and discuss basic predictions of an updated version of the latest release of the Munich semi-analytic hierarchical galaxy formation model that grows bulges via mergers and disc instabilities. We find that while spheroids below a characteristic mass Ms ∼ 1011 M⊙ grow their sizes via a mixture of disc instability and mergers, galaxies above it mainly evolve via dry mergers. Including gas dissipation in major mergers efficiently shrinks galaxies, especially those with final mass Ms ≲ 1011 M⊙ that are the most gas-rich, improving the match with different observables. We find that the predicted scatter in sizes at fixed stellar mass is still larger than the observed one by up to ≲ 40 per cent. Spheroids are, on average, more compact at higher redshifts at fixed stellar mass, and at fixed redshift and stellar mass larger galaxies tend to be more star forming. More specifically, while for bulge-dominated galaxies the model envisages a nearly mass-independent decrease in sizes, the predicted size evolution for intermediate-mass galaxies is more complex. The z = 2 progenitors of massive galaxies with Mstar ∼ (1–2) × 1011 M⊙ and B/T > 0.7 at z = 0 are found to be mostly disc-dominated galaxies with a median B/T ∼ 0.3, with only ∼ 20 per cent remaining bulge-dominated. The model also predicts that central spheroids living in more massive haloes tend to have larger sizes at fixed stellar mass. Including host halo mass dependence in computing velocity dispersions allows the model to properly reproduce the correlations with stellar mass. We also discuss the Fundamental Plane, the correlations with galaxy age, the structural properties of pseudo-bulges and the correlations with central black holes.
1 INTRODUCTION
One of the most important and still debated problems in cosmology is the formation and evolution of galaxies. Today we see galaxies having a variety of morphologies, ranging from less massive, pure stellar discs, to intermediate-mass bulge plus disc galaxies, to more massive spheroidal systems. The origin of this transition is still in many respects unclear. More specifically, while angular momentum conservation may explain many properties of discs (e.g. Governato et al. 2007), the origin of bulges is still largely unsolved and debated. Why do some galaxies show bulges, while others do not? Or, in other words, what is the origin of the gradual conversion from discs to spheroids?
It is clear that if we want to understand galaxy formation we need to observe the high-redshift Universe. Deep observations in the last decades or so have, however, unveiled a full complex zoology of high-redshift (proto)galaxies, which makes it even more puzzling – but also more exciting – assessing the actual routes chosen by nature to build the galaxy populations we observe today. Along with star-forming discs and dust-enshrouded galaxies (e.g. Blain et al. 2002; Magdis et al. 2011), deep optical and near-infrared surveys have in fact discovered the presence of numerous extremely compact and passively evolving galaxies up to z ≳ 3 (e.g. Trujillo et al. 2006, 2007; Buitrago et al. 2008; Chapman et al. 2008; Cimatti et al. 2008; Franx et al. 2008; Saracco, Longhetti & Andreon 2008; Tacconi et al. 2008; van der Wel et al. 2008; van Dokkum et al. 2008, 2010; Younger et al. 2008; Bezanson et al. 2009; Damjanov et al. 2009; Saracco, Longhetti & Gargiulo 2010; Williams et al. 2010; Ryan et al. 2012). The stellar masses range from 1010 to 1012 M⊙, with a factor of ∼ 2 systematic uncertainty and with half-light radii within 0.4–5 kpc, being two to six times more compact than their local counterparts of similar stellar mass (e.g. van Dokkum et al. 2010; Saracco, Longhetti & Gargiulo 2011). Although several observational limitations may affect high-redshift size measurements (e.g. Mancini et al. 2009), extremely deep imaging (e.g. Szomoru et al. 2010) also through lensing (e.g. Auger et al. 2011; Newton et al. 2011) and the available measurements of very high velocity dispersions for a subset of these galaxies (e.g. Cappellari et al. 2009; Cenarro & Trujillo 2009; van Dokkum, Kriek & Franx 2009; van de Sande et al. 2011) are confirming their extreme compactness.
Moreover, it is now being established that early-type galaxies at higher redshifts are not all compact. At fixed stellar mass, similar fractions of large and compact galaxies of similar mass co-exist at the same epoch (e.g. Mancini et al. 2009; Valentinuzzi et al. 2010a) and with a variety of bulge-to-disc ratios (e.g. van der Wel et al. 2011). By studying the spectra of 62 early-type galaxies at high redshifts, Saracco et al. (2011) found that compact galaxies tend to have most of their stars formed at z > 5, while larger galaxies at fixed stellar mass are generally younger. Along similar lines and extending the analysis to other high-redshift galaxy populations, Mosleh et al. (2011) concluded that the structure of galaxies is somewhat correlated to their activity, i.e. the sizes of galaxies at a given stellar mass are somewhat correlated to their star formation rate levels, similar to what is observed in the local Universe. At lower redshifts, it has been shown that the size–age relation at fixed stellar mass is similarly shaped for lenticulars (Shankar & Bernardi 2009; van der Wel et al. 2009), i.e. older systems are more compact, but becomes rather flat for bulge-dominated galaxies (Bernardi et al. 2010; Shankar et al. 2010b; Trujillo, Ferreras & de la Rosa 2011). Thus, whatever process formed massive ellipticals, it must have been fine-tuned to bring all young and old high-redshift massive spheroids on the same local size–mass relation.
Understanding the evolutionary link these compact and large high-redshift galaxies might have with the variety of star-forming galaxies at similar redshifts and stellar mass, if any, and with the local early-type galaxy population remains an open debate (e.g. Cole et al. 2000; Benson et al. 2003; Granato et al. 2004, 2006; Menci et al. 2004, 2006; Baugh et al. 2005; Bower et al. 2006; De Lucia et al. 2006; De Lucia & Blaizot 2007; Monaco, Fontanot & Taffoni 2007; Fan et al. 2008; Somerville et al. 2008a; Dekel, Sari & Ceverino 2009b; Khochfar & Silk 2009; Neistein & Weinmann 2010; Bournaud et al. 2011b; González et al. 2011).
According to the standard cosmological paradigm of structure formation and evolution, dark matter haloes have grown hierarchically, through the continuous merging of smaller units into larger systems. In this scenario, galaxies form inside this hierarchically growing system of haloes (e.g. Cole et al. 2000; De Lucia et al. 2006). However, the actual role played by mergers (major, minor, wet and dry) in the structural evolution of massive spheroids is still uncertain (e.g. Hopkins et al. 2010, and references therein). Some models of galaxy formation (e.g. Eggen, Lynden-Bell & Sandage 1962; Merlin et al. 2012) envisage that most of the mass in local massive spheroids was formed and assembled in a strong and rapid burst of star formation at high redshifts, and the remnants evolved almost passively thereafter, without being strongly affected by late merging events.
Galaxy formation models built on top of large N-body dark matter numerical simulations or analytic merger trees claim instead that although the stars of the most massive spheroids are the oldest being formed at very high redshifts, they have assembled a large fraction of their final stellar mass only at relatively late times via a sequence of minor and major merger events (e.g. Baugh et al. 2005; De Lucia et al. 2006; Khochfar & Silk 2006a; De Lucia & Blaizot 2007; González et al. 2011). It has long been known that binary mergers between discs can indeed produce spheroidal galaxies and also explain many of their structural properties (e.g. Barnes 1992; Hernquist 1992; Robertson et al. 2006), though several issues remain to be solved in this basic scenario (e.g. Naab & Ostriker 2009). In high-redshift and gas-rich disc galaxy mergers, however, gas dissipation inevitably forms compact spheroids (e.g. Naab, Jesseit & Burkert 2006; Robertson et al. 2006; Hopkins et al. 2009). Hierarchical models then naturally explain the evolution of the size (and mass) of massive compact spheroids as a sequence of ‘dry’ (gas poor) and mainly minor mergers that puff up the outskirts of the galaxy leaving the central regions of the galaxy almost intact (e.g. Naab et al. 2007; Ciotti 2009; Naab, Johansson & Ostriker 2009). Numerical simulations have, however, shed doubts on the coherence with which mergers can bring galaxies along the tight structural relations observed in the local Universe (e.g. Ciotti & van Albada 2001; Nipoti, Treu & Bolton 2009).
Another class of models explains the size evolution of early-type galaxies via a quasi-adiabatic expansion phase consequent to the blowout of substantial amounts of mass via quasar and/or stellar feedback (Fan et al. 2008, 2010; Damjanov et al. 2009). Initial numerical experiments to test the latter proposal as a viable explanation to size evolution have been recently performed by Ragone-Figueroa & Granato (2011).
Bulges could also be formed via in situ processes that are broadly classified as disc instabilities. In unstable self-gravitating discs, the instability may drive the formation of a bar with mass transferred from the disc into a central bulge (e.g. Cole et al. 2000). The degree of mass transferred to the bulge varies from one model to the other. Some models consider the instability quite a violent process capable of transferring most of the disc into a bulge and also inducing a starburst (Bower et al. 2006). Besides bars, other types of instabilities could contribute to the formation of bulges. Observations from the deep SINS survey of z ∼ 2 galaxies (Förster Schreiber et al. 2011; Genzel et al. 2011) have revealed the existence of gravitationally bound clumps residing in gas-rich discs. Some hydrodynamic simulations have confirmed that within the turbulent and gas-rich high-redshift discs, large gas clumps can indeed be formed and migrate via dynamical friction to the centre, thus progressively building a stellar bulge (e.g. Dekel et al. 2009a; Bournaud et al. 2011a).
Given the still debated physical mechanisms behind the evolution of spheroids, theoretical work on this hot topic is mandatory. The aim of this work is to explore the full predictions of a state-of-the-art semi-analytic model (SAM) of galaxy formation that evolves massive spheroids in a hierarchical fashion. More specifically, we will present and discuss basic predictions on the size–mass relation and its evolution with redshift of relatively massive spheroids. We will mainly focus on their size evolution at fixed stellar mass and in different environments, the structural properties of their progenitors, but also touch upon several other related issues. Our objective is not to prove that the model discussed here is the correct one, but rather to lay out the successes and failures of a detailed hierarchical model against the wealth of data now becoming available from large and deep surveys. We will also stress that several outcomes of the model considered here are shared by many other hierarchical SAMs, making most of our conclusions of particular interest to the field of galaxy formation, but also discuss key differences.
The paper is organized as follows. In Section 2, we introduce the hierarchical model considered for this work, focusing on the features relevant to this work. In the same section, we present a large sample of well-studied early-type galaxies taken as term of comparison for model outputs. Section 3 contains a discussion of key issues such as the relation between size (and velocity dispersion) and stellar mass, its scatter and evolution with redshift, and the role of environment. We discuss in Section 4 the evolutionary features of spheroids, the analogies and differences with other SAMs, and ways to further constrain galaxy formation models. We then conclude in Section 5. In Appendices A–D, we will also briefly discuss a number of related topics, such as the distinction between classical and ‘pseudo-bulges’, the connection with black holes (BHs) and with galaxy ages, the Fundamental Plane (FP) and its evolution with time.
2 INITIAL SETTINGS: MODEL AND DATA
2.1 The reference model
All of the results presented in this work are the outcome of running the original numerical source code by Guo et al. (2011), i.e. the latest rendition of the SAM developed at the Max Planck Institute for Astrophysics. As detailed below, with respect to the original Guo et al. (2011) model, we have modified the computation of bulge radii exploring a variety of possibilities, and added the calculation of the coupled velocity dispersions. Note that running the code and producing a new galaxy catalogue each time is different from studying the online catalogues as it allows a self-consistent thorough study of the structural evolution of galaxies in the SAM. We stress that the modifications applied to the original Guo et al. (2011) model do not affect any other galaxy property except for sizes. Thus, the model (we checked) maintains the same exact performance with respect to the observables (e.g. the stellar mass function) as presented in Guo et al. (2011). Before discussing bulge sizes in detail, we first provide below a brief overview of the model.
The Munich SAM aims at providing a comprehensive picture of the evolution of galaxies and their central supermassive BHs within the hierarchical structure and merging of dark matter haloes and subhaloes within the concordance Λ cold dark matter (ΛCDM) cosmology. To this purpose, it is implemented on top of the large, high-resolution cosmological N-body Millennium I (Springel et al. 2005) and Millennium II (Boylan-Kolchin et al. 2009) simulations. Given that in this paper we are mainly interested on the structural properties of the most massive galaxies in the local Universe, all of the results presented here have been obtained by running the code on the significantly larger Millennium I Simulation. The latter simulation follows the evolution of N = 21603 dark matter particles of mass 8.6 × 10⁸ h− 1 M⊙, within a comoving box of size 500 h− 1 Mpc on a side, from z = 127 to the present, with cosmological parameters Ωm = 0.25, Ωb = 0.045, h = 0.73, | $\Omega _\Lambda =0.75$|, n = 1 and σ8 = 0.9.
As comprehensively detailed in Guo et al. (2011), the model self-consistently evolves the full population of galaxies within the hierarchy of dark matter haloes, adopting a set of equations to describe the radiative cooling of gas, the star formation, metal enrichment and supernovae feedback, the growth and feedback of supermassive BHs, the ultraviolet background reionization and the effects of galaxy mergers.
Particularly relevant to the present paper is the generation of galaxy morphology within the model. Collapse of baryons within dark matter haloes and conservation of specific angular momentum naturally lead to the formation of discs. In the Guo et al. model, gaseous and stellar discs are distinguished, and each component is evolved in time in an inside-out fashion, continuously evolving in mass and angular momentum due to the progressive addition from cooling gas, minor mergers and gas removal from star formation. It is also assumed that both the gas and stellar discs are thin, in centrifugal equilibrium, and have exponential profiles [we refer the reader to Guo et al. (2011) for full details].
One of the primary channels to instead form and evolve bulges in the model is via galaxy mergers. In the case of a minor merger (M2/M1 < 0.3), the disc of the primary galaxy survives, and the stars and gas of the satellite are added to any pre-existing bulge and to the disc of the primary galaxy, respectively. Galaxy major mergers (M2/M1 ≥ 0.3) instead disrupt any stellar disc present and produce a spheroidal remnant, which contains all the old stars present in the progenitor galaxies and all the new stars formed out of the burst triggered by the merger.
Bulges can be formed even via secular evolution in the model. The type of disc instabilities considered in this model are secular processes that transfer only the portion of the stellar mass necessary to keep the disc marginally stable (see details below and in Guo et al. 2011). This way of modelling disc instabilities is different from, for example, Bower et al. (2006) that instead assume that the entire mass of the disc is transferred to the bulge during the instability, with any gas present assumed to undergo a starburst. More in general, the present model lacks at the moment any bulge formation via strong gas-rich disc instabilities and/or clump accretion under dynamical friction.
Guo et al. (2011) have shown that their model is capable of reproducing the size distribution of local discs reasonably well, and additional comparisons can be found in, for example, Fu et al. (2010) an Kauffmann et al. (2012). In this paper, we will mainly focus on the predicted structural properties of massive spheroids and their evolution with redshift, and only briefly touch, where relevant, on the evolution of discs, which will be addressed elsewhere. In particular, our primary interest in this work are bulge-dominated galaxies with bulge-to-total ratio B/T > 0.7, a threshold chosen because, as discussed below, the contribution of pseudo-bulges (Appendix B) in this regime is negligible. This in turn allows us to properly discern the actual role played by mergers in building their structural properties we observe today. Where necessary, we will also devote some attention to bulges grown via disc instabilities, though we refer the reader to Appendix B for some more specific discussion and to the separate work by Shankar et al. (2012) for additional and complementary analysis of this issue.
2.2 Computing bulge sizes in the model
Note that the conservation of energy in equation (1) is not unique and could possibly be expressed in other ways. For example, the orbital energy of two galaxies at distance d could also be computed in the centre-of-mass system of reference as Eorb = μV2/2 − GM1M2/d, in terms of the reduced mass μ = M1M2/(M1 + M2) and relative velocity | $V=\ \parallel\!\boldsymbol {V}_1-\boldsymbol {V}_2\!\parallel$|. However, while this expression might have the advantage of not being directly dependent on forb, it is still model dependent. In fact, satellite galaxies stripped away of their surrounding subhalo are assigned a surviving merging time-scale proportional to the actual Chandrasekhar dynamical friction time-scale via a fudge factor (see De Lucia et al. 2010). Thus, relative velocities and distances would still need to be modelled according to this time-scale (see also Neistein et al. 2011).
Thus, given the inevitable inclusion of some parameters in the modelling of bulge sizes, we decided for this work to stick with equation (1) that requires only one truly free extra parameter, forb/c, and at the same time allows a closer comparison with previous semi-analytic and numerical works in the literature.
As anticipated in the previous section, another route to form bulges in the model is via secular evolution (Guo et al. 2011). The adopted criterion for instability is expressed as | $V_{\rm max}<\sqrt{GM_{\rm disc}/3R_{\rm disc}}$|, with Vmax the maximum circular velocity of the host subhalo, and Mdisc and Rdisc the mass and exponential scalelength of the disc, respectively. In the event of instability, a fraction δMstar of the disc stellar mass is transferred to a central bulge to restore equilibrium, and the size Rb of the newly formed bulge is computed assuming an exponential profile. If a bulge is already present, the size of the bulge is computed via a ‘merger-type’ relation between the old and new bulge stellar masses as the one in equation (1), with M1 and R1 the mass and half-mass radius of the pre-existing bulge, and M2 and R2 equal to δMstar and Rb, respectively, and forb = 2 to take into account that the interaction in concentric shells is stronger than in a merger (see Guo et al. 2011, for further details).
2.3 The SDSS sample
Throughout the paper, we will compare model predictions with a sample of ∼ 25 000 galaxies from the Sloan Digital Sky Survey (SDSS). This is a random subset of the well-defined and complete sample defined in Bernardi et al. (2010). This sample ranges between 3 × 10⁹ and ∼ 1012 M⊙, the mass range of interest here. In addition to the photometric parameters (e.g. cmodel magnitudes and sizes) presented in Bernardi et al. (2010), this subset of ∼ 25 000 galaxies also provides bulge-to-total ratio B/T light from a de Vaucouleurs (e.g. de Vaucouleurs 1948) plus exponential decomposition (see Meert et al., in preparation; Vikram et al., in preparation), which we will extensively use in this work to select the most bulge-dominated galaxies to compare with the model. The sample is characterized by stellar masses with a Chabrier initial mass function (Chabrier 2003), consistent with the one used in the model.
3 RESULTS
3.1 A first comparison
In Fig. 1, we show a first comparison between model predictions and data from SDSS. The left-hand panel shows the median 3D half-mass radius RH versus stellar mass for different cuts in B/T, as labelled. From here onwards, unless otherwise stated, we will compute RH as the mass-weighted average of the half-mass radii of the bulge and the disc components. We have checked that, especially for the bulge-dominated systems of interest here, this is equivalent (at the per cent level) to computing a full mass profile assuming, for example, a Hernquist (1990) plus an exponential profile for the bulge and the disc, respectively. Moreover, simply neglecting the disc component in systems with B/T ≳ 0.7, the subsample of galaxies this paper focuses on, yields very similar results.
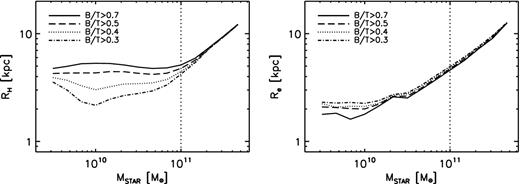
Left-hand panel: predicted median 3D half-mass radius versus stellar mass for different cuts in B/T, as labelled. Right-hand panel: median 2D projected half-light effective radius Re as a function of stellar mass for a subsample of SDSS early-type galaxy sample. It is clear that the model is at variance with the data, predicting much flatter size–mass relations below a ‘characteristic mass scale’ of Mstar ∼ 1011 M⊙, especially for higher B/T galaxies. This characteristic mass is completely absent in the data.
The right-hand panel shows the median effective radius Re as a function of stellar mass for the same cuts in B/T.1 The model predicts an increasing size with stellar mass; however, it is evident that below a ‘characteristic mass scale’ of Mstar ∼ 1011 M⊙ the predicted sizes flatten out, at variance with the data that continue to show a steep decline down to much lower masses.2
It is quite unlikely that such a strong discrepancy can simply be explained by some mass/luminosity-dependent conversion factor between RH and Re, as we will also discuss in more detail later. We checked that the predicted RH–Mstar relation shows a very similar flat behaviour at low masses already at z ∼ 2. The latter implies that the wrong shape of the size–mass relation yielded by the model is a consequence of some wrong ‘initial conditions’ and not necessarily linked with any later galaxy assembly.
3.2 Including dissipation
If the merger is gas-rich, a significant fraction of the initial energy Ediss of the system will be dissipated away, inducing a more compact remnant. Several groups have studied this issue in some detail using high-resolution hydrodynamic simulations and semi-numerical models (e.g. Naab et al. 2006; Ciotti, Lanzoni & Volonteri 2007; Hopkins et al. 2009, and references therein).
It is clear that equations (6) and (8) can significantly reduce the sizes predicted in a dissipationless merger. We assume that equations (6) and (8) only hold in major mergers, when the gas actually gets into the bulge (see Section 2.2). The decrease is proportional to the gas fractions in the progenitors. As shown in the right-hand panel of Fig. 2, the model predicts increasing gas fractions at lower stellar masses and, at fixed mass, increasing with redshift, in broad agreement with observations (e.g. Kannappan 2004; Erb et al. 2006; Catinella et al. 2010; Peeples & Shankar 2011, and references therein). The results shown here refer to galaxies with B/T > 0.5, but they are general to galaxies with higher and somewhat lower B/T. Low-mass galaxies can easily have most of their baryonic mass still in gaseous form at z ≳ 2. However, at any epoch, galaxies above Mc ≳ 3 × 10¹⁰ M⊙ tend to have progressively lower gas fractions down to ≲ 10–20 per cent. The mass Mc is an interesting mass scale several times reported in the literature to be indicative of some basic physical process in galaxy evolution [feedback from active galactic nuclei (AGNs)?] as several spectral and structural properties change when galaxies transition above it (e.g. Kauffmann et al. 2004; Shankar et al. 2006; Khochfar & Silk 2009; Bernardi et al. 2011a,b).
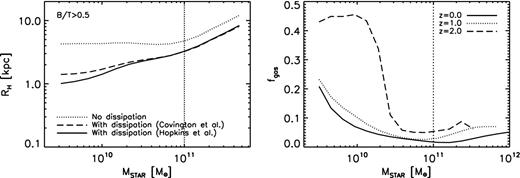
Left-hand panel: the dotted, long-dashed and solid lines show the predicted median size–mass relation for galaxies with B/T > 0.5 for a model with no dissipation, with dissipation following Covington et al. (2011) and with dissipation following the prescriptions by Hopkins et al. (2009), respectively; the vertical dotted line marks the transition above which (dry) mergers are believed to dominate galaxy assembly (see text). Right-hand panel: median cold gas fractions predicted in the model as a function of stellar mass at redshifts z = 0, 1 and 2, as labelled.
This mass- and time-dependent behaviour of fgas can then easily explain the decrease in size shown in the left-hand panel of Fig. 2. The dotted, long-dashed and solid lines show the predicted median size–mass relation for galaxies with B/T > 0.5 for a model with no dissipation, with dissipation following Covington et al. (2011) and with dissipation following the prescriptions by Hopkins et al. (2009), respectively. Although a decrease in size is apparent at all masses, dissipation is progressively more effective at lower masses, proportionally to the increase in gas fractions. In both panels, for reference the vertical dotted line at Mstar = 1011 M⊙ marks the transition above which dissipation does not play a significant role in shaping the sizes of galaxies because mergers become progressively gas poorer. It is remarkable that dissipation tends to erase the flattening below the characteristic mass producing a nearly single power law in agreement with the data. In the following, we will use equation (8) as our reference model with gas dissipation, though comparable results are obtained when switching to equation (6).
3.3 A closer comparison to the data
Fig. 3 shows the z = 0 SDSS effective radius Re (assuming de Vaucouleurs plus exponential profiles) as a function of stellar mass for galaxies with B/T > 0.7, with the contours marking the regions containing 68, 95 and 99.7 per cent of the total sample (the results discussed below do not depend on the exact choice of B/T threshold). For completeness, we report in the same figure with solid squares the median size–mass relation for the early-type galaxy sample discussed by Bernardi et al. (2011b).
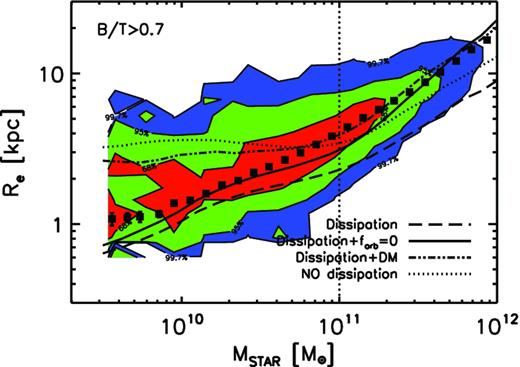
Effective radius Re as a function of stellar mass at z = 0 from the SDSS sample of early-type galaxies with B/T > 0.7. The contours mark the region of plane containing 68, 95 and 99.7 per cent fraction of the total sample. For completeness, the solid squares represent the median size–mass relation for the early-type galaxy sample discussed by Bernardi et al. (2011b). The dotted, long-dashed, solid and double dot–dashed lines represent, respectively, the predicted size–mass relations without dissipation, with dissipation, with dissipation plus forb = 0 and with dissipation plus a fraction of dark matter in the merger (see text for details).
The lines in Fig. 3 show the predicted median size–mass relations for galaxies selected to have the same minimum B/T threshold as in the data. The dotted line refers to a model with no dissipation. As discussed above, the latter model better lines up with the data for galaxies above the characteristic mass, but below it the relation inevitably flattens out to larger sizes. The long-dashed line is the size–mass relation for a model that includes dissipation in major mergers. As expected, the sizes get progressively smaller towards lower mass spheroids that have formed out of gas-richer progenitors. However, spheroids of all masses get shrunk. Thus, including dissipation not only steepens the size–mass relation, but also lowers its overall normalization.
In order to improve the fit to the data with a model with dissipation, we therefore need to increase the normalization of the predicted sizes at fixed stellar mass. Following equation (2), we have that the size of the remnant is RH∝(M1 + M2)2/(E1 + E2 + Eorb + Ediss), so in order to increase the size at each merger event, we need to decrease the denominator and/or increase the numerator. The solid line in Fig. 3 is the predicted size–mass relation assuming that most of the merger events happen on parabolic orbits with null orbital energy, i.e. forb = 0, a far from uncommon condition in numerical simulations. Actually, Khochfar & Burkert (2006) studied the orbital parameters of major mergers of CDM haloes using a high-resolution cosmological simulation, finding that almost half of all encounters are nearly parabolic. This simple variation to the basic model significantly improves the match to the data.
We conclude that dissipation inevitably shrinks galaxies and thus some additional ingredient must be included in the model to re-establish the normalization of the size–mass relation. In the following, we will use the model with forb = 0 and α = 0 as the reference one, unless otherwise stated. We note, however, that including some amount of dark matter participating in the merger could still represent a viable model if we somehow tune α to properly increase with halo/stellar mass.4
3.4 On the scatter around the mean size–mass relation
So far we discussed the median shape of the size–mass relation. We now turn to the discussion of the dispersion in sizes at fixed stellar mass. Fig. 4 shows the relative size distribution of galaxies in the mass range 10 < log Mstar < 10.5 and minimum B/T as labelled, with each distribution P(Re|Mstar) normalized in a way that the sum of the galaxy fractions in each size bin equals unity.
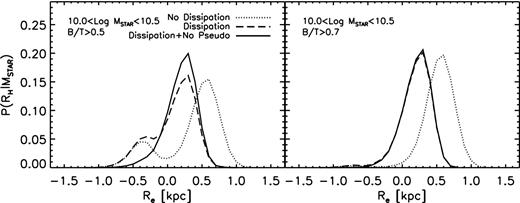
Relative size distribution of galaxies of a given mass and minimum B/T as labelled. The dotted, long-dashed and solid lines are, respectively, for models with no dissipation, with dissipation including and excluding pseudo-bulges. More specifically, the solid lines refer to models with dissipation but include only the subsample of galaxies grown mainly through mergers. Each distribution is normalized in a way that the sum of the galaxy fractions in each size bin equals unity.
The dotted lines show the P(Re|Mstar) distributions competing to the no-dissipation model. While galaxies with B/T > 0.7 (right-hand panel) have a Gaussian-like P(Re|Mstar) distribution, galaxies with lower B/T > 0.5 (left-hand panel) tend to show a double-Gaussian distribution. The second Gaussian is characterized by a peak and height a factor of a few lower than the first Gaussian, though similar in amplitude. The solid lines show the size distributions predicted by the model with dissipation but removing those bulges that grew at least 50 per cent of their final size (and a large fraction of their mass) via disc instability. The latter filtering is capable to nearly erase the second lower Gaussian from the P(Re|Mstar) distribution, proving that the latter is not produced by mergers but rather by disc instabilities. We find that most of the remaining galaxies after the filtering have B/T ≳ 0.7.
At masses higher than 2 × 10¹¹ M⊙, we always find single-Gaussian distributions irrespective of the chosen B/T threshold. We thus conclude that galaxies of any mass with B/T > 0.7 are predicted to possess bulges mainly formed through mergers (the long-dashed and solid lines in the right-hand panel of Fig. 4 coincide). On the other hand, galaxies below the characteristics mass Ms tend on average to have a significant population of pseudo-bulges with B/T < 0.7.
A full comparison between model predictions and observations is given in Fig. 5, where we plot the predicted and observed scatter for galaxies with B/T ≳ 0.7 ( so as to minimize the contribution of pseudo-bulges in this regime; we, however, note that even lower cuts in B/T yield similar results, as long as only classical bulges are considered). We homogeneously compute the scatter in the data and in the model by binning galaxies in stellar mass, build the distribution in sizes and compute the 68 per cent percentile as representative of its 1σ dispersion. Predictions for the models without and with dissipation are shown with cyan and red lines, respectively, at redshifts z = 0, z and z, as labelled.
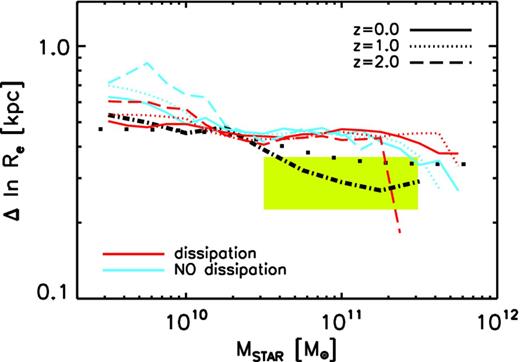
Predicted logarithmic 1σ scatter in sizes at fixed stellar at different redshifts, as labelled. Red and cyan lines refer to model predictions with and without dissipation, respectively. For comparison, the scatter measured in our SDSS subsample (thick, dot–dashed line), by Shen et al. (2003, filled squares) and by Nair et al. (2011, yellow stripe) for early-type galaxies are also shown.
The thick dot–dashed line is the scatter derived for our SDSS galaxy subsample with the same cut in B/T. We find it to be at the constant level of ∼ 0.5/ln (10) ∼ 0.22 dex below Mc, steeply decreasing to ∼ 0.1 dex, the latter in very good agreement with the results of Hyde & Bernardi (2009) for high-mass early-type galaxies. For completeness, the squared points represent the scatter of early-type galaxies calibrated by Shen et al. (2003), while the band marks the level of scatter measured, more recently, by Nair, van den Bergh & Abraham (2011). The latter computed the scatter in sizes at fixed stellar mass for early-type galaxies in rich environments. The height of the band represents the uncertainty in scatter they claimed to find when measuring sizes in different ways. Overall, despite the different techniques and selections adopted by the different groups, all measurements agree quite well with each other.
The very first issue to note from Fig. 5 is that the predicted scatter is comparable to the observed one at low masses, becoming progressively larger for galaxies with Mstar ≳ 3 × 10¹⁰ M⊙, the scale Mc above which galaxies become progressively gas poorer and their structural evolution becomes controlled by dry mergers. The disagreement between model predictions and data is mass dependent, and contained to be ≲ 40 per cent. This is in line with what claimed by several previous semi-analytic, numerical and observational studies that claimed the scatter in size at fixed stellar mass to be in disagreement with the observed one, especially for bulge-dominated galaxies at high stellar masses (e.g. González et al. 2009; Nipoti et al. 2009; Nair, van den Bergh & Abraham 2010; Shankar et al. 2010a; Nair et al. 2011). This discrepancy represents a challenge for hierarchical models that needs to be further understood.
When moving to significantly lower cuts in B/T, the significant contamination from pseudo-bulges tends to further increase the disagreement with observations. We further note that the level of predicted scatter is only marginally dependent on dissipation. In fact, galaxies with stellar mass Mstar ≳ 3 × 10¹⁰ M⊙ have comparable levels of scatter in the two models, as expected given that the role of (dry) mergers in the size evolution becomes progressively more important at higher masses (see Section 4.1). These findings are in broad agreement with some previous studies, though the role of dissipation in determining the final scatter of sizes was more emphasized (e.g. Khochfar & Silk 2006b; Covington et al. 2011). Also, the scatter does not strongly depend on redshift, especially for more massive galaxies, again those with Mstar ≳ 3 × 10¹⁰ M⊙.
3.5 Size evolution with redshift
As discussed in Section 1, massive and passive spheroids at high redshifts appear more compact with respect to their local counterparts in SDSS. This section is dedicated to understand the degree of size evolution at fixed stellar mass predicted by the model and discuss it in the light of the available data.
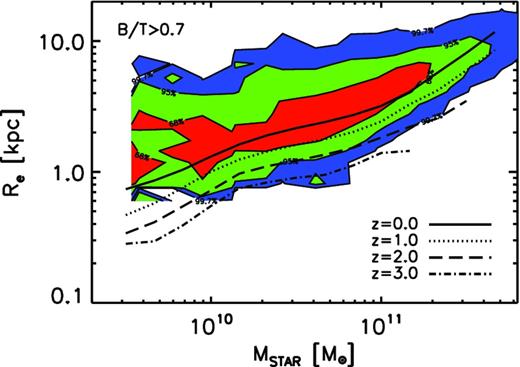
Predicted median size–mass relation for bulge-dominated galaxies with B/T > 0.7, in terms of the projected radius Re, at different redshifts, as labelled, and compared to SDSS local data (coloured regions). There is a progressive decrease in sizes of up to a factor of ∼ 2 at z = 3, similar at all stellar masses.
Fig. 6 shows the predicted size–mass relation from our reference model, in terms of the projected radius Re, at different redshifts, as labelled, and compared to SDSS local values. Here at all redshifts we select only bulge-dominated galaxies with B/T > 0.7. We find a progressive decrease of sizes at all masses. Galaxies with stellar masses above Mstar ≳ Mc = 3 × 10¹⁰ M⊙ seem to experience a similar degree of evolution, i.e. a progressive average decrease in size up to ≲ 3 at z ≲ 3. This type of nearly mass-independent evolution implies that the slope of the size–mass relation is predicted to be almost constant at all redshifts, at least for bulge-dominated systems with B/T > 0.7 with Mstar ≳ Mc.
Fig. 7 presents a more specific study of the redshift evolution in the median half-mass radius RH, normalized to the median local value, for two different intervals of bulge-to-total ratios, i.e. B/T < 0.4 and B/T > 0.7, limits chosen to select statistically significant disc- and bulge-dominated galaxy samples, respectively. Each point in the figure represents normalized median values with their associated error bars. The upper panel shows the evolution competing to lower mass galaxies with 1010 < Mstar/ M⊙ < 3 × 10¹⁰, the middle panel for galaxies with 3 × 10¹⁰ < Mstar/ M⊙ < 1011, while the lower panel refers to higher mass galaxies with 1011 < Mstar/ M⊙ < 3 × 10¹¹. Globally, for all galaxies, even for the bulge-dominated ones (solid lines), we do not find strong dependence of size evolution on gas dissipation (red and cyan lines refer to model outputs with and without dissipation, respectively). We have also checked that the degree of evolution in bulge sizes does not significantly depend on the amount of orbital energy included in the model (equation 1). This is not unexpected given that the degree of bulge size evolution in hierarchical models is mainly governed by the number and type of mergers (Section 4.1). In other words, dissipation mainly acts in deciding how compact spheroids appear after the initial gas-rich major merger event, leaving the degree of evolution, controlled by other processes, not significantly perturbed.
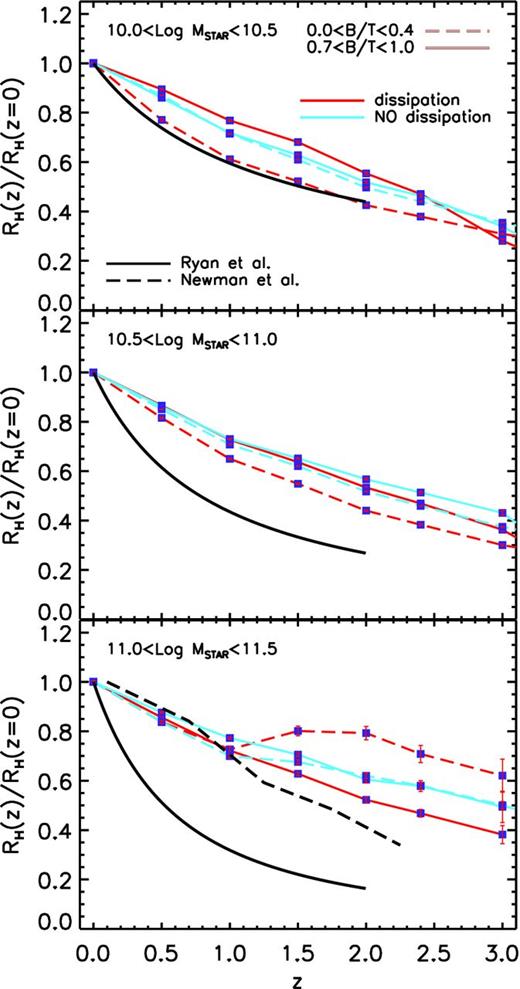
Predicted median redshift evolution (normalized to the median value at z = 0) for the total half-mass radius of galaxies of different stellar mass and B/T as labelled. The upper, middle and lower panels refer to, respectively, the size evolution of low, intermediate and high stellar mass galaxies divided into two intervals of B/T, as labelled. For bulge-dominated galaxies, the redshift evolution does not depend much on stellar mass or the degree of gas dissipation. Massive galaxies tend to evolve slower than what the data suggest (black, solid and long-dashed lines).
From Fig. 7, it is evident that the model, as anticipated in Section 2.1, can manage to reproduce the moderate redshift evolution in the half-mass stellar radius of disc-dominated galaxies (long-dashed lines), which are observed to decrease in size by a factor of ∼ 2 up to z = 2 (see e.g. Somerville et al. 2008b, and references therein). On average, however, we do not find the empirical trend for which bulge-dominated galaxies tend to grow faster than disc-dominated ones (e.g. Somerville et al. 2008b; Huertas-Company et al. 2012; Ryan et al. 2012). If anything, we start seeing a flatter size evolution in disc-dominated galaxies only for galaxies above 1011 M⊙ and at z ≳ 1.
More generally, the model does not predict a very strong size evolution for bulge-dominated galaxies at fixed stellar mass, which might not be in full agreement with the data. From the observational point of view, in fact, despite the complexities in the different selection processes (e.g. van Dokkum et al. 2010; van der Wel et al. 2011; Huertas-Company et al. 2012; Newman et al. 2012), passive early-type galaxies tend to show a stronger size evolution at high stellar masses, decreasing by up to a factor of ≲ 5 (e.g. van Dokkum et al. 2010; Huertas-Company et al. 2012). We report in each panel of Fig. 7 the analytic fit of normalized size evolution at fixed stellar mass empirically derived by Ryan et al. (2012, black solid lines), based on direct deep H imaging and data from the literature. The model predictions are in good agreement with the empirical fit for masses below ∼ 3 × 10¹⁰ M⊙, where the inferred size evolution is weaker, but tend to progressively depart from the data at higher masses (we stress that this comparison is still at a qualitative level as the fits to observations have not been derived for a homogeneous sample of galaxies selected to have the same B/T as in the model).
Similar results on the possible inefficiency of mergers in puffing up massive galaxies have now been claimed also by several independent works (Cimatti, Nipoti & Cassata 2012; Huertas-Company et al. 2012; Nipoti et al. 2012). Huertas-Company et al. (2012) more recently claimed evidence for a weaker size evolution at intermediate masses 3 × 10¹⁰ < Mstar/ M⊙ < 1011, in better agreement with model predictions, but tend to confirm the strong drop in sizes for the highest stellar mass bins. For completeness, we also report in the bottom panel of Fig. 7 the fit recently inferred by Newman et al. (2012, long-dashed line) that better lines up with the model predictions, at least at z ≲ 1. We caution, however, that due to their broader selections, their sample may not be restricted to only early-type, bulge-dominated galaxies (see discussion in Huertas-Company et al. 2012, and references therein).
In our study of size evolution at fixed stellar mass, we also tried to separate spheroidal galaxies that have mainly grown their bulges via mergers from those that mainly grew their bulges via disc instabilities. We found tentative evidence for pseudo-bulges to evolve slower in sizes with respect to classical bulges of similar stellar mass, but the statistics in some bins is poor and the systematic difference is confined at the ≲ 20 per cent level. SAMs that adopt stronger disc instabilities could provide different conclusions in this respect.
3.6 Role of environment
Not all early-type galaxies may follow the same size–mass relation. Environment, or simply the special location of galaxies at their formation epoch, might induce different evolution at later times in galaxies of similar mass. For example, if mergers dominate the structural growth of galaxies, at least at lower redshifts, then galaxies in denser environments where mergers are more efficient might appear larger at fixed stellar mass. From the observational point of view, this is still debated. At high redshifts, while some groups find clear evidence for larger galaxies in denser environments, at fixed stellar mass (e.g. Cooper et al. 2012; Papovich et al. 2012), other do not or claim some stellar mass dependence (Huertas-Company et al. 2012; Raichoor et al. 2012). In the local Universe, when selecting galaxies of a given stellar mass in the field and in overdense regions such as clusters, two main issues have emerged recently. Galaxies in clusters less massive than ∼ 4 × 10¹¹ M⊙ tend to appear smaller at fixed stellar mass than their local counterparts in the field (Valentinuzzi et al. 2010a), and non-central cluster galaxies might have had a slower or even negligible evolution down to z = 0 (Saracco et al. 2010; Valentinuzzi et al. 2010b). The observational evidence though is still sparse or not secure. Weinmann et al. (2009) investigated size distributions, among other properties, in the SDSS Data Release 4 group catalogue of Yang et al. (2007), finding no clear difference in the sizes of early-type centrals and satellites. Even the degree of evolution for the brightest cluster galaxies (BCGs) is not yet well understood. Bernardi (2009) found that BCGs have evolved by 50 per cent in size in the last few Gyr, while Stott et al. (2011) claim a milder evolution of ≳ 30 per cent since z = 1. Ascaso et al. (2011) also claim evidence for significant size evolution, though not in the light profile (the measured Sérsic index is nearly invariant with time).
Given the non-trivial impact that environment might induce on galaxy size evolution, it is thus mandatory to study what the model predictions are with respect to this important issue. We recall that the Guo et al. (2011) model follows in great detail the fate of the gas and stellar components of galaxies becoming satellites in larger dark matter haloes. Satellites suffer tidal and ram pressure stripping that can remove a large part of their gas reservoir. In particular, the model further assumes that when the host subhalo is completely disrupted during its journey within the largest halo, the galaxy's stellar component starts also being disrupted (see Guo et al. 2011, for details). The stars which are stripped away can then later become part of the central galaxy of the parent dark matter halo hosting the satellite galaxy. Given all of these physical prescriptions, it is natural to expect some structural differences between central and satellite galaxies in the code.
The left-hand panel of Fig. 8 shows the predicted size–mass relation for central and satellite galaxies (dot–dashed and long-dashed lines, respectively). Here satellites are only the ones defined to be ‘Type 2’ in the code, i.e. the ones that have completely lost their associated subhalo due to disruption. We find a relatively small, although systematic, difference with satellites being smaller by ≲ 30 per cent with respect to centrals of the same stellar mass, somewhat in between the findings of Weinmann et al. (2009) and Valentinuzzi et al. (2010a). The dotted and solid lines refer to the size–mass relation of centrals in haloes with mass 1013 < MH/ M⊙ < 1014 and MH > 1014 M⊙, respectively. Central galaxies residing in more massive haloes tend to be larger mainly because they have undergone a larger number of mergers over cosmic time.
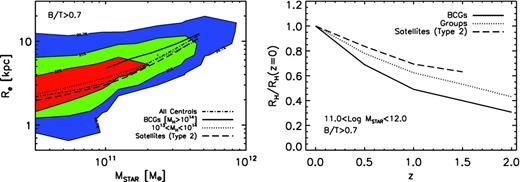
Left-hand panel: predicted median size–mass relation for all central (dot–dashed line) and Type 2 satellite galaxies (long-dashed line; with no restriction in host halo mass), compared to SDSS data. A systematic difference of ∼ 30 per cent with centrals being larger than satellites is apparent at all masses. The dotted and solid lines refer to the size–mass relation of centrals in haloes with mass 1013 < MH/ M⊙ < 1014 (groups) and MH > 1014 M⊙ (BCGs), respectively. Central galaxies residing in more massive haloes tend to be larger. Right-hand panel: median fractional size evolution for BCGs, centrals in groups and Type 2 satellites. BCGs tend to have a much faster evolution than all other galaxies of similar mass.
We have also analysed size evolution for galaxies living in different environments. The right-hand panel of Fig. 8 shows the median fractional size evolution for galaxies at fixed stellar mass and environment. We consider galaxies having stellar masses above 1011 M⊙ and B/T > 0.7. We consider BCGs, identified as centrals in haloes with MH > 1014 M⊙ (solid line), centrals in galaxy groups with 1013 < MH/ M⊙ < 1014 (dotted line), and Type 2 satellites galaxies with no restriction in host virial mass (long-dashed line). The model predicts that, at fixed stellar mass, galaxies residing in progressively more massive haloes have a proportionally stronger size evolution, mainly induced by the larger number of mergers. In particular, BCGs are predicted to increase in size by ≳ 50 per cent at z < 1, a degree of evolution in between the one calibrated by Stott et al. (2011) and Bernardi (2009).
3.7 Additional constraints from velocity dispersions
Several additional clues on the hierarchical evolution of spheroidal galaxies can be obtained when considering velocity dispersions and the virial mass of galaxies. In this section, we will discuss the physical implications that can be derived from the comparison of model predictions with a variety of key observables that include velocity dispersion. To this purpose, unless otherwise stated, we will only consider here the subsample of pure elliptical galaxies, i.e. those with B/T ≥ 0.9 for which a clear definition of velocity dispersion is possible and less biased, both observationally and theoretically, given the near absence of a stellar disc (although we note that a less extreme cut in B/T does not alter the conclusions below).
All 3D velocity dispersions are computed following equation (5) and then converted, consistently with what we discussed for sizes (Section 3.3), to line-of-sight 1D | $\sigma (1\text{D})$| using the Prugniel & Simien (1997) SK(n) coefficients, i.e. | $\sigma (1\text{D}) = [3S_K(n)]^{1/2} \sigma (3\text{D})$|, where we set n = 4 (the effect of the latter correction is, however, relatively small and does not minimally alter our conclusions).
The very first correlation with velocity dispersion that is usually studied is the one between luminosity/stellar mass and velocity dispersion, the Faber–Jackson relation (Faber & Jackson 1976). Our results are presented in Fig. 9, where the predicted Mstar–σ relation is plotted at the redshifts z = 0, 0.5, 1, 2 and 3 with a solid, dashed, dotted, long-dashed and dot–dashed line, respectively, as labelled. The grey band is the measured Mstar–σ relation from our subsample of SDSS galaxies with B/T > 0.9. The left-hand panel of Fig. 9 shows predictions for a model with σ computed via equation (5), which includes dependence on the host dark matter halo, while in the right-hand panel σ simply scales inversely with half-mass radius, ∝Mstar/RH. It is clear that the model with σ computed via equation (5) provides a much better match to the data, with stellar mass properly increasing with increasing σ. Neglecting any mass dependence in σ inevitably produces a flattening at high masses where the model predicts a quasi-linear dependence between half-mass radius and stellar mass (e.g. Fig. 3). It is also interesting to note that neglecting any halo mass dependence in σ produces a much stronger evolution in velocity dispersion at fixed stellar mass, while a model with halo mass dependence contains the evolution in σ to ≲ 30 per cent in good agreement with direct observations (e.g. Bernardi 2009; Cappellari et al. 2009; Cenarro & Trujillo 2009; van de Sande et al. 2011).
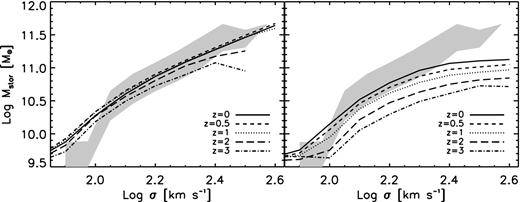
Left: predicted Mstar–σ relation at different redshifts, as labelled, for a model with a dark matter dependent σ as suggested by numerical simulations (left-hand panel) and a model with no dependence on dark matter (right-hand panel). Only galaxies with B/T ≳ 0.9 are considered. The predictions in both panels are compared to the subset of SDSS galaxies with same B/T cut (grey areas).
Several groups have proven that a clear correlation exists between velocity dispersion and circular velocity at the outer optical radius (e.g. Ferrarese 2002; Baes et al. 2003; Pizzella et al. 2005; Chae 2011). This is expected from basic dark matter theory (e.g. Loeb & Peebles 2003; Cirasuolo et al. 2005; Shankar et al. 2006; Lapi & Cavaliere 2009) as during the early fast-collapse phase of a halo, its potential well is established and a dynamical link between baryon velocity at the centre and halo circular velocity should be established. Several high-resolution simulations have confirmed this behaviour (e.g. Zhao et al. 2003; Diemand, Kuhlen & Madau 2007; Wang et al. 2011). We plot in Fig. 10 the predicted median correlation between 1D velocity dispersion and virial velocity Vvir of the halo at infall (see Guo et al. 2011), at different redshifts, as labelled, for the model with a dark matter mass dependent σ and galaxies with B/T > 0.9. The grey stripes in Fig. 10 indicate the correlation between velocity dispersion and circular velocity inferred by Baes et al. (2003) for early-type galaxies with circular velocity converted to velocity at the virial radius using the empirically derived velocity-dependent correction of Dutton et al. (2010) for early-type galaxies (their equation 3). A good agreement is found in the local Universe. The model then predicts some evolution in the zero-point of this relation with galaxies at fixed velocity dispersion being mapped into haloes with higher virial velocity but the correlation is preserved despite mergers (e.g. Boylan-Kolchin, Ma & Quataert 2005; Robertson et al. 2006; Ciotti et al. 2007). We also find (not shown in the figure) that the scatter in velocity dispersion at fixed Vvir increases with increasing redshift, in line with some observations (Courteau et al. 2007; Ho 2007).
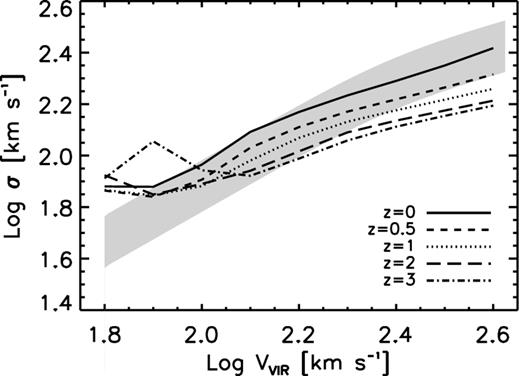
Predicted median σ–Vvir relation at different redshifts, as labelled, for a model with a dark matter mass dependent σ and galaxies with B/T > 0.9. The grey stripe indicates the velocity dispersion–circular velocity correlation by Baes et al. (2003) for early-type galaxies with circular velocity converted to velocity at the virial radius using the velocity-dependent correction of Dutton et al. (2010).
4 DISCUSSION
4.1 Evolutionary features
Having described here and in the previous sections global structural properties of spheroids of different masses and B/T, we now attempt to sketch a more comprehensive picture of spheroid evolution. To this purpose, we select subsamples of 100 galaxies of a given stellar mass and B/T at z = 0 and trace back in time the most massive progenitor of each galaxy and record its properties.
The result is given in Fig. 11, which shows the expected median redshift evolution of several properties characterizing spheroid progenitors. We show results for three subset of galaxies classified at z = 0 by having 10 < log Mstar < 10.3 (long-dashed lines), 11 < log Mstar < 11.3 (solid lines) and log Mstar > 11.5 (dotted lines). All galaxies have B/T > 0.7 at z = 0. The model predicts that the progenitors’ half-mass radii shrink when moving to higher redshifts (top panel; note that we are here plotting progenitors identified from the merger trees, while before we always considered different galaxies of the same stellar mass at different epochs). Notably, all galaxies that end up being large spheroids in the local Universe are predicted to share, on average, quite similar size evolutions, at least at z ≲ 1.5–2, though different morphologies at higher redshifts.
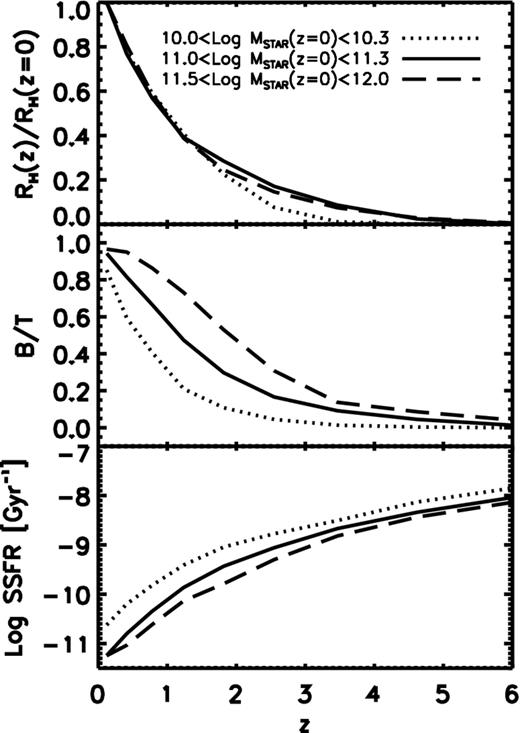
Evolution with redshift of the average properties of a subset of 100 galaxies derived by following the most massive progenitor back in time along its merger tree. We show results for three subsets of galaxies classified by having at z = 0 10 < log Mstar < 10.3 (long-dashed lines), 11 < log Mstar < 11.3 (solid lines) and log Mstar > 11.5 (dotted lines). All galaxies have B/T > 0.7 at z = 0. The top panel shows the median fractional size evolution, the middle panel the average bulge-to-total ratios and the bottom panel the SSFR.
We find that most of the progenitors of bulge-dominated galaxies at high redshifts are disc-dominated (middle panel). More specifically, galaxies that today lie below the characteristic mass of 1011 M⊙ are found to turn into disc-dominated systems at z ∼ 1.5–2, with B/T ≲ 0.2, and extremely gas-rich (Fig. 2). Even more massive galaxies with stellar mass at z = 0 in the range 1011 < Mstar/ M⊙ ≲ 2 × 10¹¹ M⊙ rapidly turn into discs with a median B/T ∼ 0.3. In fact, we found that only 20 per cent of the galaxies in this mass regime remain bulge-dominated with B/T ≳ 0.7 at higher redshifts, with the majority turning into disc systems with B/T ∼ 0.5 by z ≳ 1.5–2.
The model also predicts that at all redshifts the most massive galaxies are the least star-forming galaxies, up to an order of magnitude at z ≲ 2 (bottom panel). The model therefore suggests that the observed high-redshift gas-rich, star-forming and clumpy discs (e.g. Förster Schreiber et al. 2011) may be good candidates for being progenitors of today's intermediate massive, early-type galaxies with Mstar(z = 0) ≲ 1011 M⊙, while the compact and red galaxies should end up being the most massive ellipticals we observe in the local Universe. Full exploration of high and low number densities of galaxies of a given property will help to further constrain the model (see Section 4.3).
We also note that beyond z ≳ 2 galaxies are observed to show a flattening of their specific star formation rate (SSFR; e.g. González et al. 2011), while the predicted SSFR still continues to raise beyond z = 2 (bottom panel). Solving the discrepancy between model and data is beyond the scope of the present paper. We note, however, that it is a common feature of many galaxy formation models, and it has been recently pointed out and discussed by Khochfar & Silk (2011) and Weinmann, Neistein & Dekel (2011).
Fig. 12 shows the fractional average mass (left) and size (right) growth of the subsets of galaxies discussed in Fig. 11. Long-dashed, solid and dotted lines refer, respectively, to the fractional cumulative growth down to z = 0 as a function of final stellar mass, experienced by galaxies via major mergers, minor mergers or any other mechanism (such as disc instability and/or in loco star formation). We find that the massive spheroids considered here mainly grow through mergers in the model. Above Mstar ≳ 1011 M⊙, these galaxies grow more than ≳ 50 per cent of their final stellar mass and size via minor mergers, while major mergers dominate the growth at lower masses and become progressively less important at higher masses (e.g. Khochfar & Silk 2009). This is expected given that the median accretion history of their typical host dark matter haloes, in the range 1012–1013 h− 1 M⊙, is found in high-resolution numerical simulations to be dominated by mergers with satellites that are ∼ 10 per cent of the final halo mass (e.g. Stewart et al. 2008).
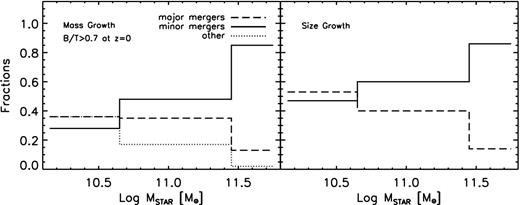
Fractional average mass (left) and size (right) growth of the subsets of galaxies discussed in Fig. 11. Long-dashed, solid and dotted lines refer, respectively, to the fractional cumulative growth down to z = 0 as a function of final stellar mass, experienced by galaxies via major mergers, minor mergers or any other mechanism (disc instability, star formation, etc.).
We also find that most of the minor mergers, especially in the most massive galaxies, are dry, i.e. have a (cold) gas mass fraction in the progenitors that is lower than 0.15. Minor dry mergers can roughly preserve the projections of the FP (e.g. Ciotti, Ostriker & Proga 2009, and references therein) and galactic central densities (e.g. Cimatti et al. 2008; Bezanson et al. 2009, and references therein), though they may also increase the scatter in the scaling relations (e.g. Nipoti et al. 2009, and references therein). The findings of Fig. 12 are consistent with an inside-out evolutionary scenario, where stellar matter is continuously added to the outskirts of the compact high-redshift galaxies as time goes on (e.g. Naab et al. 2009; Oser et al. 2010). More detailed comparisons with metallicity, age and colour gradients are needed to set this model on firmer foots (see discussion in Section 4.3).
4.2 Comparison with other models
While all galaxy formation models have discussed predictions for stellar mass distributions, just a handful have taken a step further to also consider structural properties, especially for early-type galaxies.
Khochfar & Silk (2006b), within the context of a full SAM, emphasized the role of gas dissipation in mergers in forming compact massive spheroids at high redshifts, deriving progenitors’ gas fractions in good agreement with the ones discussed here.
Almeida, Baugh & Lacey (2007) and Almeida et al. (2008), following Cole et al. (2000), studied the galaxy size–mass and global FP relations predicted by two significantly different renditions of the galform SAM by Baugh et al. (2005) and Bower et al. (2006). After varying most of the parameters relevant for determining bulge sizes, they concluded that both models fail to reproduce the sizes of bright early-type galaxies, though they noted that a better match to the data was achieved with no adiabatic contraction (e.g. Tissera et al. 2010; Covington et al. 2011), as assumed in this work. On a similar note, González et al. (2009), following Almeida et al. (2007), further studied the galaxy size–mass relations in the galform models varying other parameters, such as orbital energy in the merger, but still found significant disagreement with the data.
Shankar et al. (2010a,b) showed that the size–mass relation at z = 0 predicted by the Bower et al. model is much flatter than the observed one due to too large low-mass galaxies with stellar mass Mstar ≲ 1011 M⊙, similar to what found here. They suggested that the latter problem may be linked to the initial conditions, given that large and low-mass galaxies are present at all epochs in the model, in line with what discussed here.
We have also adapted the recipes for bulge size growth via mergers and disc instability discussed in Section 2.2 to a previous version of the Munich code by De Lucia & Blaizot (2007). The latter differs from the Guo et al. (2011) version in several respects, from physical recipes to values of the best-fitting parameters. We have checked, however, that most of the results discussed here remain globally similar.
Monaco et al. (2007) implemented the recipes from Cole et al. (2000) for size growth in their MORGANA model (with no dissipation), finding acceptable agreement with the local size–mass relation for early-type galaxies, though with a scatter larger than the observed one (see their fig. 16). Understanding the success of the latter model with respect to the previous mentioned ones relies on pinning down the differences in the physical inputs of the MORGANA model and the impact they have on size evolution.
Another work aimed at studying the global structural properties of local early-type galaxies through semi-analytic techniques was pursued by Cirasuolo et al. (2005), within the framework of the Granato et al. (2004) model for the co-evolution of supermassive BHs and their host massive spheroids. Cirasuolo et al. showed that by tightening velocity dispersion of spheroids to the virial velocity at the epoch of their formation (see also Loeb & Peebles 2003), the local early-type velocity dispersion function (Sheth et al. 2003; Shankar et al. 2004; Bernardi et al. 2010) and Gaussian dispersion in sizes were fully recovered. Their study is quite intriguing as the match to the photometric and dynamical properties of local ellipticals only relies on galaxy properties at virialization epoch and minimizes the role of later merger events.
A more refined theory of structural evolution of spheroids besides mergers has been presented by Fan et al. (2008, 2010). As anticipated in Section 1, this class of models explains size evolution of spheroids via expansion consequent to the blowout of substantial amounts of mass via quasar and/or stellar feedback (Fan et al. 2008, 2010; Damjanov et al. 2009). Numerical support to the latter models was recently provided by Ragone-Figueroa & Granato (2011), who showed that even in the presence of dark matter, baryons can indeed expand by a factor of a few consequent to substantial mass losses. They also pointed out that the puffing up via expansion may be too rapid with respect to the old ages measured for the compact high-z early-type galaxies. Understanding the actual role played by expansion versus mergers is beyond the scope of the present work. However, we discussed in Section 3.5 that the strong size evolution for the most massive ellipticals claimed by some observational groups (Huertas-Company et al. 2012; Newman et al. 2012; Ryan et al. 2012) can hardly be reproduced in our only-merger model, and possibly some extra expansion (a factor of ∼ 2) in the first phases of evolution might help.
Relevant numerical work has been pursued in the last years to explore the size evolution of spheroids in a full cosmological context. We recall here the work by Naab et al. (2009) and Oser et al. (2010, see also Scannapieco et al. 2011), who developed high-resolution hydrodynamical cosmological simulations of massive spheroidal galaxies. They particularly emphasized that galaxies above the characteristic mass of Mstar ≳ 1011 M⊙ can accrete via minor merger about 80 per cent of their final stellar mass, in agreement with what found here (Fig. 12).
4.3 General issues and additional constraints
In this work, we emphasized the role of gas dissipation as a viable mechanism to shrink bulge sizes, especially in lower mass galaxies, thus improving the match to a variety of different observables. Gas dissipation is indeed a natural outcome of gas-rich mergers and thus should be properly included in complete models of galaxy formation. Nevertheless, we cannot rule out that part of the discrepancy between model predictions and data, especially regarding the match with the size–mass relation (Section 3.2), could also be induced by some other wrong model inputs. For example, it has been recognized that this SAM, like several others, overproduces the stellar mass function at high redshifts and low stellar masses (e.g. Henriques et al. 2012). This in turn implies more massive and larger galaxies in lower mass haloes with respect to what expected from, for example, cumulative abundance matching arguments (Moster, Naab & White 2012), thus possibly contributing to the flattening at low masses in the size–mass relation (Section 3.1). Besides the actual performance of the model in properly predicting the size–mass relation, we nevertheless stress that gas dissipation can improve the match to several other observables, as discussed above and further in Appendices A–D (e.g. size–age relation, correlations with velocity dispersion, etc.).
In this work, we have focused our attention on the most relevant median scaling relations among structural properties of bulged galaxies. It is clear, however, that several other properties are equally important to pin down and better constrain the viable models.
First of all, it is fundamental for a model not only to produce the correct structure but also the correct number of galaxies of a given type. Galaxy formation models have most seriously investigated the match to the stellar mass function, finding good agreement adopting different physical prescriptions (e.g. Cole et al. 2000; Benson et al. 2003; Granato et al. 2004; Croton et al. 2006), though significant uncertainties still affect high- and low-redshift measurements (Marchesini et al. 2009, 2010; Bernardi et al. 2010).
The study of number densities in other properties such as size is still at its infancy. The first study was carried out by Cole et al. (2000). A more recent attempt has been carried out by Shankar et al. (2010a), who compared detailed predictions from hierarchical models with the latest releases of the Φ(Re) galaxy size function, finding that the Bower et al. (2006) model overpredicts the number of very compact and very large galaxies (see also Trujillo et al. 2009; Taylor et al. 2010).
Higher redshift measurements of portions of the size function of spheroids are also now becoming available (e.g. Mancini et al. 2009; Saracco et al. 2010; Valentinuzzi et al. 2010a; van Dokkum et al. 2010). At higher redshifts, the scatter in sizes at fixed stellar mass apparently seems to increase as large and compact galaxies seem to co-exist at the same epoch (e.g. Mancini et al. 2010; Saracco et al. 2011). This increase in scatter may suggest a faster evolution in sizes at fixed stellar mass (Fan et al. 2010), although trends between size and age/star formation rate may bias this result (e.g. Förster Schreiber et al. 2011; Mosleh et al. 2011; Saracco et al. 2011).
In order to use number density measurements of size and velocity functions (Cirasuolo et al. 2005) at different redshifts, a homogeneous and well-studied spectroscopic and photometric sample of galaxies is needed, now not yet released. Larger statistical samples will become available in the near future (such as multiwavelength optical surveys from the Canada–French–Hawaii Telescope and the Next Generation Virgo Cluster Survey).
Ages, colours, metallicities and other dynamical properties (e.g. Cappellari et al. 2009) can be key observables to probe galaxy evolution. For example, Bernardi et al. (2011a,b), making use of the latest SDSS data releases, showed that all correlations with stellar mass steepen above Mstar ≳ 2 × 10¹¹ M⊙ (see also Fasano et al. 2010; van der Wel et al. 2011), while relations with velocity dispersion do not. Bernardi et al. claimed, in line with other observational works (e.g. Kauffmann et al. 2004; van der Wel et al. 2009) and with the results presented in Fig. 12, the presence of two mass scales, one at Mstar ∼ 3 × 10¹⁰ M⊙, below which gas dissipation controls galaxy formation, and a higher mass scale Mstar ≳ 2 × 10¹¹ M⊙, above which mergers dominate the evolution. The empirical mass scales noted by Bernardi et al. are in line with the characteristic masses Mc and Ms emphasized in Section 3.1. Metallicity gradients have been recently calibrated by a number of groups (e.g. Foster et al. 2009; Spolaor et al. 2010; Forbes et al. 2011) and can provide invaluable insights into the evolutionary patterns of early-type galaxies (e.g. Di Matteo et al. 2009; La Barbera & de Carvalho 2009).
5 CONCLUSIONS
Understanding structural evolution of spheroids has become one of the hottest topics in cosmology in the last years as it can provide invaluable insights into the true physical processes that regulated galaxy evolution. While angular momentum conservation may explain many properties of discs, the origin of bulges is still largely debated. The situation is even more puzzling given that at higher redshifts galaxies present further disparate structural and physical properties, from clumpy star-forming discs, to very compact, red and massive galaxies. Such a complicated zoology is difficult to reconcile within a coherent framework of galaxy formation, and in fact we discussed in Section 1 that models sometimes propose conflicting scenarios.
Our aim in this work was to study the predictions of a state-of-the-art hierarchical model of galaxy formation, which evolves the sizes of spheroids via mergers and disc instabilities, against the most recent local and high-redshift data. To this purpose, we updated the source code of the latest release of the Munich semi-analytic galaxy formation model by Guo et al. (2011), by modifying the computation of bulge radii exploring a variety of possibilities, and added the calculation of the coupled velocity dispersions. In order to properly compare model predictions with available data, we made use of a large sample of early-type galaxies from SDSS for which bulge-to-disc decompositions have been performed both via the SDSS automated ‘on-the-fly’ analysis and by applying a detailed fitting code.
Our main results can be summarized as follows.
Sizes are computed in the model via energy conservation in dissipationless mergers. Taking the model at face value at masses below Ms ≲ 1011 M⊙, the model predicts a flattening of the size–mass relation at variance with the data, already at z ∼ 2.
Following the results of hydrosimulations, we have included the energy dissipated in gas-rich major mergers in the energy budget. This modification produces progressively more compact remnants with decreasing stellar mass, proportionally to the fraction of cold gas in the progenitors, improving the match with a variety of observables.
We confirm and discuss evidence for two characteristic masses. One is at Mc ∼ 3 × 10¹⁰ M⊙, below which the initial bulge sizes are controlled by dissipation (higher gas fractions) and then evolve under mergers and disc instabilities. Galaxies above Ms ≳ 1011 M⊙, instead, mainly grow through minor dry mergers, especially at z < 1 (Fig. 12).
We find that the global scatter (1σ uncertainty) in sizes at fixed stellar mass for galaxies with B/T > 0.7 is comparable, though systematically higher by ≲ 40 per cent than the observed one. The predicted amount of scatter for galaxies with stellar mass Mstar ≳ 3 × 10¹⁰ M⊙ does not depend much on dissipation and/or amount of orbital energy in the merger.
Spheroids are predicted to be, on average, more compact at higher redshifts at fixed stellar mass. More specifically, at fixed B/T a nearly mass-independent relatively mild decrease in sizes is predicted, in possible disagreement with some observations.
The model predicts that environment plays a significant role in defining the structural properties of bulged galaxies. (Central) galaxies residing in denser environments are predicted to undergo more mergers, thus evolve faster and end up having larger sizes at fixed stellar mass.
The progenitors of the massive spheroids with Mstar ∼ (1–2) × 1011 M⊙ today with B/T > 0.7 are predicted to be compact, low star-forming z ∼ 2 protogalaxies with a median B/T ∼ 0.3, with only ∼ 20 per cent remaining bulge-dominated. The progenitors of lower mass spheroids with B/T > 0.7 tend to be closer to the star-forming and gas-rich protodiscs observed at similar redshifts.
Finally, we also discuss a number of related issues (in the text and in Appendices A–D), ranging from the correlations with galaxy age, with central BH mass, with velocity dispersion, to the scaling relations of pseudo-bulges.
FS warmly thanks Enzo Gattorno for his kind and helpful support. We thank Bruno Henriquez and Gerard Lemson for many useful inputs. We thank Guinevere Kauffmann and Simon White for making the source code of the Munich model available to us to properly carry out this work and for general comments. We also thank Qi Guo, Luca Ciotti, Luca Graziani, Sadegh Khochfar, Juan González, Frederic Bournaud, Simone Weinmann, Ravi Sheth, Luigi Danese, Andrea Lapi, Alister Graham, Eyal Neistein, Fabio Fontanot, Silvia Bonoli, Thorsten Naab, Avishai Dekel and Matt Covington for several interesting discussions. We thank Dimitri Gadotti and David Fisher for providing us their data on pseudo-bulges. FS acknowledges support from the Alexander von Humboldt Foundation and partial support from a Marie Curie grant. MB is grateful for support provided by NASA grant ADP/NNX09AD02G. We thank the referee for a useful report that significantly improved the presentation of the paper.
We note that the behaviour of increasing half-mass radius with B/T at fixed mass is induced by the fact that the model predicts larger bulge and disc sizes with increasing B/T. We verified that just the opposite is true for disc-dominated galaxies with B/T ≲ 0.3–0.5, in agreement with observations.
The apparent flattening of the measured size–mass relation at very low masses Mstar ≲ 1010 M⊙ is most probably induced by contamination of later-type galaxies and thus not relevant for the present discussion (see details in Bernardi et al. 2011b).
We have checked that our conclusions do not significantly depend on the exact profile chosen for the bulges. For example, we find broadly similar results, although somewhat steeper correlations at the highest stellar masses, when assigning to each spheroid a Sérsic index according to their luminosity following, for example, the empirical relation by Terzić & Graham (2005), and then converting from RH to Re using the appropriate S(n).
We stress here that a model with α ≠ 0 in the merger cannot reproduce the tilt of the FP discussed in Appendix C, which requires a halo mass-dependent velocity dispersion.
REFERENCES
APPENDIX A: RELATION WITH AGE
Although a large number of massive early-type galaxies at high redshifts have been observed to be more compact and with higher velocity dispersion than their local counterparts, still a significant fraction is seen to be already evolved. Mancini et al. (2009) suggested a downsizing scenario in sizes, with the most massive galaxies approaching the local size–mass relation earlier than less massive ones. Cappellari et al. (2009) also discussed that a large fraction of their galaxies at 1.4 ≲ z ≲ 2 with velocity dispersion from stacked spectrum are consistent with the most dense local galaxies of the same mass. Saracco et al. (2011) showed that at the average redshift of z ∼ 1.5 older galaxies at fixed stellar mass tend to lie a factor of ∼ 2–3 below the size–stellar mass relation characterizing local early-type galaxies, while younger galaxies are consistent with it. The latter type of observations introduced the concept of assembly bias, i.e. the youngest galaxies at any epoch may be larger than their older counterparts of similar stellar mass (but see Whitaker et al. 2012).
In the local Universe, the assembly bias seems instead to be erased, at least above Mstar ∼ 1010 M⊙ and large B/T. Shankar & Bernardi (2009), Shankar et al. (2010b) and Bernardi et al. (2010) showed from a large sample of early-type galaxies extracted from SDSS that old and young galaxies of similar stellar mass share similar sizes, i.e. the size–age relation is rather flat. Trujillo et al. (2011), more recently, confirmed these results showing that the size–age relation is flat already at z ∼ 1. When moving to lenticular galaxies with lower B/T, the relation gets tilted, with the more compact bulges being the oldest (e.g. van der Wel et al. 2009; Bernardi et al. 2010). Whatever mechanism puffs up spheroids must be fine-tuned to allow all galaxies of a given stellar mass to end up on the same size–mass and size–age relations in the local Universe.
Preliminary theoretical studies to interpret the size–age relation were performed by Shankar et al. (2010b) within the context of the Bower et al. (2006) hierarchical model. Their study showed that because older galaxies usually undergo more mergers, they naturally grow more and are able to ‘catch up’ with the younger ones, producing a rather flat size–age relation. Here we want to extend the preliminary study by Shankar et al. (2010b) to the case of the present hierarchical model that, at variance with the Bower et al. one, includes dissipation and better matches the local size–mass relation. We will focus here only on the predicted size–age relation in the local Universe. At redshifts z ≳ 1–1.5, the spread in ages becomes too small at fixed stellar mass and, along with its large scatter, does not provide any meaningful prediction to compare with the data.
Fig. A1 shows the predicted median size of galaxies of a given stellar mass as a function of mass-weighted age for different B/T thresholds. For lower masses (left-hand panel), the model predicts that in the absence of dissipation (dotted lines) more compact galaxies are also the oldest ones. This is mainly induced by redshift evolution in the sizes of the progenitors that shrinking at higher redshifts (Fig. 7) produce more compact early-type remnants. Including dissipation (solid lines) flattens the size–age relation out. As discussed above, dissipation acts in a way to reduce sizes proportionally to the gas fractions in the progenitors. Within a given mass bin, the lower mass galaxies have, on average, higher fgas, thus suffering more dissipation than the galaxies lying closer to the more massive end of the bin. Thus, in this model both mergers and dissipation act in a coordinated way to flatten out the relation.
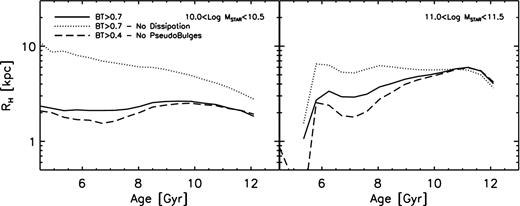
Predicted median size of galaxies of a given stellar mass as a function of mass-weighted age for different B/T thresholds, and with and without dissipation included, as labelled. This relation for bulge-dominated galaxies is flat at fixed stellar mass, as observed in the local Universe (e.g. Shankar et al. 2010b).
At higher masses (right-hand panel), the inverse relation of sizes with age disappears, even in the absence of dissipation. In fact, including dissipation slightly steepens the relation. These results are all in broad agreement with what observed in SDSS. However, there are also some discrepancies. As anticipated above, data on lenticulars, or in general galaxies with lower B/T values, seem to follow a different trend, with older galaxies being more compact (Bernardi et al. 2010). As seen in Fig. A1, however, the model seems not to show any significant change in the shape of the size–age relation when lowering the B/T threshold (long-dashed lines; only galaxies with bulges mainly grown through mergers are considered here). This inconsistent behaviour needs to be further understood both observationally and theoretically.
APPENDIX B: PROPERTIES OF PSEUDO-BULGES
There is increasing empirical evidence that not all bulges in the local Universe can be formed via mergers (e.g. Kormendy & Kennicutt 2004; Fisher & Drory 2008; Gadotti 2009). Recent works suggest in fact that a large fraction, possibly the majority of local bulges, are pseudo-bulges (Fisher & Drory 2011), with well-defined properties different from those of classical bulges of similar mass. Pseudo-bulges are usually characterized by younger stellar populations, they are usually rotation rather than pressure supported, have less concentrated surface brightness profiles and tend to follow well-distinct scaling relations in their global structural properties with respect to classical bulges.
In particular, pseudo-bulges are found to be much more compact by a factor of a few at fixed stellar mass with respect to classical bulges. The open triangles and circles in Fig. B1 are the measured sizes of pseudo-bulges from the samples of Gadotti (2009) and Fisher & Drory (2010), respectively. Both their stellar mass measurements have been converted to a common initial mass function using the tabulated values in Bernardi et al. (2010). It is interesting to note that despite the completely independent and different methods utilized, these groups agree in finding that pseudo-bulges are more compact by a factor of a few.
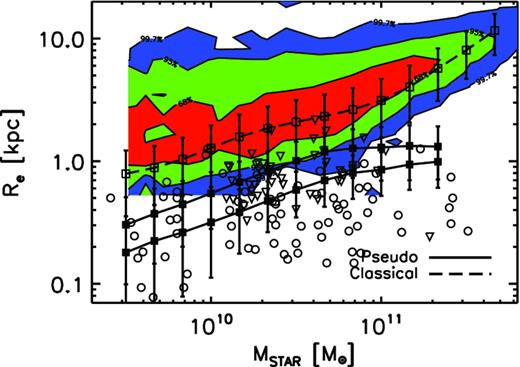
Predicted median effective radius as a function of stellar mass for bulges with sizes grown mainly by mergers (long-dashed line with their 1σ dispersion), and bulges mainly grown via disc instability (solid lines). The classical bulges are shown for B/T > 0.5, while the upper and lower solid lines refer to pseudo-bulges with B/T > 0.2 and > 0.5, respectively. The coloured contours are the SDSS subsample with corresponding B/T > 0.5, while the triangles and circles are pseudo-bulges measurements from Gadotti (2009) and Fisher & Drory (2010), respectively, with no cut on B/T.
The model predicts a size–mass relation for pseudo-bulges (solid lines and filled squares) – that we here label as those bulges that have grown more than 50 per cent of their final size via disc instability – with a slope and scatter similar to the one predicted for classical bulges (long-dashed line and open squares) but lower in normalization by a factor of a few. The upper and lower solid lines referring to pseudo-bulges with B/T > 0.2 and B/T > 0.5, respectively, are compared with data by Gadotti (2009, triangles) and Fisher & Drory (2010, circles), with no cut on B/T. The predictions are in good agreement with the data, and even more so given that no fine-tuning was imposed in the model parameters. The model also predicts that no pseudo-bulges are found above Mstar ≳ 2 × 10¹¹ M⊙, again in line with the data. As discussed above, we stress that most of the pseudo-bulges produced in the model have B/T < 0.7.
More specifically, Fig. B2 shows that the fraction of all pseudo-bulges (cyan lines) and classical (red lines) bulges (here all bulges are considered) are a non-trivial function of stellar mass. The fraction of pseudo-bulges tends to peak around Mstar ∼ 5 × 10¹⁰ M⊙, and sharply decreases at higher masses, where the contribution of classical bulges dominates. This behaviour is in good agreement with the recent study by Fisher & Drory (2011, see also Kormendy et al. 2010), who presented an inventory of galaxy bulge types in a volume-limited sample within the local 11 Mpc volume using Spitzer and HST data (see their fig. 3). Theoretically, this is expected because mergers dominate the size evolution above the characteristic mass of 1011 M⊙, as anticipated in Section 3.1 and further developed in Section 4.1. On the other hand, Fisher & Drory (2011) also claim that pseudo-bulges tend to be the dominant class of bulges at lower masses, being close to 60 per cent around Mstar ∼ 1010 M⊙. The model instead predicts a lowering of the fraction of pseudo-bulges towards lower masses. More detailed observational and theoretical studies of pseudo-bulges in the low-mass regime, beyond the scope of the present paper, are needed to fully understand this discrepancy.
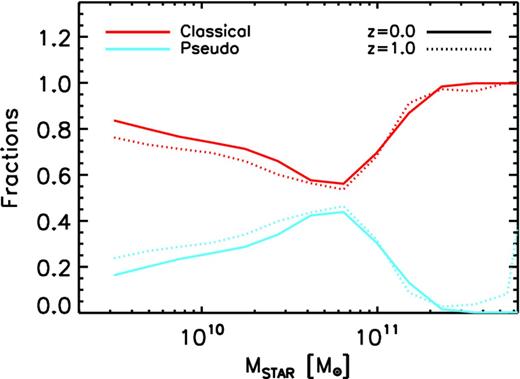
Fraction of pseudo-bulges (cyan lines) and classical bulges (red lines) as a function of stellar mass for redshift z = 0 (solid lines) and z = 1 (dotted lines). There is a tendency to have an increasing fraction of pseudo-bulges at lower stellar masses in broad agreement with the data.
APPENDIX C: THE TILT OF THE FUNDAMENTAL PLANE
Early-type galaxies obey a tight scaling relation linking σ, Mstar and Re, the so-called FP, as expected from basic virial arguments (e.g. Djorgovski & Davis 1987). If the mass-to-light ratio is constant at all masses, i.e. L∝Mdyn, from the virial relation one would then simply expect L∝σ2Re. However, the observed FP relation has small but significant departures from the theoretical predictions, suggesting that Mdyn/L has a non-trivial dependence on mass. This ‘tilt’ of the FP is possibly a consequence of stellar effects and/or progressive difference in the inner dark matter content of the most massive galaxies (e.g. La Barbera et al. 2008, 2010; Tortora et al. 2009; Graves & Faber 2010; Napolitano, Romanowsky & Tortora 2010; Tortora, Romanowsky & Napolitano 2012).
Shankar & Bernardi (2009) showed from a large sample of SDSS early-type galaxies that the ratio Mdyn/Mstar∝Mγstar, with γ ≈ 0.13, i.e. it increases with increasing Mstar, in a way approximately independent of the age of the galaxies. The left-hand panel of Fig. B3 shows the predicted ratio of dynamical mass to stellar mass as a function of stellar mass for galaxies of different (mass-weighted) age at z = 0 and with B/T > 0.9. In agreement with the SDSS data, the model correctly predicts a positive tilt in the FP relation very similar to the observed one (red long-dashed line) and with weak dependence on age. The parametrization adopted in equation (5) naturally induces a tilt because lower mass galaxies have proportionally smaller sizes, therefore lower dark matter fractions within RH, thus proportionally lower velocity dispersions. The right-hand panel of Fig. B3 shows that the tilt is predicted to decrease at higher redshifts because galaxies at higher redshifts are associated with less massive dark matter hosts and also more compact galaxies, thus, again, proportionally lower dark matter fractions within RH. The scatter of FP is measured to be small; thus, it is an important quantity to compare models with. However, a detailed study of the FP scatter is beyond the scope of this brief appendix, and we will postpone it to future work.
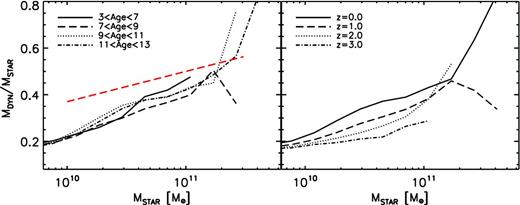
Predicted ratio of dynamical mass to stellar mass as a function of age at z = 0 (left) and at different redshifts (right). The red long-dashed line is the tilt measured by Shankar & Bernardi (2009). The tilt of the FP is predicted to be rather independent of galaxy age at z = 0 and to flatten out at z > 0.
APPENDIX D: THE CONNECTION WITH THE CENTRAL BLACK HOLE: EVOLUTION IN SCALING RELATIONS
Dynamical observations have revealed that supermassive BHs are ubiquitous at the centres of most, if not all, local massive, bulge-dominated galaxies, with their mass Mbh ∼ 106–109 M⊙, tightly correlated with the mass and velocity dispersion of the host bulge (see Ferrarese & Ford 2005; Shankar 2009, for recent reviews). It is therefore natural that constraining the evolution of massive spheroidal systems contemporarily implies understanding the origin and evolution of BHs and of such tight scaling relations.
The Munich SAM self-consistently follows the evolution of BHs during the hierarchical evolution of galaxies. The model assumes that a fixed fraction of the cold gas is destabilized during merger events and feeds the central BH (see e.g. Marulli et al. 2008, for details). A parameter controls how much gas mass is funnelled on to the central BH and it is fine-tuned to reproduce the local Mbh–Mstar relation. The model has been found to be consistent with AGN luminosity functions and quasar clustering at different redshifts and luminosities (see details in Marulli et al. 2008, 2009; Bonoli et al. 2009, 2010).
The left-hand panel of Fig. D1 shows the Mbh–σ relation at different redshifts, as labelled, for a model with σ computed with equation (5). For reference, the grey stripe indicates the fit by Tundo et al. (2007) with its intrinsic scatter. The model produces a reasonable match to the data and we have checked that neglecting any halo mass dependence in σ would have produced a flattening similar to the one observed for the Mstar–σ relation in Fig. 9.
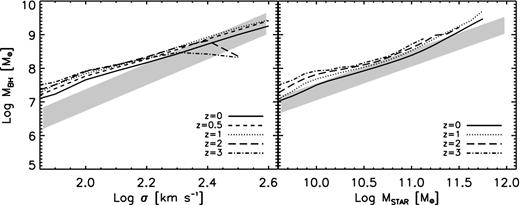
Left-hand panel: predicted Mbh–σ relation at different redshifts, as labelled, for a model with a dark matter mass dependent σ for galaxies with B/T > 0.9. The grey stripe indicates the fit by Tundo et al. (2007) with its intrinsic scatter. Right-hand panel: predicted Mbh–Mstar relation at the same redshifts for galaxies with B/T > 0.9. The grey stripe shows a linear relation of the type Mbh = 2 × 10− 3 Mbulge with some scatter, indicative of what suggested by a variety of local data.
Interestingly, at variance with the evolution found for the Mstar–σ relation, the model predicts a positive evolution for the Mbh–σ relation, i.e. comparable or higher BH masses at higher redshifts at fixed velocity dispersion. This is in line with direct and indirect measurements of the Mbh–σ at higher redshift in quasar host galaxies (e.g. Shields et al. 2006; Woo et al. 2006, 2008; Treu et al. 2007; Gaskell 2009; Shankar, Bernardi & Haiman 2009; Bennert et al. 2011). Though BH host galaxies get more compact and thus possess higher velocity dispersions at higher redshifts, the redshift evolution in the Mbh–σ relation shows the opposite trend.
The reason behind the opposite time behaviour of the two relations can be understood by looking at the right-hand panel of Fig. D1, which shows the predicted Mbh–Mstar relation for the same early-type galaxy subsample. The grey stripe is a linear relation of the type Mbh = 2 × 10− 3 Mbulge with some scatter, indicative of what suggested by a variety of local data (e.g. Marconi & Hunt 2003; Häring & Rix 2004). The overall agreement with the data at z = 0 in the normalization and slope of the Mbh–Mstar relation is mostly a simple consequence of the underlying model that assumes both BH accretion and star formation rate to be proportional to cold gas reservoir. A genuine prediction of the model is instead that the Mbh/Mstar ratio evolves at fixed stellar mass, possibly in a mass-dependent way, increasing by a factor of a few at higher redshifts (see also Croton 2006), consistently with what derived by many groups (e.g. Decarli et al. 2010). Thus, the model predicts higher velocity dispersions but also more massive BHs at fixed stellar mass at higher redshifts, in a way to erase or even reverse the predicted evolution in the Mbh–σ relation, in good agreement with the data. In other words, while most of the BH mass is accreted during the high-z gas-rich merger phase, the growth of the stellar mass and velocity dispersion of the host spheroid are prolonged to later times.
