


Abstract
The absorbed doses deposited by boron neutron capture therapy (BNCT) can be categorized into four components: α and 7Li particles from the 10B(n, α)7Li reaction, 0.54-MeV protons from the 14N(n, p)14C reaction, the recoiled protons from the 1H(n, n) 1H reaction, and photons from the neutron beam and 1H(n, γ)2H reaction. For evaluating the irradiation effect in tumors and the surrounding normal tissues in BNCT, it is of great importance to estimate the relative biological effectiveness (RBE) for each dose component in the same framework. We have, therefore, established a new method for estimating the RBE of all BNCT dose components on the basis of the microdosimetric kinetic model. This method employs the probability density of lineal energy, y, in a subcellular structure as the index for expressing RBE, which can be calculated using the microdosimetric function implemented in the particle transport simulation code (PHITS). The accuracy of this method was tested by comparing the calculated RBE values with corresponding measured data in a water phantom irradiated with an epithermal neutron beam. The calculation technique developed in this study will be useful for biological dose estimation in treatment planning for BNCT.
INTRODUCTION
Boron neutron capture therapy (BNCT) is a binary treatment modality that was advocated by Locher in 1936 and that can selectively target tumor tissues []. The two particles (an α particle and a lithium (7Li) particle) generated in the neutron capture reaction with boron) have high linear energy transfer (LET) and a short range (of the order of one cell diameter). In principle, BNCT allows the preferential destruction of 10B-loaded tumor cells, sparing normal tissues without 10B.
The radiation field of BNCT produced in normal tissues and tumors consists of a mixture of several particles, such as neutrons, protons, photons, α particles and 7Li particles. In the estimation of the physical dose, these particles are categorized into four major dose components []: α particles and 7Li particles from the 10B(n, α)7Li reaction, 0.54-MeV protons from the 14N(n, p)14C reaction, the recoiled protons from the 1H(n, n) 1H reaction, and photons from the neutron beam and 1H(n, γ)2H reaction; these dose components are called the boron, nitrogen, hydrogen and gamma doses, respectively, in this paper. The boron dose from the neutron capture reaction accounts for the majority of the biological effect in tumor tissues []. The other dose components deliver background doses (from a mixture of high- and low-LET radiation components) to both normal and tumor tissues [].
In order to estimate the treatment effect, the physical dose needs to be converted to the biological dose. Therefore, each of the four major dose components is multiplied by their relative biological effectiveness (RBE), which is determined on the basis of certain endpoints of clinical or experimental irradiation conditions. The RBE of each dose component depends on the variation in the physical dose according to the dose dependence of the cell survival curves. In addition, the RBE of the recoiled proton component depends on the variation in the spectral characteristics of the neutron beam. Therefore, it is necessary to evaluate the biological dose by taking into account the dependence not only on the dose, but also on the neutron spectrum. These dependencies are not currently considered in treatment planning for BNCT. Hence, development of a biological dose estimation model that can take these dependencies into account is needed.
A number of studies based on models that use a microdosimetric cellular scale have been devoted to the evaluation of the biological effectiveness of BNCT. For example, Bond et al. and Gabel et al. proposed the use of a ‘hit size effectiveness function’ (HSEF) that gives a cell survival fraction as a function of the energy deposition in a cell nucleus [5, 6]. The HSEF was implemented in the microdosimetry model developed by Vliet-Vroegindeweij et al., which can calculate the cell survival fraction of all the important high-LET radiation components for BNCT [7]. Santa Cruz et al. developed a model for estimating the biological dose for BNCT, taking into account the synergistic interactions between different radiations [8, 9]. However, none of the existing models can express the RBE of each of the four major BNCT dose components in the same framework. We have, therefore, developed a calculation method for estimating the biological dose for each of the four major BNCT dose components. This method is based on the microdosimetric kinetic (MK) model [10], which was derived from the theory of dual radiation action [11]. The MK model can calculate the cell survival fractions of various charged particles from the probability density of specific energy in a conceptual subcellular (submicron) structure of the cell nucleus (called a ‘domain’). The MK model is adapted to the treatment planning for heavy charged-particle therapy in the Heavy-ion Medical Accelerator in Chiba [12, 13].
In this study, the RBEs of each of the four major dose components were estimated using the MK model. For this purpose, it was necessary to calculate the microscopic probability density of lineal energy, y, in a macroscopic matter. In our method, the probability density of y in the domain was calculated using the microdosimetric function [14] implemented in the macroscopic particle transport simulation code (PHITS) [15]. Detailed procedures based on the MK model for estimating the RBE of each of the four major BNCT dose components are presented herein, together with the results of their verification using a past biological experiment for V79 Chinese hamster cells [16, 17].
MATERIALS AND METHODS
RBE calculation by the MK model
Using the MK model, the cell survival fractions of various charged particles can be estimated from the probability densities of specific energies in the domain. The procedures based on the MK model for estimating the cell survival fraction and RBE for each of the four major BNCT dose components are provided in this section.
If one can determine ρ, rd, α0, y0 and β, the linear coefficient of α for any radiation field can be estimated by calculating d(y, 2rd) in the field. Thus, preceding the calculation of the survival fraction using the MK model, these five parameters should be determined. The domain density ρ can be assumed to be 1.0 g/cm3. The parameter β can be obtained from the survival curve irradiated by a source of reference radiation, such as γ-rays, as mentioned before. The other three parameters rd, α0 and y0 can be determined by substituting the experimentally obtained α parameters for various radiation fields and their d(y, 2rd) values into Eqs. (3) and (4), respectively.
In this study, the parameter β and the other three parameters rd, α0 and y0 for V79 Chinese hamster cells were determined from a past experiment that was performed to measure their cell survival fractions with γ-rays and a neutron beam, respectively. The d(y, 2rd) was calculated using the microdosimetric function in the PHITS code [14]. The details are described below.
Estimation of cell survival fraction for the free-air experiment
To determine the MK model parameters, we estimated the α parameter for the boron, proton and gamma doses by re-evaluating a past experiment measuring the cell survival fraction of V79 Chinese hamster cells incubated with boric acid of 0, 5 and 10 ppm 10B concentrations irradiated with γ-rays from a 137Cs source and an epithermal neutron beam in the Japan Research Reactor No. 4 (JRR-4) [17]. Boric acid serves as a reference boron carrier for the boron dose component because it is assumed that this compound distributes boron atoms uniformly throughout the cell, nucleus and external compartment [21,22]. The biological response of the boron dose component cannot be directly determined from the measured data. To estimate the survival fraction of the boron dose component, we compared the irradiation responses of boronated cells with those of non-boronated cells. The biological responses of protons from nitrogen capture reactions and hydrogen recoils cannot be experimentally distinguished, because they are attributed to protons emitted from the natural composition of the cell nucleus (i.e. unlike the attribution from boron, which is artificially added to the cells). This dose component is termed the ‘proton dose’ in this report. The cell survival fraction of the proton dose component was estimated by comparing cell survival fractions for non-boronated cells irradiated with neutron beams with those irradiated with γ-rays.
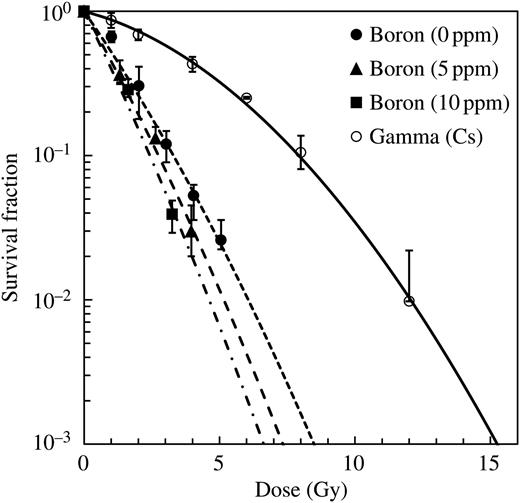
Survival curves for irradiation of V79 Chinese hamster cells with γ-rays and with the epithermal neutron beam in the JRR-4 incubated with boric acid of 0, 5 and 10 ppm 10B concentrations. The data were plotted as a function of the absorbed dose and were fitted by LQ equations.
Determination of MK model parameters
Probability densities of the lineal energy in microscopic sites cannot be directly calculated from the conventional particle transport simulation of the Particle and Heavy Ion Transport code System (PHITS), since it is designed to simulate particle motions on a macroscopic scale and employs a continuous-slowing-down approximation for calculating the energy loss of charged particles. Therefore, a special tally function was introduced into the code for calculating the microdosimetric probability densities (using a mathematical function that can instantaneously calculate quantities around trajectories of charged particles). The function was developed on the basis of track structure simulation, taking into account the productions of δ-rays and Auger electrons [14, 24]. Using this function, we can calculate the probability densities of y for all types of charged particles and target sizes with a precision equivalent to that of the microscopic track-structure simulation.
In our calculation, the probability densities of the deposited energy in water target sites for the boron, nitrogen, hydrogen and gamma doses were calculated separately using the sources defined as follows:
The source of the boron dose was defined as a multiple source, taking into account the branching ratio and initial energies of released particles, i.e. 1.47-MeV α particles and 0.84-MeV Li particles in 93.7% of the events, and 1.78-MeV α particles and 1.01-MeV Li particles in 6.3% of the events.
The source of the nitrogen dose was defined as monoenergetic protons with an initial energy of 0.54 MeV.
The sources of the hydrogen doses were defined as protons for which the energy spectra were the same as those of protons generated in a test tube filled with water and a tissue-equivalent material [25] with a diameter of 4 cm, respectively, irradiated by the epithermal neutron beam in the JRR-4. Here, tissue composition was assumed to be: H (10.1%), C (11.1%), N (2.6%) and O (76.2%) by weight percentage.
The source of the gamma dose was defined as monoenergetic photons with an initial energy of 0.662 MeV.
The parameters necessary in the MK model for estimating the cell survival fraction are β, rd, α0 and y0. The parameter β can be obtained from the survival curve of γ-ray irradiations. The other three parameters, rd, α0 and y0, can be estimated from the least-square fittings of all the experimental data for the free-air condition. These fittings were performed: (i) to calculate the d(y, 2rd) for the boron, proton and gamma doses from the PHITS code using the temporary rd value; (ii) to estimate the α0 and y0 from the least-square fittings of all the experimental data based on Eqs. (3) and (4); (iii) to update the rd value as the minimum condition of the error for the α parameter between the measured and calculated values; and (iv) to go back to procedure (1) until the values of the three parameters were converged.
RBE estimation in a water phantom
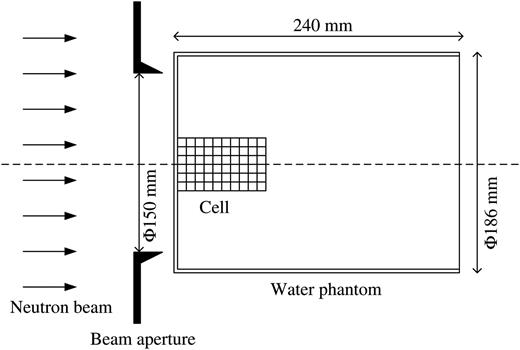
Schematic illustration of the irradiation setup of the water phantom. A container plate with cell suspensions was set on the central axis of the neutron beam. The water phantom, which consisted of PMMA filled with water, was cylindrical and had a diameter of 186 mm and a length of 240 mm. The diameter of the beam aperture was 150 mm.
RESULTS
α value for the free-air experiment
The survival curves for the absorbed dose under free-air conditions both with and without boron are also shown in Fig. 1. The LQ parameters for the γ-ray radiations were determined to be 0.115 ± 0.004 Gy−1 and 0.0220 ± 0.0004 Gy−2 for αγ and β, respectively. The numerical value of αwoB was estimated to be 0.626 ± 0.018 Gy−1, and that of αwtB was estimated to be 0.779 ± 0.024 Gy−1 and 0.895 ± 0.054 Gy−1 for boron concentrations of 5 ppm and 10 ppm, respectively. The value of DwoB/DB obtained was 2.86 and 1.43 for 5 ppm and 10 ppm, respectively. By substituting these parameters into Eq. (8), αB was calculated to be 1.214 ± 0.105 Gy−1 and 1.281 ± 0.133 Gy−1 for 5 ppm and 10 ppm, respectively. However, the αB should be independent of the 10B concentration, and thus we adopted the average value, 1.247 Gy−1, in the following analysis. The parameters αwoB and αγ were estimated to be 0.626 ± 0.018 Gy−1 and 0.115 ± 0.004 Gy−1, respectively. The value of Dγ/Dp obtained was 0.94. By substituting these parameters into Eq. (14), αp was calculated to be 1.106 ± 0.035 Gy−1.
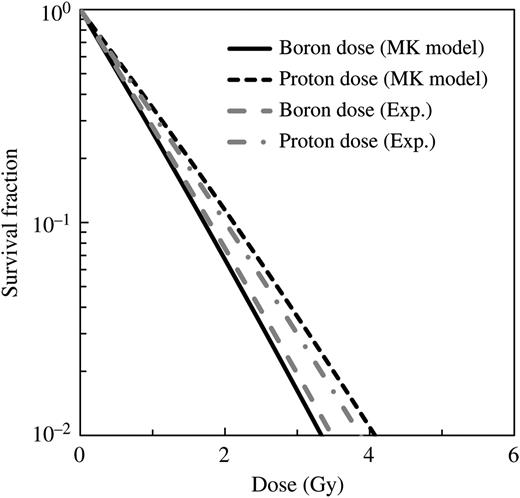
Comparison between the cell survival fraction for boron and proton dose components estimated from the α values obtained by re-evaluating the past experimental results and our simulation using LQ parameters from the MK model.
Determination of MK model parameters
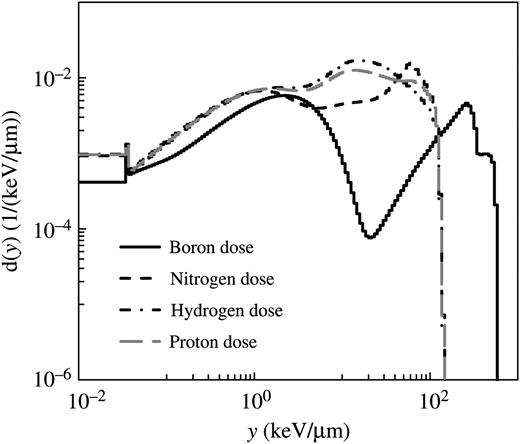
Probability densities of lineal energy, d(y), for the boron, nitrogen, hydrogen and proton doses calculated using the microdosimetric function in the PHITS code.
The parameters necessary in the MK model for estimating the cell survival fraction are β, rd, α0 and y0. The evaluated values for β, rd, α0 and y0 were 0.022 Gy−1, 0.222 μm, 0.052 Gy−1 and 120 keV/ μm, respectively, in this study.
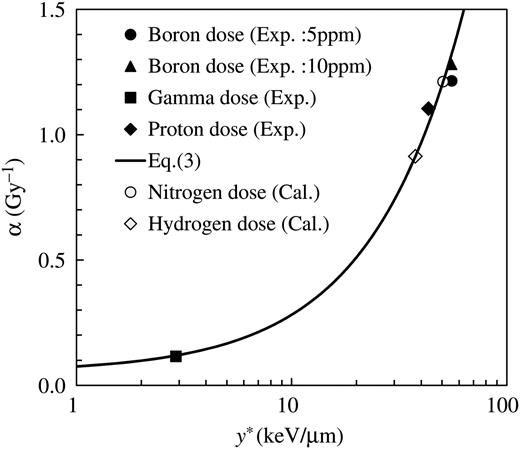
Measured α value for each of the four major BNCT dose components as a function of calculated y*. The solid line and open markers denote the relationship between α and y* expected from Eq. (3).
RBE in a water phantom
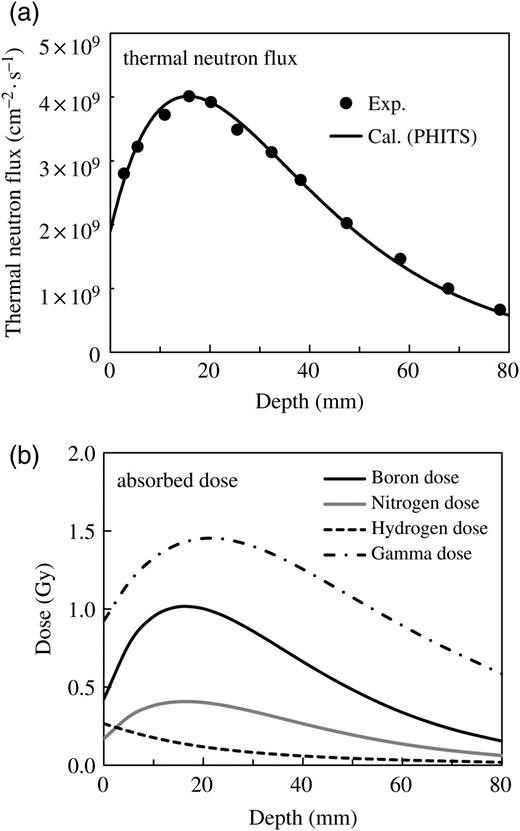
Measured and calculated thermal neutron flux for the incidence of the epithermal neutron beam to the phantom (a), and the calculated contributions from each of the four dose components at a reactor power of 2 MW for 18 min irradiation (b).
Figure 6b illustrates the calculated absorbed dose for each dose component. The boron doses were estimated by setting the boron concentration at 5 ppm. The calculated data were normalized by the same scaling factor used in panel (a). The gamma dose made the dominant contribution to the total dose in this calculated condition, because the boron concentration (5 ppm) was lower than that used in the practical situation of BNCT.
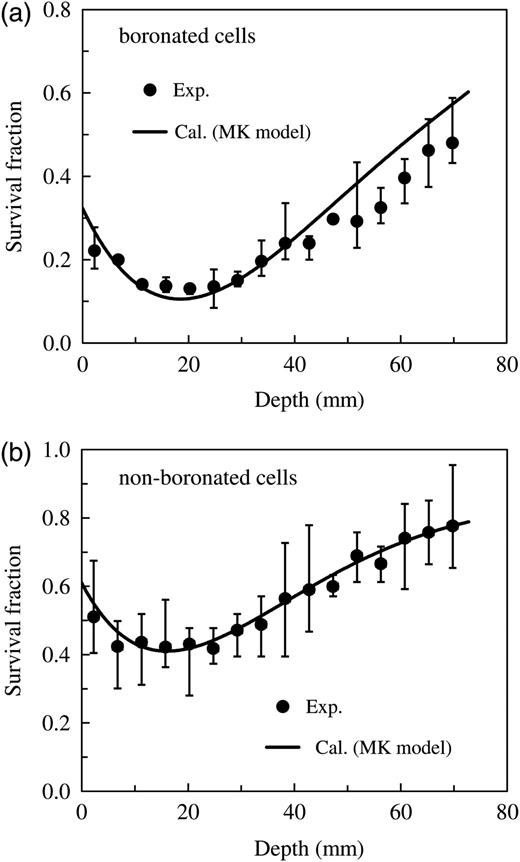
Comparison of the measured and calculated survival fractions of V79 Chinese hamster cells in the water phantom irradiated by the epithermal neutron beam. Panel (a) represents the data for cells with 5 ppm 10B concentration, whereas Panel (b) represents the data for the non-boronated cells.
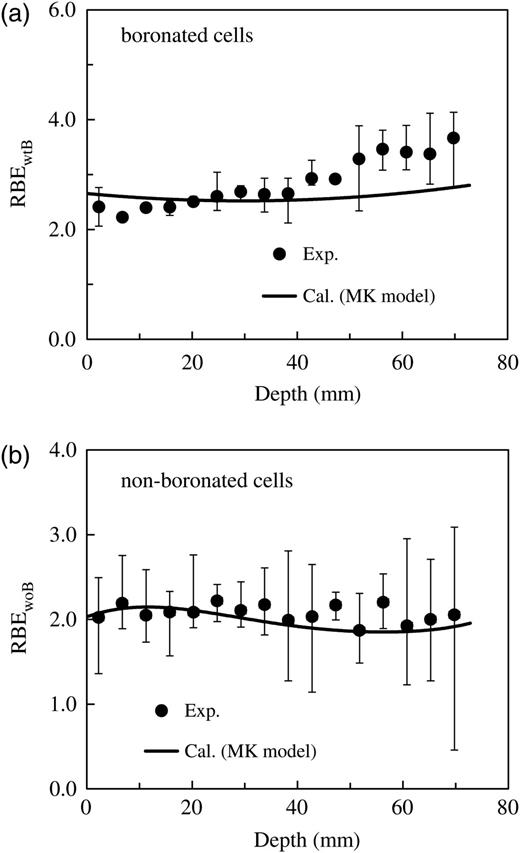
Comparison of the measured and calculated RBEs as an endpoint corresponding to the survival fractions of the V79 Chinese hamster cells in the water phantom irradiated by the epithermal neutron beam (depicted in Fig. 7). Panel (a) represents the data for cells with 5 ppm 10B concentration, whereas Panel (b) represents the data for the non-boronated cells.
DISCUSSION
Cell survival fractions for the free-air experiment
The survival curves of boron and proton doses estimated from the MK model using the obtained parameters are shown in Fig. 3. It is evident from the graphs that the calculated data for both the boron and proton doses agree fairly well with the corresponding measured data. These agreements indicate that the cell survival fraction for the free-air experiment of each dose component can be simply estimated from y* calculated using the MK model.
Boron carrier
Boric acid served as a reference boron carrier for the boron dose component because it is assumed that this compound distributes boron atoms uniformly throughout the cell, nucleus and external compartment [21, 22]. In this study, the RBE of the boron dose component is estimated on the basis of this assumption.
The biological effects strongly depend on the localization of the boron compound because of the short range of the α and Li particles generated in the neutron capture reaction in boron [6]. Therefore, more accurate characterization of the microscopic distribution of the boron compounds and the ability to consider heterogeneous distributions are required. In our model, the approach would be applicable only for compounds that are homogenously distributed throughout the irradiated volume. Therefore, further studies are required to estimate the biological effect, taking into account the microscopic distribution of the boron compounds (e.g. p-boronophenylalanine or sodium borocaptate).
RBE estimation in a water phantom
As can be seen in Figs. 7 and 8, survival fractions and RBEs for various depths in the phantom can be simply estimated from the PHITS simulation coupled with the MK model, whose parameters are determined from the free-air experiment. It is evident from the graphs that the calculated data for both the boronated and non-boronated cells agree fairly well with the corresponding measured data. However, the discrepancies found at positions deeper than 40 mm in Fig. 7a and at both less than 15 mm and deeper than 40 mm in Fig. 8a are probably attributable to experimental uncertainty and the difference between measured and calculated conditions, such as the neutron spectrum in the phantom.
The depth dependences of these data are predominantly attributable to the depth–dose characteristics for the each dose component in the water phantom. In addition, the cell survival fraction and RBE for the hydrogen dose component depends not only on the dose but also on the spectral characteristics of recoiled protons (attributable to variation in the neutron spectrum with depth in the phantom).
We have established a new method based on the MK model for estimating the cell survival fraction or RBE for all BNCT dose components simply from y* calculated using the PHITS code. The RBE values can be determined by taking into account the dependence not only on the dose but also on the neutron spectrum. Using this method, the biological dose can be estimated from the RBE multiplied by the physical dose, which is also calculated using the PHITS code. An advantage of applying this method to treatment planning for BNCT is that it can calculate the required physical dose and RBE for the BNCT dose components in the same framework.
Before using the model practically in treatment planning for BNCT, further studies are required to estimate the biological effect while taking into account the localization of the boron compound in the target cells [6, 8, 27]. It is also necessary to consider the stochastic nature of absorbed doses, not only for the domain but also for the cell nucleus, which is an important concept in high-LET and hypofractionated radiation therapy [28].
CONFLICT OF INTEREST
None of the authors have any conflicts of interest associated with this study.
FUNDING
Funding to pay the Open Access publication charges for this article was provided by Tsukuba University.
