


Abstract
Comparative effectiveness research suggests that conservative management (CM) strategies are no less effective than active initial treatment for many men with localized prostate cancer. We estimate longer-term costs of initial management strategies and potential US health expenditure savings by increased use of conservative management for men with localized prostate cancer. Five-year total health expenditures attributed to initial management strategies for localized prostate cancer were calculated using commercial claims data from 1998 to 2006, and savings were estimated from a US population health-care expenditure model. Our analysis finds that patients receiving combinations of active treatments have the highest additional costs over conservative management at $63 500, followed by $48 550 for intensity-modulated radiation therapy, $37 500 for primary androgen deprivation therapy, and $28 600 for brachytherapy. Radical prostatectomy ($15 200) and external beam radiation therapy ($18 900) were associated with the lowest costs. The population model estimated that US health expenditures could be lowered by 1) use of initial CM over all active treatment ($2.9–3.25 billion annual savings), 2) shifting patients receiving intensity-modulated radiation therapy to CM ($680–930 million), 3) foregoing primary androgen deprivation therapy($555 million), 4) reducing the use of adjuvant androgen deprivation in addition to local therapies ($630 million), and 5) using single treatments rather than combination local treatment ($620–655 million). In conclusion, we find that all active treatments are associated with higher longer-term costs than CM. Substantial savings, representing up to 30% of total costs, could be realized by adopting CM strategies, including active surveillance, for initial management of men with localized prostate cancer.
A major goal of health reform is to reduce the rate of growth of health expenditures while maintaining or improving the quality of care. Comparative effectiveness research (CER) is intended to guide efforts to improve the quality and efficiency of care by comparing the effects of alternative approaches to health care on health outcomes. Such research might reduce expenditures by identifying care that is either ineffective or no more effective than lower cost alternatives in certain patient populations. High-level estimates of the savings from implementing practices supported by CER are large: $18 billion in the first year and $368 billion over 10 years (1). However, such estimates are uncertain because they are not based on evaluating specific practice patterns and their costs, which can only come from examining individual comparative effectiveness studies and the savings that would result from shifting care based on adoption of their findings. Thus, the savings that would result from specific changes to clinical practice patterns are largely unknown (2).
Prostate cancer is a high-priority area for future CER. The initial treatment of prostate cancer in the United States cost an estimated $4.5 billion in 2010 (3). Total expenditures are undoubtedly much greater. The Institute of Medicine’s Committee on Comparative Effectiveness Research identified the treatment of localized prostate cancer (LPC) as a top research priority (4). Prostate cancer is one of the most commonly diagnosed cancers in the United States with an estimated 219 000 men diagnosed in 2010 (5). The majority (80%) of men diagnosed today have cancer still localized to the prostate, with a disease-specific 5-year survival rate of 100% (6). The choice of treatment matters not only because of the high incidence but also because the relative effectiveness of alternatives is uncertain and treatment costs vary greatly. A review of all prostate cancer treatment trials concluded that no specific treatment for LPC has proven superior to another, particularly among patients aged 65 years and older (7). Decision analyses have estimated that active surveillance leads to the greatest number of quality-adjusted life-years gained as compared to initial treatment for men with LPC (8). Treatment decisions are often based on local practice norms (9) or on the intent to avoid perceived side effects, such as frequent urination, incontinence, or sexual dysfunction, whose rates appear to differ among the treatments. A conservative initial approach involving active surveillance with treatment for those whose disease progresses has not been shown to be less effective than radiation or surgery for most patients with localized disease, particularly those older than age 65 at diagnosis (7). This conservative approach is used less than active treatments, and overtreatment with radiation and surgery in this low-risk group is frequent (10). Nearly 75% of men diagnosed with very low-risk disease are initially treated with radiation or surgery, despite the lack of high-quality evidence that treatment is more effective than active surveillance (11).
We analyzed the treatment choice for patients with LPC as an important example of how health expenditures might be reduced by the adoption of CER findings. We define clinical practices as supported by CER if they are no less effective than others but associated with lower long-term costs of care. This analysis aims to 1) calculate annual and 5-year costs associated with initial management strategies for treatment of LPC and 2) estimate potential savings from a shift in current practice patterns toward conservative management for initial treatment of LPC.
Methods
Data Sources and Description
We obtained data from an extensive commercial database maintained by Ingenix (Eden Prairie, MN) containing claims data for 42 large employers. These data have been used extensively to examine pharmacy and medical spending in previous research (12–16). The data capture all health-care claims including prescription drugs, inpatient, emergency, and ambulatory services from 1998 to 2008. The database elements include age, sex, plan type, zip code of residence, and relationship to employee, along with diagnostic (International Classification of Diseases, 9th Revision [ICD-9]) codes utilized for the provision of medical care on a quarterly basis through 2008. Forty-four percent of plans cover retiree benefits (through Medicare), so there is substantial representation of payments for older Americans in the data.
Study Population
From this data source, we extracted quarterly claims data for patients newly diagnosed with LPC. We identified these patients based on a new diagnosis of prostate cancer in years 1998–2006—confirmed by a prior code for prostate biopsy (n = 19 508). Patients were first required to have a prostate needle biopsy (Current Procedural Terminology [CPT] 55700) performed within 3 months documented by a medical claim for which prostate cancer (ICD-9 185.0) was provided as the reason for visit. The cases were also required to have a 1-year period prior to prostate biopsy in which there were no medical claims submitted with a diagnostic code for prostate cancer. We included only patients who had adequate data for analysis—1 year of claims experience prior to, and at least 2 years following, diagnosis, resulting in 8095 persons. We excluded patients who had diagnostic codes for disseminated disease (ICD-9 199.0), bone cancer (ICD-9 198.5), and involvement of pelvic or other lower extremity lymph nodes by cancer (ICD-9 196.6, ICD-9 196.2) prior to or within the first year of the new prostate cancer diagnosis (resulting in 7764 persons remaining). Finally, we excluded persons older than 75 years of age at the time of diagnosis, leaving 5654 patients remaining for the analysis. This age limitation increases the likelihood of selecting men with a life expectancy of at least 5 years at the time of diagnosis, and thus more likely to be candidates for surgery or radiation therapy.
Treatment Designation and Use
We classified patients according to their initial treatments, using codes for procedures performed within 6 months of diagnosis. We categorized patients as receiving the following primary management strategies (henceforth also called “treatments” or “treatment groups”): radical prostatectomy (RP), brachytherapy, external beam radiation therapy (EBRT), intensity-modulated radiation therapy (IMRT), combinations of any of the previous local treatments (combined treatments), primary androgen deprivation therapy (PADT), and conservative management (CM). Newer technologies of proton beam therapy and cryotherapy were not frequent enough in our dataset for inclusion. We designated patients as receiving primary treatment with RP when their claims included CPT codes 55840,55842, 55845, 55866, 55810, 55812, or 55815; brachytherapy as those whose claims included codes 77781-7, 77776-8, 55876, or 55875; EBRT as codes 77401, 77402, 77403, 77404, 77405, 77406, 77407,77408,77409, 77410, 77411, 77412, 77413, 77414, 77415, or 77416; and IMRT as claims for 77418. Patients were classified as having PADT if they received codes for orchiectomy (CPT codes 54520, 54521, 54522, 54530, 54535, or ICD-9 procedure codes 62.3, 62.41, 62.42) or the administration of leuprolide or goserelin (J-codes J9202, J1950, J9217, J9218, J9219) without additional codes for radiation or surgery (17,18). Patients who received care consistent with the above definition of local primary treatments (radiation or surgery), who were also coded for orchiectomy or the administration of leuprolide or goserelin, were assumed to receive adjuvant androgen deprivation therapy (AADT). We assigned patients who did not receive any of these treatment codes within the first 6 months of diagnosis to the conservative management (CM) strategy, which refers to the practices of either active surveillance or watchful waiting—given that we cannot observe intent with claims data, we chose to refer to this management strategy as conservative management. However, current practice in the United States would favor active surveillance as the choice of conservative management for this patient population. The 6-month timeframe is supported by a study that showed that patients with prostate cancer usually undergo primary therapy within 6 months of diagnosis (19).
Cost Analysis
We calculated average total health expenditures for medical care by treatment group by summing all prescription drug costs, physician costs, ancillary services such as laboratory and diagnostic testing, and inpatient and outpatient hospitalization costs for a minimum of 2 years, up to 5 years following diagnosis. Base year costs were converted to 2009 dollars using the GDP deflator (20). We used STATA software v. 10 (STATACorp, College Station, TX) to perform the statistical analysis. We used median regression or least-absolute value (rather than least squares) regression to adjust total health expenditures for covariates of age at diagnosis, year of diagnosis, preceding 12-month health expenditures (as a measure of the baseline intensity of medical resource utilization), use of adjuvant androgen deprivation therapy, patient’s zip-code median income, geographic region, rural/urban location, and degree of underlying comorbid illnesses. We tested the sensitivity of our model choice using ordinary least squares and a generalized gamma distribution model with a log link function and found that all models were in general agreement, but median regression reported the lowest overall difference between active treatments and conservative management (thus leading to the most conservative estimates for our population savings model). This analysis estimates the adjusted additional health expenditures per patient associated with each treatment as compared to conservative management. We used median regression to better adjust for the frequency of positive outliers in health expenditure data because we are primarily interested in the “typical” cost associated with each treatment strategy for use in the utilization model. We tested other regression methods as sensitivity analyses. These include log regression, a generalized linear model with a gamma distribution and log link function, and standard regression. Because these did not change the overall conclusions of our analysis, and given that the estimates of the difference in costs between conservative management and the active treatment groups were lower using median regression than OLS regression, we chose the results of that model for our primary analyses. To adjust for comorbid illness, we used an outpatient and inpatient adaptation of the Charlson comorbidity index—the National Cancer Institute (NCI) Combined index for prostate cancer (21,22). We searched for the comorbid conditions identified by Charlson et al. (23) in the ICD-9-Clinical Modification (ICD-9-CM) diagnostic codes for physician outpatient and inpatient claims data during the 1-year period prior to prostate cancer diagnosis and used an index applied to these conditions weighted to prostate cancer patients (18). This approach has previously been validated in patients with prostate cancer as predictive of longevity (21,22).
Health Expenditure Savings Model
We estimated ranges in expenditure reductions (ie, savings) by constructing a population expenditure model based on initial treatment utilization for the US population under age 75 at diagnosis (using Microsoft Office Excel 2007, Microsoft Corp, Seattle, WA). This model estimates scenarios based on adjusting the following major inputs: 1) percent of total cases presenting as localized disease (6), 2) percent of cases actively treated (as opposed to conservatively managed) (6), and 3) share of IMRT as a percent of actively treated cases. Based on the ranges of inputs for these major drivers to the economic model, we calculated a range of savings based on shifting management from today’s current treatment pattern to conservative management.
We first constructed an estimate of current health expenditures (up to 5 years) for newly diagnosed prostate cancer patients in the (assumed) year 2009. Based on the Surveillance, Epidemiology, and End Results (SEER) database, we estimated that 219 000 patients were diagnosed with prostate cancer in 2009, 81% of whom had localized disease (range 80%–85%) (24). From SEER, we estimated that 75% (range 70%–80%) of patients would be younger than age 75 at diagnosis. For the base case population expenditure calculation, we used data from SEER from 2001 to 2005 to estimate current utilization of each treatment group (as a percent of the under-age-75 population). We include a scenario in sensitivity testing where we carryforward the observed trend during this period of increased IMRT use to 2009. To these treatment frequency estimates, we apply the 5-year (discounted to 2009) cost estimates from our previously described cost analysis. We thus calculate median 5-year health expenditures per patient per initial treatment strategy from our regression cost analysis and apply this median cost per patient to the treatment utilization frequencies to estimate total 5-year health expenditures per treatment group. Summing these across all treatment yields the base case total health expenditures for 5 years of medical care for the entire prostate cancer cohort in 2009.
We then modeled patients moving to different initial treatment groups by changing the frequencies of treatment use in the above model and applying the same 5-year cost estimates per patient per initial treatment group obtained from our cost analysis. We next calculate the differences in cost for these treatment “switches” as compared to the baseline spending projections, by treatment group and for the entire cohort. Health savings scenarios based on replacement of specific active treatments by conservative management are thus calculated.
Results
Table 1 shows the characteristics of the study population included in the analysis according to treatments received. The mean age at diagnosis was 64.7. Medicare beneficiaries were 23% of the sample. Most patients were otherwise healthy at diagnosis with low comorbidity scores. Patients treated with IMRT (mean age 67.5) and PADT (mean age 68.7) were older and had higher average comorbidity scores than those treated with other initial management strategies (including conservative management). The use of treatments over time is shown in Figure 1. Between 1998 and 2006, patients opting for conservative management in this population fell from 65% to 45% of total. PADT peaked in 2000–2001 at just over 15%, and its use fell to 8% by 2006. The greatest increase in active treatments over this time period was for brachytherapy and IMRT. The use of EBRT, an older form of radiation therapy, began declining when IMRT started appearing in the data in 2002. The use of combinations of local treatments (the most common being brachytherapy and EBRT/IMRT) increased from 0% to 5% by 2006. The use of AADT was common, ranging from 6% of those undergoing RP to 53% for those receiving EBRT.
Patient characteristics by initial management approach for localized prostate cancer*
| CM (%) | PADT (%) | RP (%) | EBRT (%) | Brachy (%) | IMRT (%) | Combined (%) | Total | |||||||||
|---|---|---|---|---|---|---|---|---|---|---|---|---|---|---|---|---|
| No. (%) | 2146 (38) | 713 (13) | 1,722 (31) | 106 (2) | 605 (11) | 154 (3) | 136 (2) | 5582 | ||||||||
| Age at diagnosis | ||||||||||||||||
| <50 | 44 (33) | 5 (4) | 78 (59) | 0 (0) | 5 (4) | 0 (0) | 1 (1) | 133 | ||||||||
| 50–59 | 425 (36) | 40 (3) | 562 (47) | 60 (1) | 91 (8) | 18 (2) | 37 (3) | 1119 | ||||||||
| 60–69 | 926 (37) | 291 (11) | 841 (33) | 52 (2) | 300 (12) | 62 (2) | 60 (2) | 2532 | ||||||||
| >70 | 751 (43) | 377 (22) | 241 (14) | 42 (2) | 209 (12) | 74 (4) | 38 (2) | 1752 | ||||||||
| Mean age | 65.3 | 68.7 | 61.5 | 66.7 | 66.0 | 67.5 | 64.4 | 64.7 | ||||||||
| Region | ||||||||||||||||
| West | 133 (38) | 29 (8) | 128 (37) | 3 (1) | 36 (10) | 15 (4) | 5 (1) | 349 | ||||||||
| Midwest | 812 (39) | 375 (18) | 564 (27) | 41 (2) | 255 (12) | 37 (2) | 14 (1) | 2098 | ||||||||
| Northeast | 489 (41) | 110 (9) | 395 (33) | 27 (2) | 98 (8) | 41 (3) | 23 (2) | 1183 | ||||||||
| South | 712 (36) | 199 (10) | 634 (32) | 35 (2) | 216 (11) | 61 (3) | 94 (5) | 1951 | ||||||||
| Median household income in ZIP of residence, USD | ||||||||||||||||
| <40 | 1020 (38) | 386 (14) | 791 (30) | 64 (2) | 279 (10) | 72 (3) | 61 (2) | 2,673 | ||||||||
| 49–60 | 988 (38) | 309 (12) | 840 (32) | 40 (2) | 292 (11) | 71 (3) | 68 (3) | 2,608 | ||||||||
| >60 | 136 (47) | 17 (6) | 83 (29) | 2 (1) | 34 (12) | 11 (4) | 7 (2) | 290 | ||||||||
| Mean income, USD | 42 620 | |||||||||||||||
| Marital status | ||||||||||||||||
| Married | 1619 (38) | 504 (12) | 1340 (32) | 81 (2) | 465 (11) | 113 (3) | 107 (3) | 4228 | ||||||||
| Unmarried | 528 (39) | 209 (15) | 382 (28) | 25 (2) | 140 (10) | 41 (3) | 29 (2) | 1354 | ||||||||
| Insurance | ||||||||||||||||
| Medicare | 473 (45) | 294 (28) | 194 (18) | 20 (2) | 64 (6) | 0 (0) | 4 (0) | 1049 | ||||||||
| Other | 1673 (37) | 419 (9) | 1528 (34) | 86 (2) | 541 (12) | 154 (3) | 132 (3) | 4533 | ||||||||
| Adjuvant AADT | ||||||||||||||||
| Yes | 0 | 0 | 104 (6) | 56 (53) | 151(25) | 67 (44) | 50 (37) | 428 | ||||||||
| No | 2146 | 713 | 1618 (94) | 50 (47) | 454 (75) | 87 (56) | 86 (63) | 5222 | ||||||||
| NCI comorbidity index for prostate cancer | ||||||||||||||||
| Mean | 0.43 | 0.62 | 0.35 | 0.34 | 0.34 | 0.53 | 0.44 | 0.42 | ||||||||
| = 0 | 1726 (38) | 544 (12) | 1430 (32) | 84 (2) | 488 (11) | 115 (3) | 104 (2) | 4491 | ||||||||
| >0, ≤1 | 221 (39) | 83 (14) | 148 (26) | 12 (2) | 68 (12) | 23 (4) | 18 (3) | 573 | ||||||||
| >1, ≤5 | 156 (38) | 63 (15) | 116 (28) | 9 (2) | 42 (10) | 11 (3) | 11 (3) | 408 | ||||||||
| >5 | 43 (39) | 23 (21) | 28 (25) | 1 (1) | 7 (6) | 5 (5) | 3 (3) | 110 | ||||||||
* AADT = adjuvant androgen deprivation therapy; Brachy = brachytherapy; CM = conservative management; EBRT = external beam radiation therapy; IMRT = intensity-modulated radiation therapy; NCI = National Cancer Institute; PADT = primary androgen deprivation therapy; RP = radical prostatectomy.
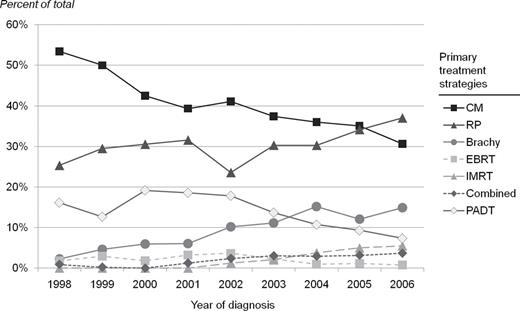
Primary treatment strategies for localized prostate cancer by year of diagnosis. The percent of patients receiving initial treatment with each management strategy is shown according to the year of first diagnosis: 1998 to 2006. Symbols are used as follows: dark square for conservative management (CM), dark triangle for radical prostatectomy (RP), circle for brachytherapy (Brachy), light square for external beam radiation therapy (EBRT), light triangle for intensity-modulated radiation therapy (IMRT), dark diamond for combined treatments, and light diamond for primary androgen deprivation therapy (PADT). Combined treatments refer to combinations of active local treatments.
Results for median incremental 1- through 5-year total health expenditures by initial active treatment strategy over conservative management are shown in Table 2. The strategy with the highest incremental expenditures over conservative management in the first year after diagnosis was combined active treatments at $3500 followed by IMRT at $48 550 and brachytherapy at $28 600. Radical prostatectomy and EBRT were associated with the lowest incremental first-year expenditures at $15 200 and $18 900. In general, costs are directly proportional to age and year of diagnosis, preceding 12-month health expenditures, and presence of comorbidities. After the first year of diagnosis, PADT was the only treatment that varied significantly from conservative management, with higher incremental costs ranging from $3350 to $7600 during years 2–5 after diagnosis.
Incremental cost of initial active treatment over conservative management by year from diagnosis for men with localized prostate cancer, 2009 USD (95% CI)*
| Variable† | Year 1 | Year 2 | Year 3 | Year 4 | Year 5 |
|---|---|---|---|---|---|
| Treatments | |||||
| RP | 15 200 (14 000, 16 300)‡ | −400 (−845, 30) | −858 (−1050, −120) | 15 (−790, 7820) | −95 (−1310, 1120) |
| Brachytherapy | 28 600 (27 000, 30 200)‡ | −815 (−1450, −180) | −450 (−1140, 230) | −470 (−1700, 775) | 1070 (−940, 3075) |
| EBRT | 18 900 (15 500, 22 300)‡ | 66 (−1265, 1400) | −300 (−1650, 1000) | −290 (−2400, 1830) | 2260 (−850, 5375) |
| IMRT | 48 550 (45 600, 51 500)‡ | −691 (−1830, 450) | 380 (−1060, 1850) | −850 (−4125, 2410) | 9975 (1750, 18200) |
| Combined treatments | 63 500 (60 440, 65 900)‡ | 825 (−350, 2000) | 1375 (57, 2700)‡ | 1850 (−600, 4300) | 1000 (−3550, 5550) |
| PADT | 37 500 (36 000, 39 000)‡ | 7600 (7000, 8200)‡ | 3600 (3000, 4200)‡ | 3365 (2400, 4300)‡ | 3350 (1950, 4760)‡ |
| Explanatory variables | |||||
| AADT | 17 600 (15 690, 19 500)‡ | 3360 (2600, 4100)‡ | 1466 (660, 2275)‡ | 1,000 (−410, 2450) | −540 (−2760, 1690) |
| Age | 460 (400, 540)‡ | 100 (75, 130)‡ | 75 (45, 100)‡ | 100 (60, 150)‡ | 75 (−5, 155) |
| Year | 800 (590, 1010)‡ | 140 (60, 225)‡ | 250 (150, 350)‡ | 230 (35, 420)‡ | 57 (−284, 400) |
| Northeast region | −1,100 (−2400, 260)‡ | −850 (−1,360, −325)‡ | −1330 (−1900, −760)‡ | −830 (−1850, 190) | −1980 (−3570, −400) |
| 12-Month preceding expenditures | 0.40 (0.37, 0.43)‡ | 0.33 (0.31, 0.34)‡ | 0.33 (0.31, 0.34)‡ | 0.42 (0.39, 0.45)‡ | 0.34 (0.30, 0.39)‡ |
| NCI comorbidity index | 2600 (2350, 2850)‡ | 955 (860, 1050)‡ | 1750 (1650, 1860)‡ | 670 (510, 830)‡ | 950 (750, 1160)‡ |
| No. | 5582 | 5582 | 3611 | 2519 | 1708 |
* AADT = adjuvant androgen deprivation therapy; EBRT = external beam radiation therapy; IMRT = intensity-modulated radiation therapy; NCI = National Cancer Institute; PADT = primary androgen deprivation therapy; RP = radical prostatectomy.
† Variables included in the model but not shown and not statistically significant were Midwest and West region, percent black population by three-digit ZIP code, married, urban location of residence, and median household income by three-digit ZIP code.
‡ Statistically significant at the 5% level.
Table 3 shows the savings in US health expenditures from widely adopting treatment strategies that are the least costly, including conservative management. We limit this savings estimate to a cohort of newly diagnosed patients aged less than 75 [75% of all patients diagnosed annually (25)] in 2009 estimated dollars. Overall base case 5-year health expenditures for the US cohort were $9.1 billion (net present value). Next, we estimate that shifting patients receiving combinations of active treatments to a single active therapy could save $620–655 million (net present value over 5 years from diagnosis). Shifting patients receiving IMRT to CM could save in the range of $680–$930 million (5-year net present value). Making radical changes, such as shifting all patients to initial CM, could save between $2900 and $3250M (net present value) over 5 years. Foregoing PADT for LPC, a treatment suspected to be harmful for many patients (26,27), would save about $400 million (5-year net present value) per annual cancer cohort. Eliminating the use of AADT could save approximately $630 million (5-year net present value).
Estimated US health expenditure savings (5-year net present value [NPV] in 2009 USD) from shifting initial active treatments to conservative management for a single annual cohort newly diagnosed with localized prostate cancer*
| Scenarios | |||
|---|---|---|---|
| Base case scenario | Increase in diagnosis | Increase in use of active treatments | |
| Key model inputs | |||
| Localized disease, % | 80 | 85 | 80 |
| Use of local treatments, % (excluding PADT) | 68 | 68 | 73 |
| IMRT adoption, % of active treatment (excluding PADT) | 22 | 22 | 27 |
| Total estimated baseline 5-year cohort total expenditures, $ millions | 9130 | 9800 | 9500 |
| Savings from alternative treatment scenarios, $ millions (% of total estimated base case cohort 5-year costs) | |||
| Shifting all local treatments (not PADT) to CM | 2900 (32) | 3100 (32) | 3250 (34) |
| Shifting IMRT to CM | 680 (7) | 725 (7) | 930 (10) |
| Shifting Brachy to CM | 350 (4) | 370 (4) | 390 (4) |
| Shifting combined treatments to single therapies (baseline proportions) | 620 (7) | 655 (7) | 640(7) |
| Shifting PADT to CM | 555 (6) | 555 (6) | 555 (6) |
| Shifting PADT to active treatments | 400 (4) | 400 (4) | 400 (4) |
| Eliminating use of AADT for localized disease | 630 (7) | 630 (7) | 630 (7) |
* AADT = adjuvant androgen deprivation therapy; Brachy = brachytherapy; CER = comparative effectiveness research; CM = conservative management; EBRT = external beam radiation therapy; IMRT = intensity-modulated radiation therapy; PADT = primary androgen deprivation therapy; RP = radical prostatectomy. Assumes 219 000 new cases of prostate cancer with 75% below age 75.
Discussion
Our analysis of commercial health insurance claims data (including substantial numbers of Medicare beneficiaries) estimates the reduction in US health expenditures that could result from adoption of initial conservative management for men diagnosed with LPC. Most patients diagnosed with LPC today are in the earliest stages of disease, where conservative management has not been shown to be inferior to immediate treatment (7). Our analysis finds that initial treatment with radiation, brachytherapy, PADT, and combinations of active treatments has substantially greater costs than other management options and that substantial health expenditure savings might be realized by treating patients with initial conservative management—even if only partially adopted.
The intensity of treatment generally increased over the period studied for this privately insured population. This may partly be due to the fact that our sample is limited to patients younger than 75 years of age at diagnosis. They may be healthier than the overall prostate cancer population, and many may still be employed. Not only were patients more likely to receive active treatments over time, but also combinations of individual local treatments became more common (from 0% to 5% of patients). The introduction of robotic surgery appears to have been associated with an increase in the use of radical prostatectomy (28). In our data, androgen deprivation therapy was common, peaking as a primary treatment in the early 2000s and leveling out somewhat since then, consistent with other reports (9,29). PADT has been associated with greater prostate cancer–specific mortality than active surveillance (18). Furthermore, it has been associated with a lower quality of life and potentially higher risk of cardiovascular complications (18,26,27,30,31). The cost of leuprolide was the second highest Medicare Part B expenditure ($1.2 billion) in 2003 (32). Evidence suggests that androgen deprivation therapy does not extend survival in the majority of patients with localized disease (33,34). It has been found to improve overall and disease-free survival when used in combination with EBRT in patients with locally advanced (T3) or high-risk prostate cancer, representing a minority of those presenting with localized disease (35–40). We found that androgen deprivation therapy frequently accompanies surgery and brachytherapy, a practice generally not recommended for patients with localized disease. Thus in our data, active and costly treatments for patients with LPC were used more frequently than initial conservative management.
According to our estimates, if patients with LPC were managed with initial active surveillance (a type of conservative management in addition to watchful waiting), the savings in US health expenditures would be substantial. We estimate that US health expenditures could be reduced by $0.5–3.0 billion (2009 net present value), or up to 30% of total health expenditures, for each annual cohort of newly diagnosed patients. An additional 6% of 5-year health expenditures could be saved if primary androgen deprivation therapy were forgone for treatment of patients with localized disease. The highest savings could be achieved by replacing current use of IMRT and treatment combinations (most frequently IMRT and brachytherapy) with active surveillance. The magnitude of cost savings estimated in our study suggests that a definitive randomized trial (perhaps unlikely for logistical reasons) of the treatment alternatives for LPC could be worth billions of dollars over a 10-year period.
Our conclusions must be qualified by limitations of our approach. Limiting the consideration of total health expenditures to 5 years following diagnosis potentially biases the results toward active surveillance by not including later costs that would be attributed to the progression of some patients to active treatment. A recent long-term prospective cohort study reported that the average time to treatment for patients initially managed with active surveillance (N = 3331) was 3.9 years, a timeframe encompassed by the 5 years of analysis in our data (41). We also find that the majority of the cost differences between treatment strategies were within the first 2 years of diagnosis, and continuing the minor cost differences in years 3–5 forward for years 6–10 would not change our conclusions. Second, some patients, particularly younger men diagnosed with intermediate- to high-risk disease, may have a survival advantage with initial radical prostatectomy as shown in 15-year outcomes of a Scandinavian early stage cohort trial (42). Preferring initial radical prostatectomy over conservative management for this cohort would not significantly change our savings estimates because surgery was the next lowest-cost treatment option in our analysis. In fact, we have reported cost estimates for population switches to surgery as an alternative to the preferred initial strategy in previous research (43).
Additionally, our method is subject to the limitations of observational analyses, particularly those based on claims data. With nonrandom assignment to treatment, selection effects can bias cost estimates, just as they bias survival estimates. For example, healthier men may be offered active treatment, particularly radical prostatectomy, at greater rates. Health expenditures among men treated with conservative management, who would be expected to be sicker than actively treated patients, would be expected to be overestimated in our analysis. Thus, we may be underestimating the savings from switching healthier men currently receiving active treatment to conservative management. To minimize such biases, we added controls to our model for the most important markers of overall health and life expectancy: age, presence of comorbidities, and socioeconomic factors of education and income. We acknowledge that selection effects in this observational analysis may not be adequately addressed, and thus it should be noted that the most likely direction of selection bias in our analysis is toward overestimating the costs of the conservative management strategy and thus underestimating potential savings if healthier patients switch to this treatment strategy.
Despite our attempts to limit the study population to men with localized disease, patients with advanced disease may have been inadvertently included because we did not have access to complete information on the stage or grade of disease at diagnosis. This would almost certainly have been a small number, given the epidemiology of the disease in the United States today. By reporting median costs (a nonparametric method) to calculate estimated savings as opposed to mean, we are likely to have mitigated this lack of complete clinical data and to have potentially underestimated the savings from the adoption of conservative management because mean health expenditures are greater than median.
Finally, our research addresses the potential savings from adoption of lower cost approaches. These will only become real savings if actual clinical practice changes. Research is equivocal on the factors that are most important to patient’s treatment choice for prostate cancer, with some concluding that treatment decisions may be more indicative of differences in the information patients receive rather than truly reflective of underlying patient preferences (44). There is currently active research into health decision aids as shared decision-making tools for complex medical decision such as prostate cancer treatment, and cost considerations should be a component to such tools if high-value medical care is to be encouraged (45). Although the extent to which treatment costs influence decision making in this area is yet unknown, there has been a shift among physicians as to the acceptability of cost-conscious, high-value medical decision making—as evidenced by a recent call for the seventh general competency encompassing cost-consciousness and resource stewardship by the American Council for Graduate Medical Education (ACGME) and American Board of Medical Specialties (ABMS) (46). More research is needed as to the optimal approach to incorporating cost information into physician and shared decision making in this area. Other potential health system changes that would encourage lower cost decision making such as described here involve payment or incentive redesign, such as the use of bundled payments, care delivery through accountable care organizations, or value-based pricing with differential pricing for certain treatment decisions. Furthermore, results such as these might inform the content of pilot programs that the Center for Medicare and Medicaid Innovation will be responsible for implementing under the Patient Protection and Affordable Care Act. Understanding the relative value from alternative treatments is the first step to rational redesign of health benefits. Research such as this could be important in informing the changes necessary to transition our current fee-for-service system to coordinated care that maximizes quality and prevents overtreatment resulting in complications and excessive expenditures.
Our research identifies specific treatment strategies and their longer-term cost implications for the management of LPC and calculates potential savings to US health expenditures of the greater adoption of active surveillance for initial management. We suggest that this method could be adopted in other clinical areas to help prioritize medical areas for further study with CER, based on the potential for health savings if results supported widespread utilization of the lowest-cost treatments. Studies such as these may provide important information for decision makers who are engaged in developing policies to combat the unsustainable growth in US health expenditures.
References
