


Abstract
Worldwide use of computed tomography (CT) scans has increased. However, the ionizing radiation from CT scans may increase the risk of cancer. This study examined the association between medical radiation from CT scans and the risk of thyroid cancer, lymphoma, and non-Hodgkin lymphoma (NHL) in adults.
We conducted a nested case-control study in a cohort constructed from a population-based universal health insurance dataset in Taiwan in 2000–2013. In total, 22 853 thyroid cancer, 13 040 leukemia, and 20 157 NHL cases with their matched controls were included. Median follow-up times were 9.29–9.90 years for the three case-control groups. Medical radiation from CT scans was identified through physician order codes in medical insurance data from the index date to 3 years before a cancer diagnosis. Conditional logistic regression modeling was used for the overall and subsets of the population defined by sex and age groups to estimate the odds ratio (OR) and 95% confidence interval (CI) of the cancer risk associated with medical radiation.
Exposure to medical radiation from CT scans was associated with elevated risk of thyroid cancer (OR = 2.55, 95% CI = 2.36 to 2.75) and leukemia (OR = 1.55, 95% CI = 1.42 to 1.68). The elevated risk of thyroid cancer and leukemia in association with medical CT was stronger in women than in men. No statistically significant association between the risk of cancer and CT scans was observed in overall patients with NHL (OR = 1.05, 95% CI = 0.98 to 1.12); however, increased risks were found in patients aged 45 years or younger. A clear dose-response relationship was observed in patients 45 years or younger for all three cancers.
CT scans may be associated with an increased risk of thyroid cancer and leukemia in adults and in those diagnosed with NHL at a younger age.
Computed tomography (CT) scans use ionizing radiation to create detailed cross-sectional images of the body (1). Diagnostic images allow for earlier and more accurate disease diagnoses; therefore, a rapid increase in the use of CT scans has been observed over the last 2 decades (2–4). However, overuse of CT scans and the potential patient harm have raised concerns (5). CT scans expose patients to ionizing radiation, a known human carcinogen. From 1997 through 2007, CT scans and nuclear medicine procedures became the largest source of exposure to ionizing radiation and accounted for 24% of the exposure in the US population (1,6,7).
Radiation doses from CT scans vary by a number of factors. The effective dose from a diagnostic CT scan typically ranges around 1–15 millisieverts (mSv) during a single procedure. The dose from a CT scan is not much less than the subgroup of atomic bomb survivors who received low doses of radiation ranging 5–20 mSv (8). Those survivors demonstrated a small but statistically significantly increased risk of several types of cancers (9–11). Although the cancer risk for an individual is small, the increased numbers of people undergoing CT scans have become a public health issue.
Current evidence of estimating cancer risk induced by low-dose radiation is mostly derived from atomic bomb survivors. A few occupational studies demonstrated the risk in radiation workers in the nuclear industry who were exposed to an average dose of approximately 20 mSv, which is a dose equivalent to one or two CT scans (12). Studies demonstrated the risk of leukemia and brain tumors following pediatric CTs (13,14). However, studies estimating the effect of exposure to low-level ionizing radiation from medical procedures in adults are limited. We conducted a population-based study and examined the association between exposure to medical radiation from CT scans and the risk of cancers in adults. Herein, we assessed the risks of thyroid cancer, leukemia, and non-Hodgkin lymphoma (NHL), because they involve some of the most radiosensitive tissues with a marked increased in incidence (15,16).
Methods
Study Design and Setting
A population-based nested case-control study was conducted within a cohort of National Health Insurance (NHI) beneficiaries during the period 2000–2013, with 25.7 million people representing more than 99% of the population in Taiwan. Data from the single-payer compulsory NHI program provide demographic and medical information on disease diagnoses, procedures, drug prescriptions, and enrollment profiles of all beneficiaries (17).
Individuals were excluded if they were aged 25 years or younger at the time of the cancer diagnosis, had less than 3 years of follow-up before cancer diagnosis, or had a history of a cancer before the year 2000 (n = 15191). We excluded patients who were aged 25 years or younger because of their unique features in pathogenesis (18). We also excluded individuals with any treatment related to a high dose of radiation exposure (n = 3084), those who received cancer treatment before cohort entry, and those with underlying conditions associated with each cancer (n = 5336). For example, patients with previous hyperthyroidism or Graves disease were excluded from the thyroid cancer group because of the prevalence of radiation-based treatments for those conditions. A list of causes for their exclusion is provided in Supplementary Table 1 (available online).
Case Definitions and Control Selection
Within this cohort, we identified all incident cancer cases during follow-up using the International Classification of Diseases, Ninth Revision (ICD-9). We included one solid tumor (thyroid cancer [ICD-9 code 193]) and two nonsolid tumors (leukemia [ICD-9 codes 204–208] and NHL [ICD-9 codes 200, 202]).
Incidence density sampling was used to select controls for each cancer case matched by age within 2 years, sex, and length from cohort entry to the date of the cancer diagnosis of the cases. Each case was randomly paired with up to 10 controls from their risk set.
Radiation Exposure From CT Scans
All CT scan images were identified through physician order codes in NHI medical files. We used ICD-9 primary diagnosis codes to identify the specific organ as the anatomic location for which a CT scan was ordered. This approach was effective in 92% of exposure incidences. The exposure window (radiation from a CT scan) for cases was defined from the index date through 3 years before a cancer diagnosis. The date of the first CT scan for each case represented the index date. In the event that a case did not receive a CT scan, the date of cohort entry served as the index date. The exposure window for the controls was defined as the interval between the index date and the corresponding cancer diagnosis date of their matched cases. Exposure during the 3 years before the cancer diagnosis was not counted to prevent any CT for a direct diagnosis. We also defined the exposure window into 5 to 6 years, 6 to 9 years, and 10 to 13 years, to examine the exposure-disease relationship.
Radiation’s detrimental effect was quantified by the effective dose to the whole body. Measured in sieverts (Sv), the effective dose was estimated by the sum of the product of an average organ equivalent dose by the International Commission on Radiology Protection (ICRP) radiation weighting factor (WT). It is a representation of a nonuniform exposure risk of the whole body (1,19). Doses were based on sex and age average for various CT procedures from data compiled by Mettler et al. (1). The average effective dose of each scan type and its lower and upper limits are presented in Table 1. CT scans were classified as focusing on the abdomen, bone, heart, chest, head, liver and spleen, lung perfusion, lung ventilation, neck, pelvis, kidney, or whole body. For example, a person received two CT scans for cardiac and abdominal regions individually. The reported effective dose is 14.1 mSv for the cardiac scan and 8 mSv for the abdominal scan from Table 1. The cumulative effective dose would be the sum of these two scans, which is 22.1 mSv.
Scan type and effective dose in millisieverts (mSv)
| Anatomic area, type of CT scan | Effective dose, mSv | Reported effective dose range of body region, mSv* |
|---|---|---|
| Abdomen | 8.0 | 2.5–25.0 |
| Liver and spleen | 2.1 | |
| Renal | 3.3 | |
| Chest | 7.0 | 0.4–18.0 |
| Cardiac | 14.1 | |
| Lung perfusion | 2.0 | |
| Lung ventilation | 0.5 | |
| Head | 2.0 | 0.9–4.0 |
| Pelvis | 6.0 | 3.3–10.0 |
| Neck | 3.0 | 0.8–19.6 |
| Whole body | 17.0 | 7.9–76.6 |
| Bone | 6.3 |
Source: Effective doses in radiology and diagnostic nuclear medicine: a catalog 1.
The range of reported effective dose, for each body region, under which each organ scan is classified. CT = computed tomography.
Statistical Analysis
Characteristics at cohort entry and the number and type of CT scans were tallied in cases and controls for each cancer. A conditional logistic regression model was constructed to estimate the odds ratio and 95% confidence interval of the cancer risk associated with medical radiation. Conditional logistic regression models were created for subsets of population defined by sex and age groups. In addition, we examined cancer risks associated with exposure windows of 5–6 years, 7–9 years, and 10–13 years to examine the exposure-disease relationship. Multiple conditional logistic regression models adjusted for age and sex were also adapted to estimate the adjusted odds ratio (20). Further, a dose-response relationship between medical radiation and risk of cancer was assessed and tested by using the Cochran-Armitage test for trend (one-sided, P <.05).
All analyses were performed using SAS statistical software (version 9.4, SAS Institute, Cary, NC). This study was reviewed and approved by the institutional review board of Taipei Medical University.
Results
Patient Characteristics
Our study cohort included 3 387 703 patients. In this cohort, 22 853 thyroid cancer, 13 040 leukemia, and 20 157 NHL cases were identified. These cases were matched with at least one eligible control to each case. The number of matched controls is 228 530; 130 400; and 20 1561 for thyroid cancer, leukemia, and NHL cases, respectively. Characteristics of the case and control groups are given in Table 2 and Supplementary Table 2 (available online). The distributions of age and sex were similar between cases and controls because they were matched. Median follow-up times were 9.29–9.90 years for the three case-control groups. Cancer cases were more likely to have received CT scans than their controls. Cardiac and bone CT scans were the most common procedures in all case and control groups.
Characteristics of cancer cases and matched controls
| Cancer type (ICD-9) | Thyroid (193) | Leukemia (204–208) | NHL (200, 202) | ||||
|---|---|---|---|---|---|---|---|
| Cases No. 22 853 | Controls No. 228 530 | Cases No. 13 040 | Controls No. 130 400 | Cases No. 20 157 | Controls No. 201 561 | ||
| Sex, n (%) | |||||||
| Female | 17 682 (77.4) | 167 820 (77.4) | 5384 (41.3) | 53 840 (41.3) | 8791 (43.6) | 87 901 (43.6) | |
| Male | 5171 (22.6) | 51 710 (22.6) | 7656 (58.7) | 76 560 (58.7) | 11 366 (56.4) | 113 651 (56.4) | |
| Age, y | |||||||
| At entry | 39.0 | 39.0 | 52.8 | 52.6 | 53.7 | 53.5 | |
| At first scan | 51.5 | 57.4 | 66.3 | 68.7 | 67.2 | 67.9 | |
| At cancer diagnosis | 48.6 | 48.7 | 62.2 | 62.1 | 63.3 | 63.1 | |
| Median follow-up time, y | 9.9 | 9.9 | 9.3 | 9.3 | 9.4 | 9.4 | |
| Index date, y, n (%) | |||||||
| 2002–2005 | 22 535 (98.6) | 225 350 (98.6) | 12 976 (99.5) | 129 760 (99.5) | 20 046 (99.4) | 200 451 (99.4) | |
| 2006–2009 | 233 (1.0) | 2330 (1.0) | 48 (0.4) | 480 (0.4) | 85 (0.4) | 850 (0.4) | |
| 2010–2013 | 85 (0.4) | 850 (0.4) | 16 (0.1) | 160 (0.1) | 26 (0.1) | 260 (0.1) | |
| Number of CT scans, n (%) | |||||||
| 0 | 21 967 (96.1) | 224 837 (98.4) | 12 336 (94.6) | 125 687 (96.4) | 19 195 (95.2) | 192 354 (95.4) | |
| 1–3 | 714 (3.1) | 3339 (1.5) | 580 (4.4) | 4064 (3.1) | 809 (4.0) | 7917 (3.9) | |
| 4 or more | 172 (0.8) | 354 (0.2) | 124 (1.0) | 649 (0.5) | 153 (0.8) | 1290 (0.6) | |
| Type of CT scans, n (%)* | |||||||
| Abdomen | 11 (0.05) | 114 (0.05) | 9 (0.07) | 78 (0.06) | 20 (0.10) | 60 (0.03) | |
| Bone | 446 (1.95) | 1234 (0.54) | 176 (1.35) | 822 (0.63) | 337 (1.67) | 645 (0.32) | |
| Cardiac | 619 (2.71) | 6102 (2.67) | 327 (2.51) | 4264 (3.27) | 248 (1.23) | 2036 (1.01) | |
| Chest | 18 (0.08) | 0 (0.00) | 0 (0.00) | 0 (0.00) | 28 (0.14) | 0 (0.00) | |
| Head | 50 (0.22) | 297 (0.13) | 44 (0.34) | 274 (0.21) | 36 (0.18) | 161 (0.08) | |
| Liver and spleen | 18 (0.08) | 46 (0.02) | 4 (0.03) | 39 (0.03) | 10 (0.05) | 40 (0.02) | |
| Lung perfusion | 34 (0.15) | 160 (0.07) | 12 (0.09) | 117 (0.09) | 12 (0.06) | 81 (0.04) | |
| Lung ventilation | 30 (0.13) | 160 (0.07) | 12 (0.09) | 104 (0.08) | 8 (0.04) | 81 (0.04) | |
| Neck | 94 (0.41) | 183 (0.08) | 37 (0.28) | 339 (0.26) | 159 (0.79) | 40 (0.02) | |
| Pelvis | 11 (0.05) | 46 (0.02) | 3 (0.02) | 26 (0.02) | 4 (0.02) | 40 (0.02) | |
| Renal | 32 (0.14) | 297 (0.13) | 27 (0.21) | 209 (0.16) | 28 (0.14) | 181 (0.09) | |
| Whole body | 158 (0.69) | 434 (0.19) | 81 (0.62) | 313 (0.24) | 77 (0.38) | 202 (0.10) | |
| Effective dose, mSv† | |||||||
| Q1 | 6.3 | 6.3 | 6.3 | 14.1 | 6.3 | 14.1 | |
| Q2 | 14.1 | 14.1 | 18.6 | 20.4 | 17 | 17 | |
| Q3 | 28.2 | 42.3 | 42.3 | 42.3 | 42.3 | 42.3 | |
| Mean | 0.90 | 0.38 | 1.47 | 1.04 | 1.39 | 1.30 | |
Number of scans / number of all cases or controls. CT = computed tomography; ICD-9 = International Classification of Diseases, Ninth Revision; NHL = non-Hodgkin lymphoma.
Among those with scans.
Cancer Risk Associated With CT Scans
Results showed that patients who developed thyroid cancer and leukemia had a statistically significantly higher likelihood of having received CT scans compared to their matched controls (Table 3). Patients who were exposed to medical CT exhibited an increased risk of thyroid cancer (OR = 2.55, 95% CI = 2.36 to 2.75) and leukemia (OR = 1.55, 95% CI = 1.42 to 1.68), respectively. The elevated risk in thyroid cancer and leukemia in association with medical CT was stronger in women than men (Table 3). In analysis that combined patients of all ages, exposure to medical CT was not associated with NHL (OR = 1.05, 95% CI = 0.98 to 1.12). This finding hides important age-related differences in the association between medical CT and the risk of NHL. In a subgroup analysis, patients who were aged 35 years or younger had a 2.72-fold elevated risk of NHL associated with exposure to medical CT. In those patients who were aged 36–45 years, there was a 3-fold increased risk of NHL associated with medical CT. On the other hand, in patients who were aged older than 45 years, the association between exposure to medical CT and NHL was not evident.
Odds ratio for cancer subtypes in relation to radiation doses received from CT scans in the overall population, by sex and age strata
| Patient characteristics | Thyroid cancer | Leukemia | NHL | |||
|---|---|---|---|---|---|---|
| Cases | Controls | Cases | Controls | Cases | Controls | |
| Overall | ||||||
| With CT scans, n (%) | 886 (4) | 3693 (2) | 704 (5) | 4713 (4) | 962 (5) | 9207 (5) |
| Without, n (%) | 21 967 (96) | 224 837 (98) | 12 336 (95) | 125 687 (96) | 19 195 (95) | 192 354 (95) |
| OR (95% CI) | 2.55 (2.36 to 2.75) | 1.55 (1.42 to 1.68) | 1.05 (0.98 to 1.12) | |||
| aOR (95% CI) | 2.54 (2.35 to 2.74) | 1.54 (1.42 to 1.67) | 1.05 (0.98 to 1.12) | |||
| Female | ||||||
| With CT scans, n (%) | 673 (4) | 2596 (1) | 298 (6) | 1719 (3) | 430 (5) | 3978 (5) |
| Without, n (%) | 17 009 (96) | 174 224 (99) | 5086 (94) | 52 121 (97) | 8361 (95) | 83 923 (95) |
| OR (95% CI) | 2.76 (2.53 to 3.02) | 1.82 (1.60 to 2.07) | 1.09 (0.98 to 1.21) | |||
| aOR (95% CI) | 2.75 (2.52 to 3.01) | 1.81 (1.59 to 2.06) | 1.08 (0.98 to 1.20) | |||
| Male | ||||||
| With CT scans, n (%) | 213 (4) | 1097 (2) | 406 (5) | 2994 (4) | 532 (5) | 5220 (5) |
| Without, n (%) | 4958 (96) | 50 613 (98) | 7250 (95) | 73 566 (94) | 10 834 (95) | 108 431 (95) |
| OR (95% CI) | 2.04 (1.75 to 2.37) | 1.39 (1.25 to 1.55) | 1.02 (0.93 to 1.12) | |||
| aOR (95% CI) | 2.03 (1.74 to 2.37) | 1.38 (1.24 to 1.54) | 1.02 (0.93 to 1.12) | |||
| Aged younger than 35 y | ||||||
| With CT scans, n (%) | 30 (1) | 94 (0.3) | 22 (2) | 44 (0.4) | 12 (1) | 50 (0.4) |
| Without, n (%) | 3433 (99) | 34 877 (99.7) | 1158 (98) | 11 694 (99.6) | 1144 (99) | 11 622 (99.6) |
| OR (95% CI) | 3.15 (2.07 to 4.79) | 5.18 (3.06 to 8.75) | 2.72 (1.43 to 5.19) | |||
| aOR (95% CI)* | – | – | – | |||
| Aged 36–45 y | ||||||
| With CT scans, n (%) | 82 (1.5) | 200 (0.4) | 20 (1) | 72 (0.5) | 41 (2.2) | 141 (0.7) |
| Without, n (%) | 5353 (98.5) | 54 098 (99.6) | 1498 (99) | 15 061 (99.5) | 1846 (97.8) | 18 772 (99.3) |
| OR (95% CI) | 4.04 (3.10 to 5.26) | 2.86 (1.71 to 4.79) | 3.05 (2.13 to 4.37) | |||
| aOR (95% CI)* | – | – | – | |||
| Aged 45 y or older | ||||||
| With CT scans, n (%) | 774 (5) | 3399 (2) | 662 (6) | 4597 (4) | 909 (5) | 9016 (5) |
| Without, n (%) | 13 181 (95) | 135 862 (3) | 9680 (94) | 98 932 (96) | 16 205 (95) | 161 960 (95) |
| OR (95% CI) | 2.41 (2.22 to 2.62) | 1.49 (1.37 to 1.62) | 1.01 (0.94 to 1.08) | |||
| aOR (95% CI)* | – | – | – | |||
Odds ratio was estimated by conditional logistic regression. Adjusted odds ratio was estimated by multiple conditional logistic regression including age and sex. The sex variable was exact matched; therefore, the adjusted odds ratio was the same as the odds ratio. aOR = adjusted odds ratio; CI = confidence interval; CT = computed tomography; NHL = non-Hodgkin lymphoma; OR = odds ratio.
Exposure Window and Dose Response
We examined the cancer risks associated with different exposure windows and found the risks were the highest in patients with a latent period between 7 to 9 years in all three cancers. The risks remained high in patients with a latent period of 10 to 13 years. (Table 4) Additionally, we characterized relationships between varying doses and their risk of cancer in patients aged 45 years or younger, and results are presented in Figure 1. A dose-response relationship between the estimated radiation dose from CT scans and the risk of cancer was observed among patients aged 45 years or younger with thyroid cancer, leukemia, or NHL. Radiation dose was positively associated with cancer risks, and trend tests were statistically significant (thyroid cancer P < .001; leukemia P < .001; and NHL P < .001). In contrast, in patients aged older than 45 years, the risk of cancer associated with an increased dose was smaller.
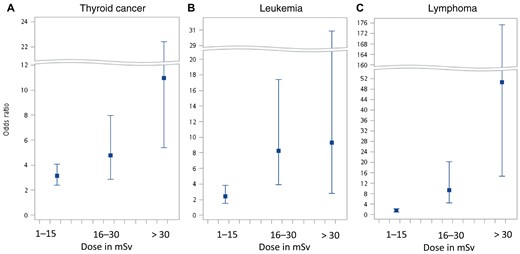
Dose response for the odd ratios of (A) thyroid cancer, (B) leukemia, and (C) non-Hodgkin lymphoma in relation to estimated radiation doses in millisieverts from computed tomography scans compared to nonexposed in patients aged younger than 45 years.
Odds ratio for cancer subtypes in relation to radiation doses received from CT scans with latent period 6 or less, 7 to 9, and 10 to 13 years*
| Latent period | Thyroid cancer | Leukemia | NHL | |||
|---|---|---|---|---|---|---|
| Cases | Controls | Cases | Controls | Cases | Controls | |
| 6 y or less | ||||||
| With CT scans, n (%) | 27 (1) | 88 (0.3) | 23 (1) | 124 (1) | 50 (2) | 265 (1) |
| Without, n (%) | 2958 (99) | 29 762 (99.7) | 1996 (99) | 20 066 (99) | 3266 (98) | 32 886 (99) |
| OR (95% CI) | 3.15 (2.03 to 4.88) | 1.87 (1.19 to 2.92) | 1.91 (1.41 to 2.60) | |||
| aOR (95% CI) | 3.14 (2.03 to 4.87) | 1.86 (1.18 to 2.91) | 1.90 (1.41 to 2.60) | |||
| 7 to 9 y | ||||||
| With CT scans, n (%) | 191 (3) | 512 (1) | 160 (18) | 3309 (9) | 287 (5) | 1453 (3) |
| Without, n (%) | 5705 (97) | 58 448 (99) | 752 (82) | 33 938 (91) | 5474 (95) | 56 153 (97) |
| OR (95% CI) | 3.92 (3.31 to 4.65) | 2.23 (1.86 to 2.66) | 2.05 (1.80 to 2.34) | |||
| aOR (95% CI) | 3.91 (3.29 to 4.64) | 2.22 (1.86 to 2.65) | 2.04 (1.79 to 2.33) | |||
| 10 to 13 y | ||||||
| With CT scans, n (%) | 323 (4) | 1557 (2) | 250 (7) | 1842 (5) | 460 (7) | 3826 (6) |
| Without, n (%) | 7045 (96) | 73 680 (98) | 3583 (93) | 36 498 (95) | 5954 (93) | 60 305 (94) |
| OR (95% CI) | 2.18 (1.92 to 2.47) | 1.40 (1.22 to 1.61) | 1.23 (1.11 to 1.36) | |||
| aOR (95% CI) | 2.17 (1.92 to 2.46) | 1.40 (1.21 to 1.60) | 1.22 (1.10 to 1.36) | |||
*Odds ratio was estimated by conditional logistic regression. Adjusted odds ratio was estimated by multiple conditional logistic regression including age and sex. aOR = adjusted odds ratio; CI = confidence interval; CT = computed tomography; NHL = non-Hodgkin lymphoma; OR = odds ratio.
Discussion
In this population-based nested case-control study, we discovered that receipt of CT scans was associated with marked increases in the risk of developing thyroid cancer and leukemia, especially in women and those aged 45 years or younger. A strong dose-response relationship was also observed in those patients who were aged 45 years or younger for all three cancers. To our knowledge, this is the first population-based longitudinal study to find a positive association between medical radiation and risks of thyroid cancer and leukemia in adults for whom ascertainment of exposure to CT radiation was made from health insurance data. Exposure to ionizing CT scans during childhood or adolescence was shown to increase the risks of developing leukemia, brain cancer, and other cancers (13,21). Our study reveals the potential risk of adulthood medical radiation exposure in the development of thyroid cancer, leukemia, and NHL. Although we cannot rule out the possibility that early symptoms of the cancer themselves led to the CT scans, we removed all cancer patients who had received a CT scan with any indication associated with cancer. In addition, we removed scans performed within 3 years before the diagnosis of cancer to minimize the possibility of selection bias. Although the prediagnostic phase is less likely to be prolonged for more than 3 years, especially in young populations, our findings of an excess cancer risk associated with CT scans are robust. When we examined the cancer risk associated with different exposure windows, the risks were still statistically significantly higher in patients who received CT scans more than 10 years ago compared with those without.
The association between ionizing radiation and an increased risk of cancers has been intensively studied. Studies were mostly conducted in animals, workers with occupational exposure (12), Japanese atomic bomb survivors (11), and patients treated with radiotherapy (22). Previous studies using prediction models estimated that up to 2% of future cancers in the United States, at approximately 29 000 cases and 15 000 deaths annually, might be caused by CT scans (23). Cancer risk following medical radiation is an increasingly important public health topic because growing numbers of CT scans are performed every day. Two epidemiological studies revealed the risk of CT scan exposure before the age of 19 years increased the risks of leukemia, brain cancer, and all cancer types including leukemia and NHL (13,21). However, studies documenting the risk of medical radiation exposure in adults with cancer are scarce. Some studies documented the association between X-rays and cancer, but most of them did not find a positive result. Most evidence was observed in second cancers after radiation therapy among cancer patients (24,25). One institutional study reported a link between thyroid cancer and the thyroid dose received from neck CT scans (26). Another study was conducted on patients aged 18–35 years who underwent chest or abdominal CT (27), and demonstrated that young adults receiving body CT scans were at a higher risk of dying of radiation-induced cancer compared with the general population. Our study provides direct evidence for increases in thyroid cancer and leukemia following medical radiation from CT scans. Similar to other studies that evaluated the cancer risk associated with radiation, we observed a profound effect of sex and age in increasing the risk of cancer after radiation exposure. Researchers have discovered that age and sex differences in DNA damage and gene rearrangement or fusion associated with radiation exposure may contribute to the divergence (28–30). These sets of evidence support the development of radiation biomarkers potentially improving risk assessments of low-dose radiation exposure and increasing safety.
Several strengths of this study are important to note. This is a large population-based cohort with a relatively long follow-up period, which provides a distinctive opportunity to assess the detrimental effect of medical radiation. Second, the study adopted the incidence density sampling method that matched age, sex, and duration of exposure opportunity time. This design provided relatively unbiased results in the observational study by avoiding time-window bias. Third, a strong dose-response relationship strengthened the association between medical radiation and cancer in the population aged 45 years or younger. Finally, all cancer cases receiving a CT scan with any indication associated with cancer were removed to prevent reverse causation. In addition, we examined the exposure-disease relationship in various exposure windows for all cases and their matched controls and found consistent results. The risks were still high in patients who had a latent period for more than 10 years. The strong association between medical CT scans and cancers cannot be easily explained by selection bias.
There are a few limitations we need to address. First, we captured all CT scans from the health insurance data between 2000 and 2013. Despite almost complete coverage of the national health care system in Taiwan, we cannot rule out the possibility that CT was paid for out of pocket and was not documented in the health insurance dataset or was performed before the study period. In addition, we did not include mammography and X-ray in our study. This would lead to a random misclassification of our exposed and unexposed groups and could have potentially diminished the risk associated with medical CT.
Second, information on machine parameters for all CT scans for dose estimation was unavailable in our data. Several dose-reduction techniques have been implemented and have been successfully demonstrated to reduce radiation exposure, including tube-current modulation, reducing tube voltage, adaptive dose shielding, and noise reduction filters (31). However, their implementation depends on the scanner hardware and software available at different institutions. We did not have data to know the effect of these strategies on real dose reduction. In this study, the effective dose to the body was calculated to provide an approximate measure considering the potential detriment of medical radiation (1). The cancer risk is predicated on specific organ or tissue doses based on sex, age, body weight, type of CT procedure, the model of CT scanner, and type of radio contrast medium. Calculating the risk using these factors should provide a more exact risk analysis, and it has been used in many epidemiological studies. Although this is not perfect, the effective dose estimates should not affect our overall risk. In addition, our case-control pairs were matched by age, sex, and follow-up years, which minimized the potential noise from individual differences and calendar year. However, the confidence intervals for our risk estimates in high doses were wide because of limited numbers of patients receiving high doses of medical radiation from CT scans. A more detailed study on specific absorbed doses to individual organs and tissues, to quantify the association between medical diagnostic radiation and cancer risks, would generate important insights for the medical community.
Third, we are aware of potential confounding from the reasons for having a CT scan (32). We excluded all cancer cases who received a CT scan with any indication associated with cancer. In addition, we removed scans within a 3-year period in an attempt to minimize this effect. However, no early diagnostic screening exists for leukemia and lymphomas (33). Screening for thyroid cancer through CT is also unlikely because thyroid cancer is most commonly detected through the physical swelling of the neck, and it is confirmed by fine-needle aspiration (34). Because CT scans are not the first-line diagnostic tool for thyroid cancer, leukemia, and NHL, selection bias was minimized.
Fourth, the length of follow-up of this study was limited to a total of 13 years. Because exposure to ionizing radiation could cause a lifetime risk of cancer, our study was limited to a representation of a fraction of the total risk of cancer. Although we defined a 3-year latent period in the study, a longer follow-up time might have changed the risk for each type of cancer. Previous studies showed that the minimum latency periods were 0.4, 4, and 2.5 years for leukemia, solid tumors, and thyroid cancer, respectively (35). This may account for the higher risk we found for leukemia and thyroid cancer. However, when we repeated our analysis using a different latent period, we found a similar risk pattern for thyroid cancer, leukemia, and NHL.
CT scans are an important diagnostic tool, but they should be used judiciously. An estimated 20–50% of radiological examinations may be unnecessary or inappropriate (36). Extrapolation models estimated that 1.5–2.0% of cancers in the United States might be attributable to CT scans (37). Our findings back up this concern on the increased potential cancer risks to patients. Reduction of radiation dose per examination is essential for repeated examinations. Additionally, strategies to reduce radiation exposure through appropriate use of medical imaging would definitely optimize the benefit-risk ratio of CT scans.
Funding
None.
Notes
Affiliations of authors: Graduate Institute of Biomedical Informatics, College of Medical Science and Technology, Taipei Medical University, Taipei, Taiwan (YHS, KT); Clinical Big Data Research Center, Taipei Medical University Hospital, Taipei, Taiwan (YHS); Department of Biostatistics, Rutgers School of Public Health, Piscataway, NJ (SK); Division of Radiology, Taipei City Hospital Renai Branch, Taipei, Taiwan (Y-JW); Department of Epidemiology and Biostatistics, School of Public Health, SUNY Downtown Medical Center, Brooklyn, NY (KD).
The authors have no disclosures.
References
American Cancer Society. Cancer Facts & Figures 2014. Atlanta: American Cancer Society; 2014:1–73.
Adami H-O, Hunter DJ, Lagiou P, Mucci L, eds. Textbook of cancer epidemiology 3rd ed. Oxford: Oxford University Press; 2018.
Author notes
Authors contributed equally to this work.
