


Abstract
In advanced pancreatic ductal adenocarcinoma (aPDAC), there is no consensual strategy for second-line chemotherapy (L2). Better discrimination of overall survival (OS) may help clinical decision-making. We aimed to predict OS from the beginning of L2 and to assess the benefit from chemotherapy among the identified risk groups.
Analyses were derived from all consecutive aPDAC patients treated at Besancon University Hospital, Besancon, France, between January 2003 and December 2013 (n = 462). The association of 50 parameters with OS was evaluated using univariate and multivariable Cox analyses. Based on the final model, a prognostic nomogram and score were developed and externally validated. Patients in the external validation cohort who received L2 (n = 163) were treated at three French institutions between January 2010 and April 2016. All statistical tests were two-sided.
In the development cohort, 395 patients (85.5%) were eligible for L2, of which 261 (66.1%) were treated. Age, smoking status, liver metastases, performance status, pain, jaundice, ascites, duration of first-line, and type of L2 regimen were identified as independent prognostic factors for OS in L2. The score determined three groups with median OS of 11.3 months (95% confidence interval [CI] = 9.1 to 12.9 months), 3.6 months (95% CI = 2.6 to 4.7 months), and 1.4 months (95% CI = 1.2 to 1.7 months), for low-, intermediate-, and high-risk groups, respectively (P < .001). By applying the score in the population eligible for L2 but untreated, the chemotherapy benefit was statistically significant across all groups, but with a magnitude of the effect decreased statistically significantly from low- to high-risk groups (P = .001 for treatment and risk groups interaction term). The ability of the score to discriminate OS was confirmed in the external validation cohort.
This prognostic nomogram and score in patients with aPDAC can accurately predict OS before administration of L2 and may help clinicians in their therapeutic decisions.
Pancreatic ductal adenocarcinoma (PDAC) is the fourth cause of cancer-related death in developed countries (1), and it is expected to become the second leading cause of cancer death in 2030 (2). PDAC has the poorest prognostic among digestive malignancies with a five-year survival rate of 5% to 7%, with no important change in death rate between 1997 and 2013 (3). Surgical resection of localized PDAC is the only treatment that can provide prolonged survival. However, diagnosis is made at an advanced stage in the vast majority of cases (>80%). The median overall survival (OS) is about nine to 15 months in patients with locally advanced PDAC, and six to nine months in those with metastatic disease (4,5).
Advanced PDAC (aPDAC) remains a challenging, noncurable disease. Gemcitabine chemotherapy has been the only standard of care in this setting for more than a decade, until 2010. Major progress has been achieved in the landscape of aPDAC management during the five past years with the approval of two active cytotoxic combinations: the FOLFIRINOX (5-fluorouracil [5-FU], irinotecan, and oxaliplatin) and the gemcitabine plus nab-paclitaxel regimens. These regimens were shown to be superior to standard gemcitabine as first-line chemotherapy (L1) in patients with metastatic PDAC, yielding median OS of 11.1 months (95% confidence interval [CI] = 9.0 to 13.1 months) and 8.5 months (95% CI = 7.89 to 9.53 months), respectively (6,7). Currently, clinical practice guidelines for L1 are well established (8,9).
Beyond L1, about half of patients with aPDAC remain in good general condition, and thus may receive subsequent line(s) of chemotherapy (10). Combinations of 5-FU with oxaliplatin (11) or with nanoliposomal irinotecan (12) have shown interesting activity after failure of gemcitabine and can be proposed as second-line chemotherapy (L2) (8). Nevertheless, not all patients seem to benefit from L2 treatment, and L2 has to be discussed on an individual basis in terms of risk benefit for each patient. Of note, evidence to guide patient selection for L2 after progression under FOLFIRINOX or gemcitabine plus nab-paclitaxel regimen is scarce (13), and there is no validated strategy to date.
Age, Eastern Cooperative Oncology Group performance status (ECOG PS), and duration of L1 are so-called “pragmatic parameters,” which are frequently used in multidisciplinary meetings to estimate the potential benefit of L2, but the level of evidence is low (14,15). Thus, identification of reliable factors for patient prognostic stratification is warranted to improve therapeutic decision-making in this setting. However, there is no well-validated and widely accepted prognostic model for application in routine practice or clinical trial for L2 in aPDAC. In this context, it is urgent to develop useful prognostic tools that may help to estimate patient OS in order to guide clinicians’ decision for L2 administration and to optimize future clinical trial design.
In this prospective population-based cohort study, we aimed to develop and validate a prognostic nomogram and score to predict OS in patients with aPDAC who received L2 in routine clinical practice using a broad spectrum of parameters. Then, we assessed the benefit from chemotherapy across risk groups identified by this score.
Methods
Patients
All consecutive patients with histologically proven aPDAC (ie, metastatic, locally advanced, or recurrent after surgery) who were treated at Besancon University Hospital, Besancon, France, between January 2003 and December 2013 were involved in the development cohort. Patients were considered eligible for medical evaluation of L2 indication if they had received one previous line of chemotherapy, including adjuvant chemotherapy in the case of early postoperative tumor relapse (ie, within six months after the last administration of this treatment) and if they were not dead during L1. The external validation cohort included consecutive patients with aPDAC who received L2 with the same inclusion criteria in three other French institutions (Institute Mutualiste Montsouris, Henri Mondor and Reims University Hospitals) between January 2010 and April 2016. The main procedures for both cohorts are specified in the Supplementary Methods (available online). The database was registered and declared to the National French Commission for bioinformatics data and patient liberty (CNIL; No. of CNIL declaration: 1906173 v 0). The study is in accordance with standard procedures in France, with approval from the relevant institutional review boards. A general informed consent was signed by all patients with cancer at the time of their first visit in the Department of Medical Oncology. This consent allows use of their clinical and biological data in the cohort study. No additional specific informed consent for this study was necessary.
Demographics, cancer history, pathological, clinical, biological, and radiological (tumor response according to Response Evaluation Criteria in Solid Tumors [RECIST] v1.1 criteria) parameters at the beginning of L2 (or at the end of L1 for patients who did not receive L2), as well as treatment outcomes, were retrospectively collected from medical records.
Statistical Analysis
Median value (interquartile range) and frequency (percentage) were provided for the description of continuous and categorical variables, respectively. Medians and proportions were compared using Student’s t test and chi-square test (or Fisher’s exact test, if appropriate), respectively.
OS was calculated from the date of progression under L1 (or the date of first administration of L2 if no progression was observed under L1) to the date of death from any cause. Survival data were censored at the last follow-up. Progression-free survival (PFS) was calculated from the date of progression under L1 (or the date of first administration of L2 if no progression was observed under L1) to the date of progression or death from any cause, or the date of the last follow-up, at which point data were censored. OS and PFS were estimated using the Kaplan-Meier method and described using median or rate at specific time points with 95% confidence intervals. Follow-up duration was calculated using a reverse Kaplan-Meier estimation when feasible (16).
Cox proportional hazard models were performed to estimate hazard ratio (HR) and 95% confidence interval for factors associated with OS. The association of 50 baseline parameters with OS was first assessed using univariate Cox analyses, and then parameters with P values of less than .05 were entered into a final multivariable Cox regression model, after considering collinearity among variables with a correlation matrix. When used continuously in the Cox model, a potential nonlinear relationship between predictors and OS was first investigated using the fractional polynomials method to determine the best transformation for continuous variables (17–19) and validated by the restricted cubic splines method with graphical evaluation. The assumption of proportionality was checked by plotting log-minus-log survival curves and by cumulative martingale process plots.
Sensitivity analyses to explore the reliability of the univariate analysis and the robustness of the final multivariable model were performed with a stratified and a frailty approach by using a random component for the hazard function based on the L2 regimen, and with a full-model, a backward, a stepwise, and a forward procedure.
Accuracy of the final model was verified regarding two parameters: discrimination and calibration. The predictive value and the discrimination ability of the final model were assessed with the Harrell’s concordance index (C-index) (20). Random samples of the population were used to derive 95% confidence interval bootstrap percentile for the C-statistic. Calibration was assessed by visual examination of calibration plot. Internal validation of the final model was performed with a bootstrap sample procedure.
Improvement in discrimination ability of our final model compared with the classical approach (“pragmatic parameters”: age, ECOG PS, and duration of L1) was evaluated with the C-index. We used continuous net reclassification improvement (cNRI) (21) and integrated discrimination improvement (IDI) (22) to quantify the performance in risk reclassification of adding others parameters of the final model to the classical approach at six months after the beginning of L2.
The final model was used to establish a nomogram allowing the estimation of median and individual post-L1 OS probabilities at six, 12, 18, and 24 months. At a population level, a prognostic score was constructed with nomogram total points. To give a reasonable spread of risk, we chose to distinguish three prognostic groups according to their risk score levels, which were identified based on cut-points determined following the Cox method (23). Patients’ baseline key characteristics were compared between prognostic risk groups using Fisher’s exact test and the Kruskal-Wallis test for categorical and quantitative parameters, respectively. The discrimination abilities of the scores produced were assessed with the C-index by considering risk group classifications.
The prognostic score developed in patients who received L2 was applied to patients who did not receive L2 in order to assess the benefit from treatment in each group identified.
Another multivariable analysis was performed by including relevant biological data recorded but not initially selected in the multivariable analysis process because of their high rate of missing data.
The prognostic score discrimination ability was confirmed in an external validation cohort and evaluated with the C-index. To identify risk groups and determine their survival profile, the same development cohort–derived risk predictive algorithm was applied. A clinical benefit–centered accuracy of the final model was evaluated by a decision curve analysis (24) for both cohorts.
All analyses were performed using SAS version 9.4 (SAS Institute, Cary NC) and R software version 2.15.2 (R Development Core Team, Vienna, Austria; http://www.r-project.org). P values of less than .05 were considered statistically significant, and all tests were two-sided. Details on the interpretation of important statistical concepts are given in the Supplementary Methods (available online).
Results
Population-Based Prospective Cohort
Among 462 patients who had received L1 for aPDAC, 395 (85.5%) were eligible for medical evaluation of L2 indication; 261 (66.1%) of them actually received L2 and were included in the development cohort while 134 (33.9%) patients were not treated (Figure 1). Patient characteristics in the L2-treated and -untreated groups were statistically significantly different for age, ECOG PS, and duration of L1 (Table 1), corresponding to the three “pragmatic parameters.”
Patients characteristics according to second-line chemotherapy administration in the development cohort
| Characteristics | Population eligible for second-line chemotherapy (n = 395) | Second-line chemotherapy administration (n = 261) | No second-line chemotherapy administration (n = 134) | P* |
|---|---|---|---|---|
| Demographic parameters | ||||
| Age, median (IQR), y | 67.2 (60.8–74.9) | 65.8 (60.3–72.9) | 71.5 (63.2–76.9) | <.001 |
| Sex, No. (%) | .38 | |||
| Male | 233 (59.0) | 158 (60.5) | 75 (56.0) | |
| Female | 162 (41.0) | 103 (39.5) | 59 (44.0) | |
| Smoking status, No. (%) | .30 | |||
| Never smoker or former smoker | 296 (75.3) | 200 (76.9) | 96 (72.2) | |
| Current smoker | 97 (24.7) | 60 (23.1) | 37 (27.8) | |
| Missing | 2 | 1 | 1 | |
| Pathologic parameters at diagnosis of cancer | ||||
| Primary tumor site, No. (%) | .25 | |||
| Head | 237 (60.9) | 152 (58.9) | 85 (64.9) | |
| Body and/or tail | 152 (39.1) | 106 (41.1) | 46 (35.1) | |
| Missing | 6 | 3 | 3 | |
| Tumor stage, No. (%) | .42 | |||
| Localized | 92 (23.3) | 66 (25.3) | 26 (19.4) | |
| Locally advanced | 96 (24.3) | 61 (23.4) | 35 (26.1) | |
| Metastatic | 207 (52.4) | 134 (51.3) | 73 (54.5) | |
| Tumor extension at the beginning of L2 | ||||
| No. of metastatic sites, No. (%) | .87 | |||
| 0–1 | 244 (61.8) | 162 (62.1) | 82 (61.2) | |
| ≥2 | 151 (38.2) | 99 (37.9) | 52 (38.8) | |
| Liver metastases, No. (%) | .35 | |||
| No | 167 (42.2) | 106 (40.6) | 61 (45.5) | |
| Yes | 228 (57.7) | 155 (59.4) | 73 (55.5) | |
| Peritoneal metastases, No. (%) | .65 | |||
| No | 242 (61.3) | 162 (62.1) | 80 (59.7) | |
| Yes | 153 (38.7) | 99 (37.9) | 54 (40.3) | |
| Lung metastases, No. (%) | .43 | |||
| No | 304 (77.0) | 204 (78.2) | 100 (74.6) | |
| Yes | 91 (23.0) | 57 (21.8) | 34 (25.4) | |
| Bone metastases, No. (%) | .14 | |||
| No | 377 (95.4) | 252 (96.6) | 125 (93.3) | |
| Yes | 18 (4.6) | 9 (3.4) | 9 (6.7) | |
| Clinical parameters at the beginning of L2 | ||||
| Performance status (WHO), No. (%) | <.001 | |||
| 0 | 52 (15.5) | 47 (18.7) | 5 (6.0) | |
| 1 | 126 (37.6) | 118 (47.0) | 8 (9.5) | |
| ≥ 2 | 157 (46.9) | 86 (34.3) | 71 (84.5) | |
| Missing | 60 | 10 | 50 | |
| Body mass index, No. (%), kg/m2 | .02 | |||
| Normal weight (18.5–25) | 225 (59.5) | 167 (64.2) | 58 (49.1) | |
| Underweight (<18.5) | 66 (17.5) | 39 (15.0) | 27 (22.9) | |
| Overweight (25–30) and obesity (≥30) | 87 (23.0) | 54 (20.8) | 33 (28.0) | |
| Missing | 17 | 1 | 16 | |
| Pain†, No. (%) | .51 | |||
| No | 165 (48.7) | 119 (47.6) | 46 (51.7) | |
| Yes | 174 (51.3) | 131 (52.4) | 43 (48.3) | |
| Missing | 56 | 11 | 45 | |
| Jaundice, No. (%) | .07 | |||
| No | 280 (82.6) | 212 (84.8) | 68 (76.4) | |
| Yes | 59 (17.4) | 38 (15.2) | 21 (23.6) | |
| Missing | 56 | 11 | 45 | |
| Ascites, No. (%) | .92 | |||
| No | 274 (80.4) | 202 (80.5) | 72 (80.0) | |
| Yes | 67 (19.6) | 49 (19.5) | 18 (20.0) | |
| Missing | 54 | 10 | 45 | |
| Previous treatment at the beginning of L2 | ||||
| Primary tumor resection, No. (%) | .02 | |||
| Yes | 111 (28.3) | 83 (31.8) | 28 (21.6) | |
| No | 284 (71.7) | 178 (68.2) | 106 (78.4) | |
| First-line chemotherapy | ||||
| Type of L1 regimen, No. (%) | .009 | |||
| 5-FU ± oxaliplatin and/or irinotecan | 99 (25.1) | 76 (29.1) | 23 (17.2) | |
| Gemcitabine based | 296 (74.9) | 185 (70.9) | 111 (82.8) | |
| RECIST best response, No. (%) | .14 | |||
| Complete or partial response or stability | 223 (65.2) | 170 (67.5) | 53 (58.9) | |
| Progression disease | 119 (34.8) | 82 (32.5) | 37 (41.1) | |
| Missing | 53 | 9 | 44 | |
| Duration of L1, median (IQR), mo | 4.7 (2.3–8.1) | 5.7 (2.9–8.7) | 2.5 (0.8–5.8) | <.001 |
| Reason for discontinuation, No. (%) | .94 | |||
| Progression disease | 265 (67.1) | 176 (67.4) | 89 (66.4) | |
| Toxicity | 22 (5.6) | 15 (5.8) | 7 (5.2) | |
| Other | 108 (27.3) | 70 (26.8) | 38 (28.4) | |
| Median follow-up time (95% CI), mo | ‡ | § | 25.6 (14.6 to 101.0) |
χ2 tests or Fisher’s exact tests used to compare proportions, and Wilcoxon tests used to compare continuous variables between the groups with or without second-line chemotherapy administration. All statistical tests were two-sided. 5-FU = 5-fluorouracil; IQR = interquartile range; L1 = first-line chemotherapy; L2 = second-line chemotherapy; WHO = World Health Organization.
Corresponding to prescription of morphine.
All patients were followed until death (maximum time observed = 126.1 months) except 28 censored patients with a median follow-up equal to 11.7 months.
All patients were followed until death (maximum time observed = 126.1 months) except 14 censored patients with a median follow-up equal to 14.1 months.
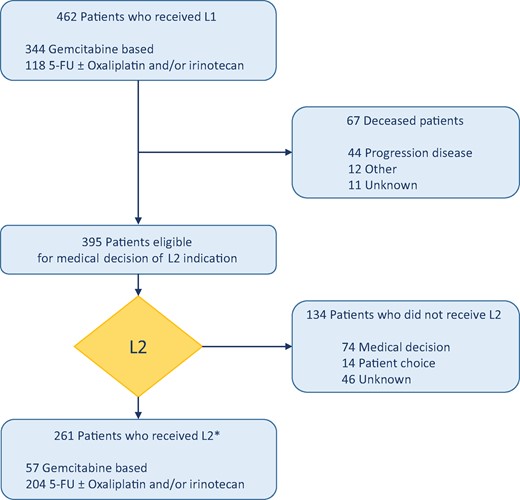
Flow chart. *Almost half of patients (44.1%) in L2 received a third line or more (up to seven lines). 5-FU = 5-fluorouracil; L1 = first-line chemotherapy; L2 = second-line chemotherapy.
In the external validation cohort, 163 patients with aPDAC who received L2 treatment were analyzed, and 126 events (deaths) were observed. The two cohorts displayed similar patient characteristics, except for the type of L1 and L2 regimens (Supplementary Table 1, available online).
Determinants of OS in Patients Receiving L2
In univariate Cox analysis, we identified 27 parameters as prognostics factors for OS with P values of less than .05 (Table 2). The main analyses did not include biological parameters because of the high rate of missing data in some of them. A correlation matrix was used to detect statistically significant correlations between investigated parameters (Supplementary Figure 1, available online). When a correlation was identified, only the most clinically relevant variable was considered in the multivariable model. The multivariable Cox analysis showed nine independent risk factors for OS: age, smoking status, liver metastases, ECOG PS, pain, jaundice, ascites, duration of L1, and type of L2 regimen (Table 3). The transformations used for continuous variables are summarized in Supplementary Figure 2 (available online).
Prognostics factors associated with overall survival in univariate analysis
| Parameters | No. of patients | No. of events | HR (95% CI) | P* |
|---|---|---|---|---|
| Demographic parameters | ||||
| Age, y | 261 | 247 | 1.02 (1.00 to 1.03) | .04 |
| Sex | ||||
| Male | 158 | 152 | 1 | |
| Female | 103 | 95 | 0.80 (0.62 to 1.04) | .07 |
| Smoking status | ||||
| Never smoker or former smoker | 200 | 187 | 1 | |
| Current smoker | 60 | 59 | 1.53 (1.14 to 2.07) | .005 |
| Missing | 1 | 1 | ||
| Personal history of cancer | ||||
| No | 210 | 197 | 1 | |
| Yes | 49 | 48 | 1.16 (0.84 to 1.59) | .37 |
| Missing | 2 | 2 | ||
| Family history of cancer | ||||
| No | 146 | 138 | 1 | |
| Yes | 113 | 107 | 0.85 (0.66 to 1.10) | .22 |
| Missing | 2 | 0 | ||
| Family history of pancreatic cancer | ||||
| No | 240 | 227 | 1 | |
| Yes | 19 | 18 | 1.18 (0.73 to 1.91) | .51 |
| Missing | 2 | 2 | ||
| Pathologic parameters at diagnosis of cancer | ||||
| Primary tumor site | ||||
| Head | 152 | 142 | 1 | |
| Body and/or tail | 106 | 102 | 1.25 (0.97 to 1.62) | .09 |
| Missing | 3 | 3 | ||
| Primary tumor size, mm | 242 | 229 | 1.01 (1.00 to 1.01) | .21 |
| Missing | 19 | 18 | ||
| Histological grade | ||||
| Well or moderately differentiated | 100 | 92 | 1 | |
| Poorly differentiated or undifferentiated | 28 | 26 | 1.33 (0.86 to 2.07) | .20 |
| Missing | 133 | 129 | ||
| Tumor stage | ||||
| Localized | 66 | 61 | 1 | |
| Locally advanced | 61 | 57 | 1.15 (0.80 to 1.65) | |
| Metastatic | 134 | 129 | 1.80 (1.32 to 2.45) | <.001 |
| Tumor extension at the beginning of L2 | ||||
| No. of metastatic sites | ||||
| 0–1 | 162 | 152 | 1 | |
| ≥2 | 99 | 95 | 1.69 (1.31 to 2.19) | <.001 |
| Lymph node metastases | ||||
| No | 240 | 230 | 1 | |
| Yes | 21 | 17 | 0.80 (0.49 to 1.31) | .37 |
| Liver metastases | ||||
| No | 106 | 100 | 1 | |
| Yes | 155 | 147 | 1.74 (1.35 to 2.26) | <.001 |
| Peritoneal metastases | ||||
| No | 162 | 148 | 1 | |
| Yes | 99 | 99 | 1.61 (1.24 to 2.08) | <.001 |
| Lung metastases | ||||
| No | 204 | 193 | 1 | |
| Yes | 57 | 54 | 0.93 (0.69 to 1.26) | .63 |
| Bone metastases | ||||
| No | 252 | 239 | 1 | |
| Yes | 9 | 8 | 0.86 (0.42 to 1.74) | .67 |
| Other metastases | ||||
| No | 257 | 243 | 1 | |
| Yes | 4 | 4 | 1.19 (0.44 to 3.22) | .73 |
| Isolated lung metastases | ||||
| No | 248 | 235 | 1 | |
| Yes | 13 | 12 | 0.52 (0.29 to 0.93) | .03 |
| Performance status (WHO) | ||||
| 0 | 47 | 40 | 1 | |
| 1 | 118 | 115 | 1.97 (1.37 to 2.85) | |
| ≥2 | 86 | 83 | 4.62 (3.11 to 6.85) | <.001 |
| Missing | 10 | 9 | ||
| Body mass index, kg/m2 | 260 | 247 | 0.98 (0.95 to 1.02) | .36 |
| Missing | 1 | 0 | ||
| Body mass index, kg/m2 | ||||
| Normal weight (18.5–25) | 167 | 160 | 1 | |
| Underweight (<18.5) | 39 | 36 | 1.18 (0.82 to 1.70) | |
| Overweight (25–30) and obesity (≥30) | 54 | 51 | 0.94 (0.68 to 1.29) | .56 |
| Missing | 1 | 0 | ||
| Pain† | ||||
| No | 119 | 109 | 1 | |
| Yes | 131 | 128 | 1.89 (1.45 to 2.45) | <.001 |
| Missing | 11 | 10 | ||
| Jaundice | ||||
| No | 212 | 200 | 1 | |
| Yes | 38 | 37 | 2.68 (1.87 to 3.85) | <.001 |
| Missing | 11 | 10 | ||
| Ascites | ||||
| No | 202 | 190 | 1 | |
| Yes | 49 | 48 | 2.14 (1.55 to 2.95) | <.001 |
| Missing | 10 | 9 | ||
| Biological parameters at the beginning of L2 | ||||
| Hemoglobin, g/dL | 233 | 223 | 0.82 (0.75 to 0.90) | <.001 |
| Missing | 28 | 24 | ||
| Neutrophils, mm3 (square root value) | 219 | 210 | 1.02 (1.01 to 1.02) | <.001 |
| Missing | 42 | 37 | ||
| Lymphocytes, mm3 (inverse transformation value) | 212 | 204 | 2.28 ×10134 (1.336 ×1030 to 3.88 ×10238) | .01 |
| Missing | 49 | 43 | ||
| Neutrophil-to-lymphocyte ratio (square root value) | 210 | 202 | 1.67 (1.42 to 1.96) | <.001 |
| Missing | 51 | 45 | ||
| Platelets, mm3 (log value) | 230 | 220 | 1.53 (0.87 to 2.69) | .14 |
| Missing | 31 | 27 | ||
| Creatinine, µmol/L (log value) | 247 | 234 | 0.79 (0.26 to 2.36) | .67 |
| Missing | 14 | 13 | ||
| Total bilirubin, µmol/L (square root value) | 218 | 209 | 1.15 (1.09 to 1.22) | <.001 |
| Missing | 43 | 38 | ||
| Albumin, g/L | 161 | 155 | 0.94 (0.91 to 0.96) | <.001 |
| Missing | 100 | 92 | ||
| CA19-9, UI/mL (square root value) | 204 | 195 | 1.01 (1.01 to 1.01) | <.001 |
| Missing | 57 | 52 | ||
| CEA, ng/mL (log value) | 159 | 150 | 1.86 (1.47 to 2.34) | <.001 |
| Missing | 102 | 97 | ||
| Previous treatment at the beginning of L2 | ||||
| Primary tumor resection | ||||
| Yes | 83 | 76 | 1 | |
| No | 178 | 171 | 1.56 (1.20 to 2.07) | .001 |
| Adjuvant chemotherapy | ||||
| Yes | 67 | 61 | 1 | |
| No | 194 | 186 | 1.59 (1.18 to 2.13) | .002 |
| Radiotherapy | ||||
| Yes | 17 | 15 | 1 | |
| No | 244 | 232 | 1.11 (0.66 to 1.88) | .69 |
| Neo-adjuvant chemotherapy | ||||
| Yes | 3 | 3 | 1 | |
| No | 258 | 244 | 1.01 (0.32 to 3.15) | .99 |
| Biliary stent | ||||
| Yes | 83 | 78 | 1 | |
| No | 177 | 168 | 0.84 (0.64 to 1.10) | .21 |
| Missing | 1 | 1 | ||
| Duodenal stent | ||||
| Yes | 19 | 18 | 1 | |
| No | 241 | 228 | 0.82 (0.50 to 1.32) | .41 |
| Missing | 1 | 1 | ||
| Alcohol celiac plexus | ||||
| Yes | 22 | 21 | 1 | |
| No | 238 | 225 | 0.75 (0.48 to 1.17) | .20 |
| Missing | 1 | 1 | ||
| First-line chemotherapy | ||||
| Type of L1 regimen | ||||
| 5-FU ± oxaliplatin and/or irinotecan | 76 | 69 | 1 | |
| Gemcitabine based | 185 | 178 | 1.11 (0.84 to 1.47) | .46 |
| No. of cures | 261 | 247 | 0.99 (0.98 to 1.00) | .01 |
| RECIST best response | ||||
| Complete or partial response or stability | 170 | 161 | 1 | |
| Progression disease | 82 | 77 | 1.38 (1.05 to 1.81) | .02 |
| Missing | 9 | 9 | ||
| Duration of L1 (log value), mo | 261 | 247 | 0.55 (0.39 to 0.78) | <.001 |
| Toxicity of grade 3 or 4 | ||||
| No | 198 | 189 | 1 | |
| Yes | 63 | 58 | 0.83 (0.62 to 1.12) | .22 |
| Type of toxicity | ||||
| Digestive | 8 | 7 | 1 | |
| Neurological | 17 | 14 | 0.96 (0.39 to 2.39) | |
| Skin | 4 | 4 | 2.29 (0.65 to 8.05) | |
| Hematology | 20 | 20 | 1.73 (0.72 to 4.12) | |
| Other | 14 | 13 | 1.70 (0.67 to 4.32) | .30 |
| Missing | 198 | 189 | ||
| Reason for discontinuation | ||||
| Other | 70 | 61 | 1 | |
| Toxicity | 15 | 15 | 1.27 (0.72 to 2.24) | |
| Progression disease | 176 | 171 | 1.58 (1.17 to 2.11) | <.01 |
| Locoregional progression | ||||
| No | 207 | 196 | 1 | |
| Yes | 54 | 51 | 0.94 (0.69 to 1.28) | .69 |
| Metastatic progression | ||||
| No | 67 | 61 | 1 | |
| Yes | 194 | 186 | 1.44 (1.07 to 1.93) | .02 |
| Second-line chemotherapy | ||||
| Type of L2 regimen | ||||
| 5-FU ± oxaliplatin and/or irinotecan | 204 | 192 | 1 | |
| Gemcitabine based | 57 | 55 | 1.49 (1.10 to 2.02) | .01 |
Cox proportional hazard models used to estimate association of the parameters with overall survival. Values of P < .05 were considered statistically significant, and all tests were two-sided. 5-FU = 5-fluorouracil; CA 19-9 = carbohydrate antigen 19-9; CEA = carcinoembryonic antigen; HR = hazard ratio; CI = confidence interval; L1 = first-line chemotherapy; L2 = second-line chemotherapy; WHO = World Health Organization.
Corresponding to prescription of morphine.
Prognostics factors associated with overall survival in multivariable analysis (n = 248)*
| Parameters | No. of patients | No. of events | HR (95% CI) | P† | Internal validation BCA HR 95% | β | Max scores in nomogram |
|---|---|---|---|---|---|---|---|
| Demographic parameters | |||||||
| Age, y | 248 | 235 | 1.02 (1.00 to 1.04) | .02 | 1.00 to 1.04 | 0.01921 | 55 |
| Smoking status | |||||||
| Never smoker or former smoker | 190 | 178 | 1 | ||||
| Current smoker | 58 | 57 | 1.50 (1.09 to 2.05) | .01 | 1.02 to 2.14 | 0.39946 | 21 |
| Tumor extension at the beginning of L2 | |||||||
| Liver metastases | |||||||
| No | 99 | 93 | 1 | ||||
| Yes | 149 | 142 | 2.15 (1.62 to 2.85) | <.001 | 1.48 to 2.94 | 0.76502 | 40 |
| Clinical parameters at the beginning of L2 | |||||||
| Performance status (WHO) | |||||||
| 0 | 47 | 40 | 1 | ||||
| 1 | 117 | 114 | 1.61 (1.07 to 2.37) | 1.01 to 2.39 | 0.47879 | 25 | |
| ≥2 | 84 | 81 | 3.06 (1.94 to 4.82) | <.001 | 1.75 to 4.72 | 1.11671 | 58 |
| Pain‡ | |||||||
| No | 118 | 108 | 1 | ||||
| Yes | 130 | 127 | 1.41 (1.06 to 1.88) | .02 | 0.99 to 1.85 | 0.34442 | 18 |
| Jaundice | |||||||
| No | 210 | 198 | 1 | ||||
| Yes | 38 | 37 | 1.96 (1.33 to 2.89) | <.001 | 1.19 to 2.98 | 0.67192 | 35 |
| Ascites | |||||||
| No | 200 | 188 | 1 | ||||
| Yes | 48 | 47 | 1.79 (1.26 to 2.54) | <.001 | 1.21 to 2.76 | 0.58335 | 30 |
| Treatment | |||||||
| Duration of L1 (log value), mo | 248 | 235 | 0.48 (0.33 to 0.70) | <.001 | 0.33 to 0.81 | −0.73868 | 100 |
| Type of L2 regimen | |||||||
| 5-FU ± oxaliplatin and/or irinotecan | 195 | 184 | 1 | ||||
| Gemcitabine based | 53 | 51 | 1.77 (1.27 to 2.46) | <.001 | 1.18 to 2.49 | 0.56827 | 30 |
The final multivariable Cox model was obtained by entering risks factors from the univariate model that achieved P ≤ .05 as the thresholds in a single multivariable proportional hazards model. 5-FU = 5-fluorouracil; HR = hazard ratio; CI = confidence interval; BCA = accelerated bootstrap confidence interval; L1 = first-line chemotherapy; L2 = second-line chemotherapy; WHO = World Health Organization.
Cox proportional hazard models used to estimate association of the parameters with overall survival. Values of P < .05 were considered statistically significant, and all tests were two-sided.
Corresponding to prescription of morphine.
In the sensitivity analyses, associations remained unchanged in the univariate and multivariable analyses (Supplementary Tables 2–7, available online).
Performance Assessment and Internal Validation of the Final Model
The multivariable model exhibited good discrimination ability (C-index = 0.75, 95% CI = 0.72 to 0.78). The calibration plots showed an optimal agreement between model prediction and actual observation for predicting OS probability at six, 12, 18, and 24 months (Supplementary Figure 3, available online). In the internal validation, uncertainties around hazard ratio measured with a bootstrapping procedure reflected the robustness of the final model (Table 3).
Assessment in OS Discrimination Ability of the Final Model Compared With the Classical Approach
The input of six parameters identified in the final model (smoking status, liver metastases, pain, jaundice, ascites, and type of L2 regimen) in addition to those frequently used in multidisciplinary meetings (“pragmatic parameters”: age, ECOG PS, and duration of L1) (Supplementary Table 8, available online) statistically significantly improved its discrimination capacity because the C-statistic increased from 0.70 to 0.75 (difference = 0.05, 95% CI = 0.02 to 0.08).
Similarly, their addition adequately reclassified patients at lower risk of death and those at higher risk, as reported by a cNRI of 0.79 (95% CI = 0.56 to 1.0, P < .001) at six months (Supplementary Figure 4, available online), with an IDI of 0.14 (95% CI = 0.10 to 0.18, P < .001) (Supplementary Figure 5, available online).
Prognostic Nomogram and Score for OS
A nomogram integrating all statistically significant independent factors for OS was built (Figure 2). The prognostic score was based on the total number of points obtained from the nomogram. This prognostic score assumed a normal distribution (Supplementary Figure 6, available online). Based on the Cox method, patients were categorized into three risk groups (low, intermediate, and high) with median OS of 11.3 months (95% CI = 9.1 to 12.9 months), 3.6 months (95% CI = 2.6 to 4.7 months), and 1.4 months (95% CI = 1.2 to 1.7 months), respectively (P < .001) (Figure 3A). Approaches with two risk groups (high and low risk) are presented in Supplementary Figure 7 (available online). Patient characteristics in each risk group are described in Supplementary Table 9 (available online).
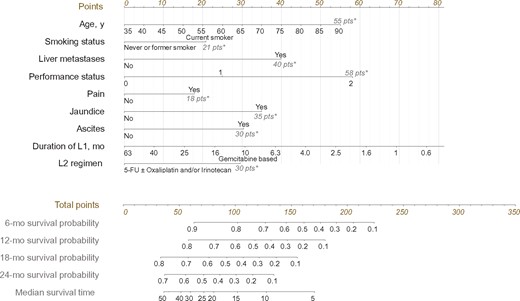
Prognostic nomogram to predict individual overall survival probability at the beginning of second-line chemotherapy in patients with advanced pancreatic ductal adenocarcinoma. First, the points associated with each of the nine prognostic factors are obtained via upward vertical translation of the patient’s variable value to the line labeled “Points.” Next, the points are summed and the corresponding total number is reported as a dot on the line labeled “Total points.” A vertical line is then drawn downward from the total point dot to obtain the overall survival prediction at the intersection with the “6-,” “8-,” “12-,” and “24-month survival probability” and “median survival time” lines. An online, web-based, smartphone-compatible application was developed that provides individualized survival estimates from the nomogram: http://www.umqvc.org/en/tool/proscap.html. *The value in gray at the right end of the line corresponds to the maximum number of points for each factor. 5-FU = 5-fluorouracil; L1 = first-line chemotherapy; L2 = second-line chemotherapy.
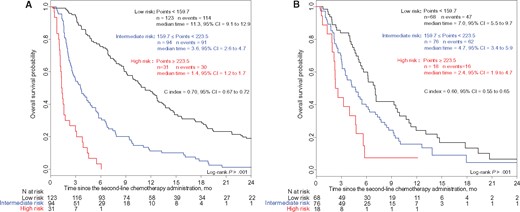
Kaplan-Meier curves of overall survival for three risk groups in the development cohort (A) and in the external validation cohort (B). An online, web-based, smartphone-compatible application was developed that provides risk group classification for overall survival from the prognostic score: http://www.umqvc.org/en/tool/proscap.html. Values of the log-rank test P < .05 were considered statistically significant, and all tests were two-sided. CI = confidence interval.
This prognostic score was applied to patients who did not receive an L2, after assigning to each patient a type of regimen according to the chemotherapy that could have been proposed in multidisciplinary meeting. Similarly, patients were categorized into the same three risk groups (low, intermediate, and high risk) previously identified with statistically significantly different prognostic profiles (Supplementary Figure 8, available online). Then, the risk groups were compared according to L2 administration or not (Supplementary Figure 9, available online) and described in Supplementary Table 10 (available online). The benefit of L2 was higher in better prognostic groups with a statistically significant interaction term between risk groups and L2 administration (P = .01) (Supplementary Tables 11 and 12, available online).
PFS Analysis
PFS analysis was investigated in the OS risk groups identified (low, intermediate, and high). Interestingly, the discriminative ability of the three-group model was confirmed in L2 PFS analysis (Supplementary Figure 10, available online). Approaches for the two risk groups are presented in Supplementary Figure 11 (available online).
Clinico-biological Model
The multivariable model with biological parameters was established based on patients for whom the 11 parameters were available, including two independent biological factors: neutrophil-to-lymphocyte ratio (NLR) and carbohydrate antigen 19-9 (CA19-9) (Supplementary Table 13, available online). Supplementary analyses are specified in the Supplementary Materials and provided in Supplementary Tables 14 and 15 (stratified and random approaches and multiple imputations, respectively, available online).
External Validation of the Prognostic Score
Information for the nine baseline parameters that were required for the score calculation was available for 162 (99%) patients from the external validation cohort. As expected, the external validation cohort differed from the development cohort (Supplementary Table 1, available online).
The good discrimination ability of the final model developed in the main analysis was externally confirmed (C-index = 0.63, 95% CI = 0.58 to 0.69). We identified the same risk groups with OS applying to Kaplan-Meier curves (P < .001) (Figure 3B).
Clinical Benefit Analysis
The clinical benefit–centered accuracy of the final model was confirmed by a decision curve analysis in both cohorts (Figure 4). The decision curve analysis shows a threshold of risk of death at six months at which decisions will cause greater benefit for true positives and decision of false positives will be reduced. The net benefit for decisions based on our final multivariable model for threshold values greater than 20% (Figure 4A) and 40% (Figure 4B) is better than considering patients on the same level of risk. Here the decision is defined by the possibility of not treating a patient by L2. In this context, the clinician must ensure that the patient is at high risk of death at six months and minimize false positives, that is, patients who are still alive at six months who must be treated. Overall, the decision curve shows that the net benefit for decision based on our final multivariable model is of interest, especially for thresholds greater than 0.5, the area of interest.
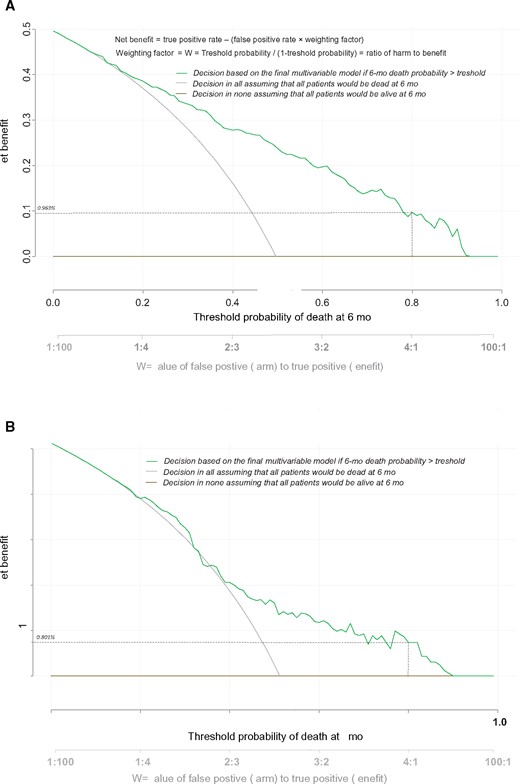
Decision curves to plot the net benefit achieved by making clinical decisions based on the final multivariable model risk of death predictions at six months in the development cohort (A) and in the external validation cohort (B).
Discussion
PDAC is a highly aggressive cancer, and chemotherapy remains the cornerstone of advanced disease therapy. While the clinical indications for L1 are well described and consensual (8), decision-making regarding L2 is a much more controversial issue. OS improvement with L2 has been reported in patients with gemcitabine-refractory PDAC (25,26). Nevertheless, the analysis of 34 clinical trials comparing L2 with best supportive care showed that the benefit remains modest and limited to selected patients (15). Moreover, because of a lack of high-level evidence, no guidelines are available for L2 after FOLFIRINOX (6) or gemcitabine plus nab-paclitaxel L1 regimens (7).
A prognostic model is a useful tool for clinical management by predicting patient life expectancy. The purpose of implementing such a scoring system, using easily measurable clinical parameters, is to guide clinical decision-making in routine practice and to propose patient risk stratification for clinical trials. Currently, no validated prognostic model is available to estimate OS in patients with aPDAC at the beginning of L2. Some scores have been proposed but failed to complete validation process because of small sample sizes with insufficient statistical power (27,28). More recently, Sinn et al. (14) developed a score based on prognostic factors including ECOG-PS, CA19-9, and duration of L1, but the performance and internal validation of the final model were not assessed.
From a large population-based study, we established a new straightforward prognostic model. We identified prognostic factors for survival of patients with aPDAC who received L2 and derived a prognostic model based on nine easily available clinical parameters. Of note, the administration of a 5-FU ± oxaliplatin and/or irinotecan regimen in L2 is statistically significantly associated with longer overall survival than a gemcitabine- based regimen, regardless of the type of L1 initially received. However, the aim of this study was not to compare treatment response, and the superiority of the 5-FU ± oxaliplatin and/or irinotecan regimen is probably multifactorial, involving patient-, tumor-, and treatment-related factors, and should be considered an exploratory finding warranting evaluation in further dedicated studies. Smoking status is a factor associated with an increased risk of PDAC (29), and here we demonstrate that it is also a negative prognostic factor (30). In the clinico-biological model, two parameters were identified, CA19-9 and NLR, whose relevance was previously demonstrated in the L1 setting (31,32). We developed a robust prognostic nomogram for individual estimation of patient survival. In addition, the prognostic score allows classifying patients into three risk groups. Both tools are available in an open access version on a smartphone-compatible website (http://www.umqvc.org/en/tool/proscap.html).
Our results highlight considerable heterogeneity in survival in patients with PDAC who receive L2, and our prognostic score may help to refine patient selection for L2. Even if “pragmatic parameters” are already frequently used for decision-making in multidisciplinary meeting, our final model improves the discrimination ability compared with this classical approach. Interestingly, the risk groups identified based on OS matched with the risk groups for PFS. Therefore, through the PFS analysis, the prognostic value of our scoring system was confirmed independently from the “background noise” of the eventual following lines of chemotherapy for both patient-related (OS) and tumor-related (PFS) outcomes. Overall, we confirmed the survival benefit of L2 for all patients with aPDAC, although a decreasing clinical benefit was observed from low- to high-risk groups. In addition to strengthening decision-making for clinicians, these tools may be beneficial for better selection of patients for treatment, for stratified random assignment to ensure well-balanced treatment groups, and for a potential optimization of clinical trial design. The development of risk-adapted strategies for aPDAC second-line management in the future could be also considered in the different risk groups identified by the score.
Our study has several strengths. We evaluated a large population including patients treated with FOLFIRINOX regimen in both cohorts. Parameters used in the model are clinically relevant, simple to collect for clinicians, and consistent with previous studies. We built our model in a rigorous methodological framework, using a recent recommended checklist for nomograms (33) and providing transparent reporting of the multivariable model as suggested in the TRIPOD statement (34). Moreover, discrimination, calibration, and internal validation demonstrated the satisfactory performance and validity of the model. Our prognostic score was externally replicated in routine clinical practice in three other institutions. The reproducibility of the results observed in the development cohort in a clinically different external validation cohort reinforce their generalizability. The clinical benefit–centered accuracy of the final model was confirmed by the decision curve analysis.
The inclusion period in our study was long; meanwhile, clinical practices have changed with the approval of the FOLFIRINOX and gemcitabine plus nab-paclitaxel chemotherapy. This highlights the reliability of our model in the era of these new treatment regimens and not only in gemcitabine-refractory patients. One limitation of our model is the heterogeneity in L1 treatment regimens. It would be of interest to assess similar prognostic tools in homogenous patient groups for L1. Another limitation of the study is the absence of patients treated with nab-paclitaxel in the development cohort, as well as the presence of only six patients who received this treatment in the validation cohort. An external validation in different countries will definitively confirm the worldwide relevance of the model. Moreover, the predictive value of the score in terms of the benefit of L2 was not explored in the external validation cohort. Furthermore, in the development cohort, the untreated patient group was too small and with a high level of missing data to propose a specific tool in this population. Additional variables, particularly albumin (28,35) or serum C-reactive protein levels (27,36), could not be evaluated in our study because of the retrospective nature of the data collection, with a high rate of missing data, and may be relevant to assess in further studies. Accumulating evidence for the prognostic value of health-related quality of life (HRQoL) for OS prediction in metastatic pancreatic cancer (37,38) and in other tumor types (39–41) suggests that HRQoL should also be evaluated in the future models for aPDAC. The less discriminatory ability of the model in the external validation cohort may be improved by additional inputs in the future (biological data, HRQoL).
In conclusion, we propose a novel OS prediction model based on nine key independent clinical prognostic factors at the beginning of L2 in patients with aPDAC. Our study highlights considerable heterogeneity in the survival of patients who receive L2. We identify three distinct risk groups in which chemotherapy was found to be statistically significantly beneficial but with unequal benefit magnitude across risk groups. This study allowed us to develop and externally validate a prognostic model for OS and provide functional tools at individual (nomogram) and population (score) levels. These tools can accurately predict OS before administration of L2 and thereby improve risk stratification and patient selection for routine clinical decision-making and future clinical trials.
Notes
We thank Florian Limousin (graphic designer and independent web developer in Pearlweb society) for the web development application support.
Author’s contributions: conception and design: AV, AM, FB, CB, DV; collection and assembly of data: all authors; data analysis and interpretation: AV, CN, CB, DV; manuscript writing: all authors; final approval of manuscript: all authors.
The authors declare no potential conflicts of interest.
References
Author notes
Authors contributed equally to this work.

