


Abstract
Background: Previous studies have documented that hospice enrollment by terminally ill cancer patients varies substantially by patient characteristics and across broad geographic regions, but little is known about how local practice patterns and individual physicians contribute to these variations. We examined hospice use within a regional integrated health care delivery system that provides consistent insurance coverage and hospice availability for its members to evaluate the relative importance of patient characteristics, physician characteristics, individual physicians, and local health centers in explaining variations in hospice enrollment. Methods: We examined data for 3805 Kaiser Permanente of Northern California health plan enrollees who were diagnosed with and died of lung, colorectal, breast, or prostate cancer from January 1, 1996, through June 30, 2001. We used a random-effects linear probability hierarchical model to estimate adjusted hospice enrollment rates and identify factors associated with hospice enrollment. All P values are two-sided. Results: Overall, 65.4% of patients enrolled in hospice care before death. In adjusted analyses, hospice enrollment did not vary by patients' race/ethnicity or marital status (all P >.2) but varied substantially among the 11 health centers where patients were treated (standard deviation [SD] of random effect = 10.0 percentage points, corresponding to an estimated adjusted hospice enrollment rate for two-thirds of centers (2 SDs) ranging from 55% to 75%, P = .02). Hospice enrollment varied less among the 675 individual physicians (SD = 4.6 percentage points; P = .09). Conclusions: Health care within a large integrated delivery system has the potential to eliminate racial and ethnic disparities in hospice use, but substantial variation in hospice use persists among local health centers. Focused efforts to understand how patients, physicians, and hospices interact at the local level are important to ensure equal access to hospice care for all terminally ill cancer patients.
Cancer is the second leading cause of death in the United States, accounting for nearly one-quarter of all deaths ( 1 ) . Many terminally ill cancer patients die with pain or other uncontrolled symptoms, with too little psychosocial support, or after receiving aggressive care that may be of limited benefit ( 2 ) . Hospice care can improve symptom management and the quality of life for terminally ill patients ( 3 – 5 ) . However, despite recent increases in hospice enrollment ( 6 ) , many patients who are eligible for hospice care are not enrolled ( 6 , 7 ) or are enrolled late in the course of their illness ( 8 , 9 ) .
Previous studies have found that rates of hospice enrollment vary among cancer patients based on patient and area-level characteristics. For example, patients who are young ( 10 , 11 ) , white ( 10 , 12 – 15 ) , or married ( 11 , 16 , 17 ) , reside in urban (versus rural) areas ( 10 , 11 ) , or are enrolled in managed care (versus fee-for-service) health plans ( 12 , 18 , 19 ) are more likely to enroll in a hospice than other patients. In addition, hospice enrollment rates vary substantially by geographic area ( 10 , 11 , 20 , 21 ) and are higher among individuals who live in more affluent areas ( 10 ) and in areas that have greater managed care penetration ( 10 ) , fewer hospital beds per capita ( 10 ) , and less use of chemotherapy at the end of life ( 22 ) .
The physicians who see patients who are at the end of life may also influence hospice enrollment ( 23 ) . Physician specialty, board certification, and knowledge ( 23 ) and a physician's beliefs about the benefits of hospice care ( 24 ) are associated with how frequently they refer patients to hospice care. Few data are available, however, about the actual variations in hospice referral by individual physicians.
In this study, we examined data on hospice use among patients who were enrolled in an integrated health care delivery system to address three important questions. First, we assessed whether hospice use varied with respect to nonclinical factors, such as race, income, education level, and region of residence, even within an integrated delivery system that provided consistent insurance coverage and hospice availability for all patients. Second, we examined whether hospice use varied by health center or by individual physician within this integrated delivery system. Third, we used hierarchical models to examine the relative importance of patient characteristics, physician characteristics, the individual physicians, and the individual health centers in hospice use variability. By simultaneously assessing these potentially important factors in a large regional health care delivery system, our study was designed build on existing knowledge about variations in hospice care by providing new and deeper insights about the role of local and provider-specific factors that influence access to hospice services for patients with advanced cancers.
M ETHODS
Data Sources and Study Cohort
We used clinical and administrative data from Kaiser Permanente of Northern California, a large integrated health care system that provides care for approximately 35% of the adult population of this region at 18 geographically distinct health centers ( Appendix I ). The data included information from the Kaiser Permanente Cancer Registry (which collects data regarding all new cancer diagnoses among system members and reports those data directly to the Surveillance, Epidemiology, and End Results [SEER] cancer registries for Northern California), outpatient and hospice encounter data, patient enrollment data, and physician data. The cancer registry data include information on date and cause of death obtained from state vital statistics.
From the Kaiser Permanente Cancer Registry, we selected all patients aged 21 years or older who were diagnosed with invasive lung, colorectal, breast, or prostate cancer from January 1, 1996, through June 30, 2001, and died of their cancer during the same period. Patients included in this study were required to have been enrolled continuously in Kaiser Permanente of Northern California during the 18 months before their cancer diagnosis through the date of death and to have had no more than a 1-month gap in enrollment. We excluded patients who were diagnosed at death or autopsy ( n = 4), whose tumor histology suggested a primary cancer other than those of interest ( n = 3), or whose month of diagnosis was not known ( n = 28). We also excluded patients who received care at one of the seven Kaiser Permanente health centers that did not have a local affiliated hospice ( Appendix I ) ( n = 892) because we could not capture complete information about hospice use for these patients. Finally, we excluded 564 patients who died within 1 month of their cancer diagnosis because our algorithm for assigning patients to physicians (described below) required at least a 1-month period between diagnosis and death, and we excluded 97 patients for whom we could not identify a principal physician. The final sample included 3805 patients (2646 patients with lung cancer, 551 patients with colorectal cancer, 378 patients with breast cancer, and 230 patients with prostate cancer).
Assignment of Patients to Physicians
We assigned each patient to a principal physician based on the patient's outpatient care during the 6 months before the patient enrolled in hospice care or, for patients who did not enroll in hospice care, during the 6-month period from 7 months before death through 1 month before death. The lower limit of this range (1 month) was chosen because the median number of days before death among hospice enrollees was 31 days. Patients who had at least one visit with an oncologist during this period ( n = 2720) were assigned to an oncologist as their principal physician. If a patient saw more than one oncologist, we assigned the oncologist with whom they had the most visits. Patients who did not see an oncologist during this period but who saw a primary care physician (i.e., a general internist, family practitioner, or gynecologist) ( n = 1027) were assigned the primary care physician as their principal physician. Patients who did not see any of these types of physicians ( n = 58) were assigned to a specialist who was the most likely to have treated their particular cancer (e.g., a pulmonologist for lung cancer patients, a gastroenterologist for colorectal cancer patients). The 3805 patients included in this study were seen by 675 physicians (53 medical oncologists, 582 primary care providers, and 40 physicians of other specialties). The mean number of study patients cared for by these physicians was 5.6 (median = 1, range = 1–110). The mean number of patients was 51 for medical oncologists (median = 55; range = 1–110), 1.8 for primary care providers (median = 1, range = 1–13), and 1.4 for other specialists (median = 1, range 1–5).
The 675 physicians practiced in one of 11 health centers ( Appendix I ) served by nine local Kaiser Permanente-affiliated hospices (two hospices are each located in close proximity to two health centers). More than 90% of hospice enrollees enrolled at the hospice that was located in the same geographic area as their health center. In rare cases, patients were diverted to other hospices if the closest hospice was temporarily at capacity.
Hospice Enrollment
We examined whether patients enrolled in hospice care at any time between diagnosis and death. For patients who enrolled in hospice care, we calculated the number of days from the date of hospice admission until the date of death or disenrollment.
Patient and Provider Characteristics
We obtained information about patients' ages, sex, race and Hispanic ethnicity, marital status, and health centers from the Kaiser Permanente enrollment file. We obtained information about tumor stage (local, regional, distant) ( 25 ) and the dates of diagnosis and death from the Kaiser Permanente Cancer Registry. We used data from the 2000 U.S. Census to obtain information on patients' education and income levels according to their census block group of residence. We evaluated comorbidity by using the Deyo modification of the Charlson comorbidity score ( 26 , 27 ) after removing the codes for lung, colorectal, breast, prostate, and metastatic cancers. We obtained information about physician specialty, age, sex, and ethnicity from the Kaiser Permanente provider file. We categorized variables as listed in Table 1 . Age was categorized in approximate 10-year categories. Medical centers are labeled with the letters A through K to preserve anonymity.
Patient and physician characteristics and hospice enrollment among patients with lung, colorectal, breast, or prostate cancer who died of their cancer
| Characteristic | No. of patients (%) | Percentage of patients who used hospice care before death | P* |
|---|---|---|---|
| Total | 3805 (100) | 65.4 | |
| Patient age at diagnosis, y | |||
| <55 | 473 (12) | 63.9 | .72 |
| 55–64 | 836 (22) | 64.4 | |
| 65–74 | 1315 (35) | 65.8 | |
| ≥75 | 1181 (31) | 66.2 | |
| Patient sex | |||
| Male | 1998 (53) | 64.3 | .15 |
| Female | 1807 (47) | 66.5 | |
| Patient race/ethnicity † | |||
| Non-Hispanic white | 2999 (79) | 64.9 | .28 |
| Hispanic | 205 (5) | 62.9 | |
| Black | 378 (10) | 67.7 | |
| Asian | 206 (5) | 68.9 | |
| Patient marital status | |||
| Unmarried | 1450 (38) | 65.2 | .90 |
| Married | 2355 (62) | 65.4 | |
| Primary tumor site | |||
| Lung | 2646 (70) | 66.7 | .01 |
| Colorectal | 551 (14) | 64.6 | |
| Breast | 378 (10) | 58.5 | |
| Prostate | 230 (6) | 63.0 | |
| Stage at diagnosis | |||
| Localized | 462 (12) | 62.3 | <.001 |
| Regional | 1063 (28) | 60.4 | |
| Distant metastases | 2144 (56) | 68.8 | |
| Unknown | 136 (4) | 60.3 | |
| Median annual household income in patient's census block group of residence (quartiles) ‡ , $ | |||
| <43 797 | 882 (23) | 64.7 | <.001 |
| 43 797–58 030 | 879 (23) | 62.2 | |
| 58 031–76 109 | 881 (23) | 68.7 | |
| >76 109 | 880 (23) | 68.6 | |
| Unknown | 283 (7) | 56.5 | |
| High school graduates in patient's census block group of residence (quartiles) ‡ , % | |||
| <80 | 917 (24) | 67.4 | .02 |
| 80–87 | 861 (23) | 66.1 | |
| 88–93 | 949 (25) | 65.1 | |
| >93 | 795 (21) | 65.7 | |
| Unknown | 283 (7) | 56.5 | |
| Charlson index § | |||
| 0 | 1994 (52) | 63.4 | .05 |
| 1 | 1076 (28) | 68.6 | |
| 2 | 454 (12) | 66.5 | |
| 3 | 197 (5) | 66.5 | |
| ≥4 | 84 (2) | 60.7 | |
| Time from diagnosis to death | |||
| ≥2 y | 525 (14) | 65.1 | .007 |
| 1–2 y | 805 (21) | 69.4 | |
| 6 mo–1 y | 945 (25) | 66.1 | |
| 2–6 mo | 1073 (28) | 64.3 | |
| 1–2 mo | 457 (12) | 59.3 | |
| Year of death | |||
| 1996 | 258 (7) | 62.4 | <.001 |
| 1997 | 596 (16) | 72.8 | |
| 1998 | 767 (20) | 63.9 | |
| 1999 | 874 (23) | 67.1 | |
| 2000 | 972 (26) | 62.7 | |
| 2001 | 338 (9) | 61.2 | |
| Physician age in 2000, y | |||
| <35 | 140 (4) | 55.0 | .001 |
| 36–45 | 713 (19) | 62.4 | |
| 46–55 | 2176 (57) | 67.2 | |
| >55 | 669 (18) | 66.2 | |
| Unknown | 103 (3) | 55.1 | |
| Physician sex | |||
| Male | 2894 (76) | 65.8 | .28 |
| Female | 911 (24) | 63.9 | |
| Physician race | |||
| Non-Hispanic white | 2552 (67) | 66.0 | .005 |
| Hispanic | 167 (4) | 70.1 | |
| Black | 173 (5) | 71.1 | |
| Asian | 797 (21) | 63.0 | |
| Other/unknown | 116 (3) | 52.6 | |
| Physician specialty | |||
| Primary care provider | 1027 (27) | 57.8 | <.001 |
| Oncologist | 2720 (71) | 68.2 | |
| Other | 58 (2) | 63.8 | |
| Kaiser center ‖ | |||
| A | 393 (10) | 79.6 | <.001 |
| B | 445 (12) | 73.9 | |
| C | 536 (14) | 73.7 | |
| D | 245 (6) | 68.2 | |
| E | 380 (10) | 68.2 | |
| F | 192 (5) | 65.6 | |
| G | 177 (5) | 65.0 | |
| H | 191 (5) | 61.3 | |
| I | 364 (10) | 58.2 | |
| J | 361 (9) | 53.7 | |
| K | 521 (14) | 49.9 |
Using the chi-square test (two-sided).
Information about race was missing for 17 patients.
Census block group was unknown for 283 patients.
Charlson comorbidity index excluded codes for lung, colorectal, breast, and prostate cancers and all metastatic tumors.
Kaiser centers are lettered to preserve anonymity.
Statistical Analyses
We described rates of hospice enrollment by health center and by individual physician within each center for high-volume physicians (defined a priori as those who saw at least 15 patients in our cohort). We applied a shrinkage factor to the variance estimates for the high-volume physicians to reduce excess variation due to sampling error. However, it is important to point out that shrunken estimates tend to underestimate the true variation ( 28 ) . We used the chi-square test to examine associations between patient and provider characteristics and hospice enrollment.
We used random-effects linear hierarchical probability models in which patients were nested within physicians who were nested within centers to evaluate the relative contribution of the individual physician and the center in explaining the variation in hospice enrollment ( 29 ) . The models included random effects for the physicians and centers to estimate the effect of physicians and centers on hospice enrollment as well as fixed effects for patient and physician characteristics. The random-effects modeling strategy estimates the real variation in hospice enrollment among physicians and among centers after removing sampling variation at the patient level. We present the standard deviations (SDs) of the center effect and the physician effect; these standard deviations quantify the variation associated with each level of interest (e.g., center, physician). We also present the estimated change in the probability of hospice enrollment (expressed as a percentage with 95% confidence intervals [CIs]) for each patient and physician characteristic based on the regression coefficient from the hierarchical regression models.
We conducted three sensitivity analyses. In the first, we restricted the analyses to patients who were initially diagnosed with metastatic disease because this cohort of patients had a relatively poor prognosis and would generally be considered good candidates for hospice enrollment. In the second, we assigned each patient to a principal physician based on his or her outpatient care during the 3 months before hospice enrollment or, for patients who did not enroll in a hospice, the 3-month period from 4 months before death through 1 month before death—a period that was closer to the patients' date of death. In the third, because we were concerned that being seen by an oncologist during the 6-month period of interest could be more a reflection of whether the patient was known to have active disease than of the specialty of the physician, we repeated the analyses by stratifying patients according to whether they had seen an oncologist during the 6-month period. This third sensitivity analysis also in effect compared hospice referral for high-volume (≥15 patients) versus low-volume (<15 patients) physicians because all of the 44 high-volume physicians were oncologists whereas only nine of the 631 low-volume physicians were oncologists.
All analyses were performed using SAS statistical software (version 9.1; SAS Institute, Cary, NC), and two-sided P values are presented. Statistical significance was defined as P <.05. The study protocol was approved by the Institutional Review Boards of Harvard Medical School and the Kaiser Foundation Research Institute.
R ESULTS
The mean age at diagnosis of patients in the cohort was 68 years (SD = 11.3), and 47% of the patients were female, 10% black, 5% Hispanic, and 62% married ( Table 1 ). Overall, 65.4% of patients enrolled in hospice care. Among hospice enrollees, the median duration of enrollment was 31 days (interquartile range [IQR] = 13–81 days) and the mean number of days enrolled was 73.7 days (SD = 119.2 days).
Table 1 shows the unadjusted rates of hospice enrollment by patient and physician characteristics. Rates of hospice enrollment did not differ by patient age at diagnosis, sex, race/ethnicity, or marital status. Lung cancer patients were the most likely to enroll in hospice care (66.7%), and breast cancer patients were least likely (58.5%). Patients who had metastatic cancer at diagnosis were more likely to enroll than patients who had local, regional, or unknown-stage cancer. Hospice enrollment was higher for patients who lived in areas in the top two quartiles of median income than for patients who lived in areas in the bottom two quartiles but did not differ substantially by the percentage of high school graduates in the census block group of residence (although patients for whom census-level data were unknown had lower rates of hospice enrollment than patients for whom such data were known). Hospice enrollment was lowest among patients who died within 1–2 months of diagnosis. The rate of hospice enrollment was highest among patients who died in 1997 (72.8%) and lowest among those who died in 2001 (61.2%), although there was no consistent trend across the study period.
Rates of hospice enrollment also varied by the age, race, and specialty of the principal physician. Patients whose principal physician was 45 years old or younger were less likely to enroll in hospice care than other patients, and patients who had seen an oncologist were more likely to enroll in hospice care (68.2%) than patients who had not seen an oncologist (57.8%) ( Table 1 ). The unadjusted rates of hospice enrollment by health center ranged from 49.9% to 79.6% ( Fig. 1 ). The rates of hospice enrollment among the patients of physicians who saw 15 or more patients in our cohort (all of whom were oncologists) ranged from 49.3% to 80.2% ( Fig. 1 , stars). In general, average rates of hospice enrollment among patients of the high-volume physicians were higher overall than the average rates of hospice enrollment among patients of the low-volume physicians ( Fig. 1 , triangles).
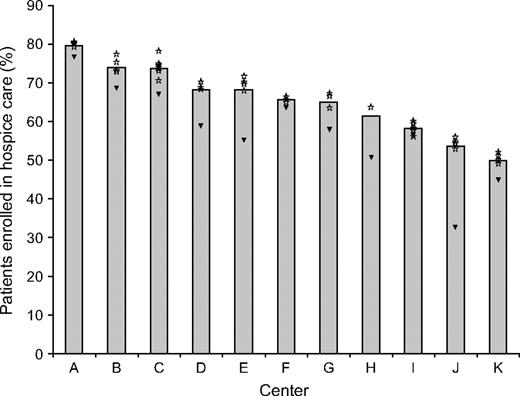
Unadjusted rates of hospice enrollment by health center. Bars indicate the unadjusted rates of hospice enrollment by heath center. Stars indicate the rates of hospice enrollment for patients of individual physicians who treated at least 15 patients in the cohort (i.e., high-volume physicians), by health center. Triangles indicate the overall rate of hospice enrollment for patients treated by all other physicians in that center. Shrinkage estimates were used for each of the high-volume physicians to remove excess variation due to sampling error.
We used a hierarchical regression model that included random effects for physician characteristics and health center and fixed effects for patient and physician characteristics. The effect of health center on the rate of hospice enrollment was statistically significant ( P = .02); the standard deviation in the rate of hospice use by center was 10.0 percentage points. Thus, the difference in hospice enrollment rates between centers that had rates one standard deviation below the mean rate and centers that had rates one standard deviation above the mean rate (a range that included approximately two-thirds of the centers) was 20.0 percentage points, which corresponded to an estimated adjusted hospice enrollment rate range of 55% to 75%. The individual physician effect was of borderline statistical significance ( P = .09); the comparable two–standard deviation range for within-region individual physician effect was 9.2 percentage points.
Table 2 presents adjusted estimated differences in hospice enrollment by patient and physician characteristics. Patient characteristics that were statistically significantly associated with higher rates of hospice enrollment included being 75 years or older at diagnosis (versus being younger than 55 years), being female, living in areas with income in the top two quartiles (versus the bottom quartile), and having metastatic cancer at diagnosis. Patients with breast cancer were less likely to enroll in hospice care than patients with lung cancer, and patients diagnosed within 1 year of death were less likely to enroll in hospice care than those diagnosed 2 or more years before death. The only physician characteristic that was associated with hospice enrollment was physician specialty. Patients who saw an oncologist were statistically significantly more likely to enroll in hospice care than those who did not see an oncologist (by 8.2 percentage points, P <.001).
Hierarchical linear probability model assessing the contribution of patient and physician characteristics to rates of hospice enrollment ( N = 3805) *
| Characteristic | Estimated difference in the rate of hospice enrollment, percentage points (95% CI) † | P‡ |
|---|---|---|
| Patient age at diagnosis, y | ||
| <55 | Referent | |
| 55–64 | 0.6 (−4.7 to 5.9) | .81 |
| 65–74 | 3.1 (−2.0 to 8.2) | .23 |
| ≥75 | 7.5 (2.2 to 12.8) | .006 |
| Patient sex | ||
| Male | Referent | |
| Female | 3.6 (0.3 to 6.9) | .03 |
| Patient race § | ||
| Non-Hispanic white | Referent | |
| Hispanic | −2.9 (−9.4 to 3.6) | .37 |
| Black | 0.4 (−5.0 to 5.8) | .90 |
| Asian | 1.3 (−5.3 to 7.9) | .69 |
| Patient marital status | ||
| Unmarried | Referent | |
| Married | −0.4 (−3.6 to 2.8) | .79 |
| Tumor site | ||
| Lung | Referent | |
| Colorectal | −3.3 (−7.7 to 1.1) | .14 |
| Breast | −10.9 (−17.0 to −4.9) | <.001 |
| Prostate | −4.8 (−11.7 to 2.1) | .17 |
| Stage at diagnosis | ||
| Local | Referent | |
| Regional | −1.6 (−6.8 to 3.6) | .55 |
| Metastatic | 11.1 (6.0 to 16.2) | <.001 |
| Unknown | 4.0 (−5.0 to 13.0) | .38 |
| Median annual household income in patient's census block group of residence (quartiles) § , $ | ||
| <43 797 | Referent | |
| 43 797–58 030 | −2.8 (−7.4 to 1.8) | .24 |
| 58 031–76 109 | 5.5 (0.5 to 10.5) | .03 |
| >76 109 | 6.4 (0.7 to 12.1) | .03 |
| High school graduates in patient's census block group of residence (quartiles)§, % | ||
| <80 | Referent | |
| 80–87 | −1.6 (−5.9 to 2.7) | .47 |
| 88–93 | −1.8 (−6.4 to 2.8) | .44 |
| >93 | −5.0 (−10.3 to 0.3) | .06 |
| Charlson comorbidity index ‖ | ||
| 0 | Referent | |
| 1 | 3.9 (0.2 to 7.6) | .04 |
| 2 | 1.3 (−3.0 to 5.6) | .56 |
| 3 | 4.8 (−1.0 to 10.6) | .11 |
| ≥4 | −5.8 (−14.1 to 2.5) | .17 |
| Time from diagnosis to death | ||
| ≥2 y | Referent | |
| 1–2 y | −4.3 (−9.6 to 1.0) | .12 |
| 6 mo–1 y | −11.7 (−17.3 to −6.1) | <.001 |
| 2–6 mo | −14.6 (−20.3 to −8.9) | <.001 |
| 1–2 mo | −19.0 (−25.9 to −12.1) | <.001 |
| Year of death | ||
| 1996 | Referent | |
| 1997 | 7.4 (0.6 to 14.2) | .03 |
| 1998 | −2.5 (−9.2 to 4.2) | .46 |
| 1999 | −0.2 (−6.8 to 6.4) | .95 |
| 2000 | −5.2 (−11.8 to 1.4) | .12 |
| 2001 | −8.1 (−15.9 to −0.3) | .04 |
| Physician age in 2000 § , y | ||
| <35 | Referent | |
| 36–45 | −1.9 (−11.0 to 7.2) | .68 |
| 46–55 | 3.0 (−6.1 to 12.1) | .52 |
| >55 | 2.6 (−7.5 to 12.7) | .48 |
| Physician sex | ||
| Male | Referent | |
| Female | −1.0 (−5.6 to 3.6) | .65 |
| Physician race | ||
| Non-Hispanic white | Referent | |
| Hispanic | 2.4 (−7.6 to 12.4) | .63 |
| Black | 0.3 (−9.8 to 9.0) | .94 |
| Asian | 2.5 (−2.5 to 7.5) | .33 |
| Other/unknown | −29.0 (−59.6 to 2.0) | .07 |
| Physician specialty | ||
| Primary care provider | Referent | |
| Oncologist | 8.2 (3.8 to 12.6) | <.001 |
| Other | 8.7 (−3.7 to 21.1) | .17 |
Using a random-effects linear probability model. The model included random effects for physician and center to account for clustering of patients within physicians and physicians within centers and also included fixed effects for the patient and physician characteristics included in the table. CI = confidence interval.
Estimated change in hospice enrollment for the estimate of expected change for a linear probability model, calculated as regression coefficient × 100.
Two-sided P values for the fixed effect of the patient and physician characteristics in the model.
Indicator variables were included in the model for the 283 patients for whom the census block group of residence was not available, for the 17 patients with no information on race, and for the 103 patients for whom information was missing on the age of their physician.
Charlson comorbidity index excluded codes for lung, colorectal, breast, and prostate cancers and all metastatic tumors.
In the first sensitivity analysis, we restricted the cohort to patients who were diagnosed with metastatic disease and obtained results that were similar to the original model except that the individual physician effect was smaller (SD = 2.4 percentage points) and was no longer of borderline statistical significance ( P = .36). In the second sensitivity analysis, we assigned patients to principal physicians based on the patient's outpatient care during the 3-month period before hospice enrollment for hospice enrollees or during the 1 to 4 months before death for patients who did not enroll in hospice care. Estimates were nearly identical to those obtained with our original model (data not shown). In the third sensitivity analysis, we restricted the sample first to patients who saw an oncologist and then to patients who did not see an oncologist. For both models, results were very similar to those obtained in the original model except that the size of the individual physician effect for the model restricted to patients who did not see an oncologist was larger than that in the original model (SD = 10.6 percentage points) but was still of borderline statistical significance ( P = .09).
D ISCUSSION
We found high rates of hospice enrollment among cancer patients enrolled in a large integrated health care delivery system and little variation in those rates based on patient sociodemographic characteristics. Our results suggest that an integrated health care delivery system model may successfully eliminate disparities in access to hospice care. Nevertheless, we identified large differences in the rates of hospice enrollment based on the health center where patients received outpatient care and moderate differences (of borderline statistical significance) in hospice enrollment based on the individual physicians who saw the patients.
The large center effect that we observed (an SD of 10.0 absolute percentage points, which corresponds to estimated adjusted enrollment rates that range from 55% to 75% for two-thirds of the centers) is larger than the effects of being diagnosed with metastatic cancer or seeing an oncologist in the months before death. Thus, even within an integrated health care delivery system with consistent insurance coverage, the local practice environment or center at which a patient receives care is one of the most important determinants of whether that patient enrolls in hospice care. This finding is consistent with other data ( 20 ) that suggest that variation in rates of hospice use across health care markets is not explained by market characteristics but instead is likely influenced by local factors.
Several local factors may explain the large variations in hospice enrollment among cancer patients by health center. Centers may vary in the propensity of oncologists and patients to continue attempts at curative therapy, or they may differ in the availability of palliative care programs that work with physicians to transition patients to hospice care. For example, some health centers may have providers who champion the benefits of hospice enrollment to physicians, nurses, and patients and their families. In addition, the hospices themselves may differ in their procedures for recruiting and admitting patients, which may make enrolling a patient more or less difficult. Hospices may also differ in their willingness and ability to provide palliative treatments, which may influence referral, especially if patients are likely to benefit from palliative chemotherapy. Finally, hospice staffing may influence the capacity of hospice services in a local area. Our analyses included patients who were diverted to other hospices if the closest hospice was temporarily at capacity. However, knowledge of chronic staffing problems could potentially influence a provider's propensity to refer patients to hospice care.
Few data are available about the contribution of physicians to variations in hospice enrollment. Results of previous studies suggest that physicians have positive attitudes about hospice care ( 24 , 30 – 32 ) and that those with more positive attitudes and better self-rated knowledge about hospice care refer more patients to hospices ( 24 ) . Although we did not have information about the knowledge or beliefs about hospice care for the physicians who treated the patients in our study, our finding of a moderate variation (of borderline statistical significance) in hospice enrollment rates among individual physicians suggests that physicians are likely to influence their patients' access to hospices. In another study ( 30 ) , physicians reported important barriers that prevented them from referring patients to hospice care, including difficulty in predicting how long a patient had to live, as well as having limited time to discuss end-of-life issues because of the rapid demise of patients with terminal illness ( 30 ) . Higher rates of hospice enrollment among patients who are seeing an oncologist might mean simply that the presence of active cancer had been better recognized in that group rather than reflecting a true difference in practice style between oncologists and non-cancer specialists. Alternatively, oncologists may have more experience than other types of physicians in caring for terminally ill patients and thus may interact more frequently with the local hospices, which may lead to more hospice referrals.
Our study has several limitations. First, we did not know patients' preferences for enrollment in a hospice, nor did we have information about individual physicians' attitudes about hospice care. However, our use of hierarchical models allowed us to account for differing practice patterns of the physicians. Second, some investigators have questioned the validity of retrospective studies of end-of-life care for cancer patients because it is not always possible to identify the point at which physicians perceive their patients' terminal status ( 33 ) . Although we could not be sure that all patients in our sample had been recognized by their physicians as being terminally ill before they died, we restricted our analyses to patients who were diagnosed with cancer and who also died of their cancer to maximize the likelihood that we were studying a cohort of terminally ill patients ( 34 ) . Moreover, results of our sensitivity analyses among patients with metastatic disease at diagnosis and among patients who were seeing a medical oncologist were similar to those for analyses that included all patients. Third, the rates of hospice use we observed within the single large integrated health care delivery system we studied were higher than those reported in other studies of patients in managed care systems ( 12 , 18 , 19 ) . The rate of hospice enrollment in our study was higher in part because we restricted our cohort to patients who died of their cancer within a defined period, most of whom had metastatic cancer when diagnosed, and we excluded patients who had died within 30 days of diagnosis. Although these restrictions may limit the generalizability of our findings to other groups of patients, they are not likely to influence our overall results concerning variations in hospice use by patient characteristics, physicians, and center, which was an important distinctive feature of our study. Finally, a larger dataset will be required to confirm the normality and homoscedasticity assumptions of our random-effects models ( 29 ) .
Our results indicate that health care within a large integrated delivery system that provides consistent insurance coverage and availability of hospice services for all patients has the potential to eliminate disparities in hospice use by race and ethnicity but that, even within such a system, substantial geographic variations in hospice use remain. To better understand these variations, future studies should examine local differences in the availability of palliative care programs, intensity of treatment for patients with metastatic cancer, and physician and staff attitudes about hospice care. In addition, understanding differences among hospices in enrollment procedures, staffing, and communication with oncologists and other physicians may clarify how the hospices themselves contribute to variations in use. Our findings suggest that such focused efforts to understand how patients, physicians, and hospices interact at the local level may be essential to ensure equal access to hospice care for all terminally ill cancer patients.
A PPENDIX I
Kaiser Permanente of Northern California Health Centers
Fresno
Hayward*
Martinez
Oakland*
Redwood City*
Richmond
Roseville
Sacramento*
San Francisco*
San Rafael
Santa Clara*
Santa Rosa
Santa Teresa
South Sacramento*
South San Francisco*
Stockton
Vallejo*
Walnut Creek*
*Centers that have a local affiliated hospice.
This work was funded by the National Cancer Institute (grant U01 CA93324) through the Cancer Care Outcomes Research and Surveillance Consortium. Dr. Keating's effort was also supported in part by a Clinical Scientist Development Award from the Doris Duke Charitable Foundation. The sponsors had no role in the design and conduct of the study, the collection, management, analysis, or interpretation of the data, or the preparation, review, or approval of the manuscript.
We thank Barbara J. McNeil, MD, PhD, Craig C. Earle, MD, and Nicholas Christakis, MD, PhD, for helpful comments on an earlier version of the manuscript.
References
Anderson R, Smith B. Deaths: leading causes for 2002. Hyattsville (MD): Centers for Disease Control and Prevention;
Institute of Medicine, editor. Approaching death—improving care at the end of life. Washington, D.C.: National Academy Press;
Greer DS, Mor V. An overview of National Hospice Study findings.
Greer DS, Mor V, Morris JN, Sherwood S, Kidder D, Birnbaum H. An alternative in terminal care: results of the National Hospice Study.
Wallston KA, Burger C, Smith RA, Baugher RJ. Comparing the quality of death for hospice and non-hospice cancer patients.
Medicare Payment Advisory Commission (MedPAC). Report to the Congress: Medicare beneficiaries' access to hospice. Washington, D.C.: MedPac;
Christakis NA, Escarce JJ. Survival of Medicare patients after enrollment in hospice programs.
General Accounting Office. Medicare: More beneficiaries use hospice; many factors contribute to shorter periods of use. Washington, D.C.: General Accounting Office;
Virnig BA, Kind S, McBean M, Fisher E. Geographic variation in hospice use prior to death.
Lackan NA, Ostir GV, Freeman JL, Mahnken JD, Goodwin JS. Decreasing variation in the use of hospice among older adults with breast, colorectal, lung, and prostate cancer.
Virnig BA, Persily NA, Morgan RO, DeVito CA. Do Medicare HMOs and Medicare FFS differ in their use of the Medicare hospice benefit?
Talamantes MA, Lawler WR, Espino DV. Hispanic American elders: caregiving norms surrounding dying and the use of hospice services.
Ngo-Metzger Q, McCarthy EP, Burns RB, Davis RB, Li FP, Phillips RS. Older Asian Americans and Pacific Islanders dying of cancer use hospice less frequently than older white patients.
Greiner KA, Perera S, Ahluwalia JS. Hospice usage by minorities in the last year of life: results from the National Mortality Followback Survey.
Lackan NA, Freeman JL, Goodwin JS. Hospice use by older women dying with breast cancer between 1991 and 1996.
Lackan NA, Ostir GV, Kuo YF, Freeman JL. The association of marital status and hospice use in the USA.
McCarthy EP, Burns RB, Ngo-Metzger Q, Davis RB, Phillips RS. Hospice use among Medicare managed care and fee-for-service patients dying with cancer.
Virnig BA, Fisher ES, McBean AM, Kind S. Hospice use in Medicare managed care and fee-for-service systems.
Iwashyna TJ, Chang VW, Zhang JX, Christakis NA. The lack of effect of market structure on hospice use.
Wennberg JE, Fisher ES, Stukel TA, Skinner JS, Sharp SM, Bronner KK. Use of hospitals, physician visits, and hospice care during last six months of life among cohorts loyal to highly respected hospitals in the United States.
Earle CC, Neville BA, Landrum MB, Ayanian JZ, Block SD, Weeks JC. Trends in the aggressiveness of cancer care near the end of life.
Bradley EH, Fried TR, Kasl SV, Cicchetti DV, Johnson-Hurzeler R, Horwitz SM. Referral of terminally ill patients for hospice: frequency and correlates.
Bradley EH, Cramer LD, Bogardus ST Jr, Kasl SV, Johnson-Hurzeler R, Horwitz SM. Physicians' ratings of their knowledge, attitudes, and end-of-life-care practices.
Young JJ, Roffers S, Ries L, Fritz A, Hurlbut A. SEER Summary Staging Manual—2000: codes and coding instructions. Bethesda (MD): National Cancer Institute;
Charlson ME, Pompei P, Ales KL, MacKenzie CR. A new method of classifying prognostic comorbidity in longitudinal studies: development and validation.
Deyo RA, Cherkin DC, Ciol MA. Adapting a clinical comorbidity index for use with ICD-9-CM administrative databases.
Shen W, Louis TA. Triple-goal estimates in two-stage hierarchical models. J R Stat Soc B Stat Methodol
Leyland A, Goldstein H. Multilevel modeling of health statistics. Chichester (United Kingdom): Wiley;
Brickner L, Scannell K, Marquet S, Ackerson L. Barriers to hospice care and referrals: survey of physicians' knowledge, attitudes, and perceptions in a health maintenance organization.
Ogle K, Mavis B, Wang T. Hospice and primary care physicians: attitudes, knowledge, and barriers.
Iwashyna TJ, Christakis NA. Attitude and self-reported practice regarding hospice referral in a national sample of internists.
Bach PB, Schrag D, Begg CB. Resurrecting treatment histories of dead patients: a study design that should be laid to rest.

