


Abstract
Background: The epidermal growth factor receptor (EGFR) tyrosine kinase inhibitor erlotinib (also known as Tarceva or OSI-774) has shown promising response rates in malignant gliomas. We investigated the association between expression of EGFR and downstream signaling components and the response of malignant gliomas to erlotinib in a phase I trial of erlotinib administered either alone or with the alkylating agent temozolomide. Methods: Expression of EGFR and ligand-independent EGFRvIII mutant proteins and of phosphorylated protein kinase B (PKB)/Akt in specimens from glioma patients were assessed by immunohistochemistry. EGFR gene amplification was evaluated by fluorescence in situ hybridization. Mutations in PTEN and EGFR were assessed by polymerase chain reaction amplification and sequencing. Response was evaluated by sequential magnetic resonance imaging every 2 months. The Cochran–Mantel–Haenzel test was used to assess associations between biomarker status and response. All statistical tests were two-sided. Results: Of 41 glioma patients, eight responded to treatment. Response to erlotinib was associated with EGFR expression ( P = .07) and EGFR amplification ( P = .08). These associations were stronger and statistically significant among the 29 patients initially diagnosed with glioblastoma multiforme ( P = .03 and P = .02, respectively). Among six responders with sufficient tumor tissue, none had EGFRvIII mutations. None of the 22 tumors with high levels of phosphorylated PKB/Akt responded to erlotinib treatment, whereas eight of the 18 tumors with low levels of phosphorylated PKB/Akt responded to erlotinib treatment ( P <.001). The level of phosphorylated PKB/Akt was also associated with time to progression ( P <.001). Conclusions: Among glioma patients, those with glioblastoma multiforme tumors who have high levels of EGFR expression and low levels of phosphorylated PKB/Akt had better response to erlotinib treatment than those with low levels of EGFR expression and high levels of phosphorylated PKB/Akt.
New insights into genetic aberrations in human tumors are providing possible biomarkers that are being investigated for their association with the course of disease and its response to therapy. Anticancer agents have been designed to target specific molecular abnormalities, and some of these agents have proven clinically efficacious. For example, agents that block the HER2/neu receptor (also known as ErbB-2), a member of the epidermal growth factor receptor (EGFR) family, and the c-ABL tyrosine kinase have been studied in randomized trials and are now the standard of care for specific malignancies ( 1 , 2 ) . In clinical trials evaluating these agents, selection of patients whose tumors harbored the targeted aberrations was critical to demonstrating clinically significant objective response rates and enhanced patient survival ( 3 ) .
Agents that target EGFR (also known as ErbB-1) have also shown clinical promise ( 4 ) ; their development has been stimulated by the high proportion of human cancers that overexpress EGFR, including breast, colon, lung, ovarian, pancreatic, and brain tumors ( 5 ) . The association between EGFR overexpression and poor prognosis ( 6 ) has provided an additional stimulus to develop EGFR inhibitors, including antibodies and small-molecule inhibitors.
Two small-molecule inhibitors of EGFR, gefitinib (also known as Iressa or ZD1839) and erlotinib (also known as Tarceva or OSI-774), have been widely tested in human malignancies, but associations between the expression of EGFR and responses to these agents have been unclear ( 7 – 10 ) . Recently, however, a study of patients with non–small-cell lung cancer (NSCLC) found that those patients whose tumors possess somatic EGFR mutations that may confer increased protein kinase activity had better response to gefitinib than patients whose tumors had normal EGFR ( 11 , 12 ) . Screening of other tumor types did not disclose similar EGFR mutations ( 12 ) , suggesting that, although EGFR mutations in NSCLC patients may predict responses to EGFR inhibitors, other molecular characteristics of EGFR or the tumor may predict response in other tumors.
Efforts to improve surgical, radiotherapy, and chemotherapy approaches to glioma treatment have not substantially increased long-term survival ( 13 ) . Although standard antineoplastic therapies have produced little clinical progress, genetic analyses of gliomas have improved our understanding of the molecular pathogenesis of these tumors ( 14 ) . EGFR is frequently overexpressed in NSCLCs and other solid tumors, but EGFR gene amplification does not frequently underlie increased protein expression ( 5 ) . EGFR is also overexpressed in 40%–90% of glioblastoma multiforme tumors (the highest-grade, highly malignant glioma that is almost uniformly fatal), and the EGFR gene is amplified in nearly half of these tumors, so that it is the primary mechanism leading to EGFR overexpression in such tumors ( 15 ) . In addition, frequent overexpression of the ligand-independent EGFRvIII deletion mutant in glioblastoma multiforme tumors ( 16 ) suggests that EGFR is a key factor in glioblastoma multiforme pathogenesis and provides a compelling rationale for the use of EGFR inhibitors in patients with this form of glioma.
Erlotinib is a small-molecule inhibitor of EGFR that has produced clinically significant response rates in patients with malignant glioma ( 17 ) . The University of California, San Francisco, conducted a phase I trial in which erlotinib alone or combined with temozolomide, a chemotherapeutic alkylating agent, was given to glioma patients. We used tissue specimens from patients in this trial to determine whether the status of EGFR and downstream signaling components in gliomas was associated with response to the EGFR inhibitor erlotinib. This article focuses on associations between molecular markers of individual tumors and responses to erlotinib, rather than on details of erlotinib toxic effects and pharmacokinetics.
P ATIENTS AND M ETHODS
Phase I Study
Patients with stable or progressive malignant gliomas were treated with erlotinib at doses that started at 100 mg/day. This phase I study included adult patients with histologically proven supratentorial malignant glioma and Karnofsky performance status scores of 60 or more but with no mandate for determination of EGFR status. Patients were stratified according to the use of enzyme-inducing antiepileptic drugs. In addition to erlotinib, patients could receive temozolomide at a daily dose of 150–200 mg/m 2 of body surface area for 5 days every 28 days, if they had not previously received or progressed on this alkylating agent. The trial thus consisted of four treatment groups: patients who were not on enzyme-inducing antiepileptic drugs and received either erlotinib alone or the combination of erlotinib and temozolomide and patients who were on enzyme-inducing antiepileptic drugs and received either erlotinib alone or the combination of erlotinib and temozolomide. Within each treatment group, the erlotinib dose was increased in increments of 50 mg/day until dose-limiting toxicity occurred. For patients receiving combination therapy with temozolomide, erlotinib began 7 days before temozolomide therapy and continued until dose-limiting toxicity occurred. Dose escalations for individual patients were allowed. Sixty-six patients enrolled in this trial; 14 patients were treated with stable disease, and 52 patients were treated at relapse and were, therefore, evaluable for response with sequential magnetic resonance imaging every 2 months. Response was defined as a 50% decrease in tumor area, reflected by cross-sectional diameters, in the setting of stable clinical findings and no increase in steroid doses.
We acquired tissue from 41 of the 52 patients who were evaluable for response. Of these 41 patients, 29 had glioblastoma multiforme, nine had grade 3 gliomas, and three had grade 2 gliomas. Tissue was acquired from the original diagnostic surgery in 29 patients of the 41 patients and from resection for recurrent disease in 12 of the 41 patients. All but one specimen had been obtained before the patient enrolled in the phase I study and initiated therapy with erlotinib. A single specimen that expressed phosphorylated PKB/Akt and diffuse positive staining for EGFR was obtained from tissue resected 68 days after the initiation of erlotinib treatment, after the patient was off study and no longer treated with erlotinib. There was not sufficient tissue to complete all analyses on all patients, and the order of priority for analyses was EGFR immunohistochemistry, PKB/Akt phosphorylation, and EGFR fluorescence in situ hybridization. Therefore, EGFR immunohistochemistry was assessed in 41 patients, phosphorylation of PKB/Akt was assessed in 40 patients, and EGFR fluorescence in situ hybridization was assessed in 39 patients.
The cohort studied herein is a subset of a larger phase I study that will be described in detail elsewhere (M.D.P., K.R.L., Susan Chang, Eric Burton, Nicholas Butowski, M.M., A.K., Jane Rabbitt, Margaretta Page, Ann Fedoroff, Dong Xie, Sean K. Kelley, unpublished results). Patients were enrolled on this study between December 2001 and May 2003. All patients signed an informed consent form. The protocol was approved by the institutional review board at the University of California, San Francisco, and conducted in accordance with institutional and federal guidelines for human investigation.
Immunohistochemical Analysis
Formalin-fixed, paraffin-embedded sections were immunostained for total EGFR (monoclonal antibody, clone111.6; Lab Vision Corporation, Fremont, CA), EGFRvIII (monoclonal antibody, clone G100; Zymed Laboratories, Inc., South San Francisco, CA), and phosphorylated PKB/Akt (polyclonal antibody Ser473; Cell Signaling Technology, Inc., Beverly, MA). For EGFR staining, tissue was digested with protease XXV (Lab Vision) at 37 °C for 10 minutes, peroxidase activity was quenched with 3% hydrogen peroxide in phosphate-buffered saline, and sections were incubated with primary antibody (1:500 dilution) for 60 minutes. For EGFRvIII and phosphorylated PKB/Akt staining, antigen retrieval was performed in 10 m M sodium citrate (pH 6.0) for 30 minutes in boiling water, sections were cooled to room temperature, and peroxidase activity was quenched with 3% hydrogen peroxide in phosphate-buffered saline. Sections were then sequentially incubated with avidin and biotin blocking reagents (DakoCytomation California, Inc., Carpinteria, CA), primary antibody (1 : 50 dilution) at 4 °C overnight, biotinylated horse anti–mouse secondary antibody for EGFR and EGFRvIII (1 : 200 dilution, Vector Labs, product BA-2000, Burlingame, CA), and biotinylated goat anti–rabbit secondary antibody for phospho-PKB/Akt (1 : 200 dilution, Vector Labs, product BA-1000, Burlingame, CA) for 30 minutes, and finally with avidin–biotin complex (1 : 100 dilution, Vector Labs, product PK6100 Vectastain ABC Kit) for 30 minutes. Staining was visualized with 3,3′-diaminobenzidine tetrahydrochloride at 500 mg/mL in phosphate-buffered saline for 5 minutes at room temperature, and slides were counterstained with hematoxylin. Healthy brain sections from surgical specimens were used as control tissues. In addition, tumors with defined alterations in EGFR or EGFRvIII amplification were used as positive controls. For phosphorylated PKB/Akt studies, slides from a paraffin-embedded human breast carcinoma were used as positive controls, as suggested by the manufacturer (Cell Signaling). For negative controls, tumor sections were processed as above with the exception of incubation with the primary antibody. Dilutions and incubation periods were optimized for each antibody by use of the positive and negative controls. EGFR positivity, visualized by chromogenic staining, was localized to the cell membranes and cytoplasm, similar to the results reported previously ( 18 ) . Before assessing staining for EGFR, three categories were defined: tumors with no positive cells were defined as “negative,” tumors with a limited number of positive cells were defined as “focally positive,” and tumors in which virtually all cells were positive were defined as “diffusely positive.” All scoring was done in a blinded fashion with no knowledge of patient outcome.
Fluorescence In Situ Hybridization
Fluorescence in situ hybridization was performed on paraffin-embedded sections as previously described ( 19 ) . In brief, after deparaffinization, sections were pretreated with 1 M sodium thiocyanate at 80 °C for 3 minutes and then digested in a pepsin solution (1.5 mg/mL dissolved in 0.2 N HCl, pH <2.0) at 37 °C for 4 minutes. Denaturation was carried out for 6 minutes at 73 °C in a solution of 70% formamide and 2× standard saline citrate (SSC; 1× SSC = NaCl at 0.15 mol/L and sodium citrate at 0.015 mol/L at pH 7.0). Hybridization was then performed with a chromosome 7 pericentromeric probe ( 20 ) labeled by random priming (Invitrogen kit 18094-011) with Alexa 488-dUTP (Molecular Probes product C11397) and a 38-kilobase genomic probe specific for the EGFR gene ( 20 ) labeled by nick translation (Invitrogen kit 18247–015) with CY3-dUTP (Amersham Life Sciences product PA53022), where Alexa 488 and CY3 are fluorophores.
A Zeiss Axioplan fluorescence microscope equipped with double-band-pass filters (Chroma Technology, Brattleboro, VT) and a ×100, numerical aperture 1.3, oil-immersion objective was used for simultaneous visualization of Alexa 488 and CY3. Slides were scored by counting the absolute numbers of EGFR and centromere 7 signals in 25–50 cells, as previously described ( 20 ) . The EGFR copy number and centromere 7 copy number were calculated for each cell in every specimen. The EGFR gene in a single cell was classified as amplified when the EGFR signal was at least twice as high as the centromere 7 signal. A tumor was classified as amplified if at least 10% of tumor cells displayed amplification ( 20 ) .
PTEN and EGFR Mutation Analysis
Tumor tissue was isolated by dissection of tumor-rich areas or by laser-capture microdissection of tumor cells (PixCell II, Arcturus, Mountain View, CA) from 10-μm-thick, formalin-fixed, paraffin-embedded tissue sections. After deparaffinization and rehydration, genomic DNA was extracted by proteinase K digestion according to the manufacturers' instructions (Promega kit A1120; and PicoPure, Arcturus).
For PTEN sequencing, extracted DNA was resuspended in 20 μL of a solution of 10 m M Tris–HCl and 1 m M EDTA (pH 7.5), and 2 μL of this mixture was subjected to PCR amplification. An initial incubation at 94 °C for 2 minutes was followed by 40 cycles of 94 °C for 30 seconds, 57 °C for 30 seconds, and 68 °C for 1 minute, followed by a final extension at 68 °C for 10 minutes. Primers were designed by use of the algorithm Primer3 ( http://frodo.wi.mit.edu/cgi-bin/primer3/primer3_www.cgi ). The PCR products were then sequenced on both strands with the same primers used for the PCR amplification on an ABI3700 sequencer.
For EGFR sequencing, a nested PCR amplification was performed. One microliter of digested DNA was added to 50 μL of reaction buffer containing 0.5 μ M of each primer, all four deoxynucleoside triphosphates (each at 0.2 μ M ), 1.5 m M MgCl 2 , and 1.5 U of a taq/pwo blend (Expand High-Fidelity PCR system; Roche Molecular Biochemicals, Indianapolis, IN). Polymerase chain reactions (PCRs) were run in a PT200 MJ Thermocycler (MJ Research, Inc., Waltham, MA) with the following cycling conditions: an initial incubation at 94 °C for 3 minutes, 35 cycles of 94 °C for 30 seconds, 58 °C for 30 seconds, and 72 °C for 1 minute, followed by a final extension at 72 °C for 8 minutes. Second-step reactions with nested primers were cycled 30 times; other conditions were as in the first step. PCR products were sequenced with M13 sequencing primers and resolved with an ABI3700 instrument (Applied Biosystems, Foster City, CA). The sequences of the oligonucleotide primers used for PCR and sequencing are presented as Supplementary Material (Available at: http://jncicancerspectrum.oupjournals.org/jnci/content/vol97/issue12 ).
Statistical Methods
All analyses were done with the SAS package of programs, version 9.1. Variations of the Cochran–Mantel–Haenzel test were used to assess the association of marker status with response and the association of EGFR amplification with EGFR immunohistochemistry. For markers with more than two levels, rank scores were used. For the purpose of these analyses, EGFR immunohistochemistry result labeled “diffusely positive” (score of 3) was considered to be a higher score than that labeled “focally positive” (score of 2). The log-rank test was used to assess the association of EGFR and phosphorylated PKB/Akt status with time to progression. The Cox proportional hazards model was used to assess immunohistochemistry results for EGFR, with scores of 1, 2, and 3 for “none,” “focally positive,” and “diffusely positive,” respectively, to allow for ordering. The proportional hazards assumption was evaluated by graphical displays and determined to be adequate for the purpose of this assessment. Because a possibility exists that glioblastoma multiforme may inherently respond differently to erlotinib than lower-grade gliomas, the analyses were repeated including only those tumors that were initially diagnosed as glioblastoma multiforme. In most instances, the results remained qualitatively the same. However, in two instances analyses of glioblastoma multiforme resulted in statistically significant P values that were not seen for the full group analysis; in these cases, results of both analyses are presented. All P values were from two-sided tests. P values less than .05 were considered statistically significant.
R ESULTS
We acquired tissue from 41 patients with progressive gliomas enrolled in a phase I trial of erlotinib administered either alone or with the alkylating chemotherapeutic agent temozolomide. Eight patients responded to erlotinib. Tissue was available from all eight responders. Patient characteristics are shown in Table 1 .
Patient characteristics and treatment details
| Variable | Total |
|---|---|
| No. of patients | 41 |
| Median age (range), y | 53 (19–74) |
| Median Karnofsky performance score (range) | 80 (60–100) |
| Female/male ratio | 20 : 21 |
| No. of prior therapies, No. of patients | |
| One | 14 |
| Two | 16 |
| Three | 10 |
| Four | 1 |
| Type of prior therapy, No. of patients | |
| Radiation alone | 2 |
| Radiation + nitrosourea chemotherapy | 10 |
| Radiation + non-nitrosourea chemotherapy only | 29 |
| Initial histology, No. of patients | |
| Glioblastoma multiforme (grade 4) | 29 |
| Anaplastic astrocytoma (grade 3) | 7 |
| Gemistocytic astrocytoma (grade 3) | 1 |
| Anaplastic oligodendroglioma (grade 3) | 1 |
| Low-grade astrocytoma (grade 2) | 1 |
| Oligodendroglioma (grade 2) | 2 |
Before proceeding with the primary analyses, we confirmed that treatment group (erlotinib ± temozolomide ± enzyme-inducing antiepileptic drugs) and/or erlotinib blood levels were not statistically significant predictors of tumor response. Responses among the four treatment groups were compared by use of the Cochran–Mantel–Haenzel test for general association and found to be not statistically significantly different among them ( P = .73). These results were confirmed by use of logistic regression analysis with temozolomide and enzyme-inducing antiepileptic drugs as the two factors in the model, and responses were found to occur at even the lower erlotinib dose levels. Six of the eight responders were treated with erlotinib alone and two were treated with erlotinib plus temozolomide. To evaluate the association of erlotinib blood levels with response, we considered the area under the erlotinib curve for the 8-day period after the initial treatment. When a patient was treated at multiple dose levels, the information from the highest dose level available was used. Pharmacokinetic studies were available for 37 of the 41 patients, including all of the responders. The median areas under the curve for the non-responders was 15.3 hours × μg/mL (range = 4.3–44.3 hours × μg/mL) and that of the responders was 14.6 hours × μg/mL (range = 8.2–28 hours × μg/mL).
The areas under the curve from responders were compared with those of nonresponders by use of a Cochran–Mantel–Haenzel test with rank scores. We found no indication that response was related to the area under the curve ( P = .85). Because neither dose group nor area under the curve appeared to be strongly associated with response, the subsequent analyses of tumor markers were completed without regard to dose group. It is possible that dose group and drug availability have some association with response rate that could not be detected with this limited sample size. However, because assignment of patients to a particular dose group was not dependent on knowledge of marker status, any dose–response relationship could only reduce our power to detect a marker effect and would not introduce any bias into the analysis.
We investigated the relationship between EGFR gene amplification and the overexpression of EGFR protein in glioma tissue sections. EGFR gene amplification was assessed by fluorescence in situ hybridization, and the EGFR signal was normalized to that of a centromere 7 probe ( Fig. 1, A ). The ratio of EGFR signal to centromere 7 signal ranged from 4 to 15 in tumors with EGFR amplification, with a median of 9. We also assessed EGFR protein expression by immunohistochemistry ( Fig. 1, B ). None of the 14 EGFR protein–negative tumors had amplified EGFR genes. One of the 15 tumors that expressed EGFR protein in a focally positive manner had amplified EGFR genes. Nine of the 10 tumors that expressed EGFR protein in a diffusely positive manner had amplified EGFR genes. Thus, EGFR overexpression was associated with EGFR gene amplification ( P <.001), suggesting that amplification is the mechanism used by gliomas to overexpress EGFR protein.
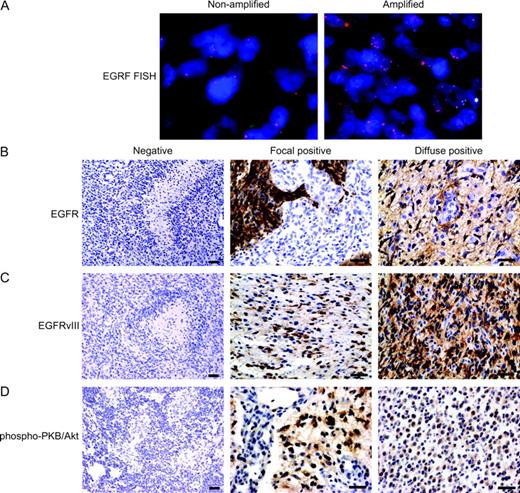
Status of epithelial growth factor receptor (EGFR) and phosphorylated protein kinase B (PKB)/Akt in gliomas. ( A ) Fluorescence in situ hybridization analyses of EGFR-nonamplified tumor and EGFR-amplified tumor. Representative sections of both types of tumors are shown. ( B–D ) Immunohistochemical analyses of EGFR, EGFRvIII, and phosphorylated PKB/Akt. The composite panel shows negative, focal positive, and diffuse positive staining for the three antibodies, as indicated. The negative staining images are presented at ×100 original magnification to demonstrate absent staining in tumor cells. Focal and diffuse staining images are presented at ×400 original magnification to demonstrate the staining detail in tumor cells. Antibodies for EGFR and EGFRvIII exhibit membranous and cytoplasmic staining, as previously reported ( 18 ) . Representative sections of a negative, a focally positive, and a diffusely positive tumor, respectively, are shown. In panels A–D, scale bars = 20 μm.
We next investigated the relation between EGFR gene amplification and response to erlotinib. We assessed EGFR gene amplification in the tumors of 39 patients. Among the 10 patients with tumors with EGFR gene amplification, four (40%) responded to erlotinib; among the 29 patients with tumors without EGFR gene amplification, four (14%) responded to erlotinib ( P = .08) ( Table 2 ). We then analyzed the 29 patients with glioblastoma multiforme patients separately, including the five who responded to erlotinib treatment. Tumors from only 28 patients were available for fluorescence in situ hybridization analysis. Among six tumors with EGFR amplification, three (50%) responded to treatment; among the 22 tumors without amplification, two (9%) responded ( P = .02) ( Table 2 ). Thus, EGFR gene amplification was associated with response to erlotinib treatment, and the association was stronger and statistically significant among patients initially diagnosed with glioblastoma multiforme.
Epidermal growth factor receptor (EGFR) status and phosphorylated protein kinase B/Akt (phospho-PKB/Akt) status and radiographic response to erlotinib *
| All tumors | Glioblastoma multiforme tumors | |||||
|---|---|---|---|---|---|---|
| Variable/test | Erlotinib responders No. (%) | Erlotinib nonresponders No. (%) | Erlotinib responders No. (%) | Erlotinib nonresponders No. (%) | ||
| EGFR status/FISH | ||||||
| Nonamplified | 4 (14) | 25 (86) | 2 (9) | 20 (91) | ||
| Amplified | 4 (40) | 6 (60) | 3 (50) | 3 (50) | ||
| Total | 8 | 31 | 5 | 23 | ||
| EGFR status/IHC | ||||||
| Negative | 1 (7) | 13 (93) | 0 (0) | 10 (100) | ||
| Focally positive | 3 (19) | 13 (81) | 2 (17) | 10 (83) | ||
| Diffusely positive | 4 (36) | 7 (64) | 3 (43) | 4 (57) | ||
| Total [GW1] | 8 | 33 | 5 | 24 | ||
| Phospho-PKB/Akt status/IHC | ||||||
| Negative | 8 (44) | 10 (56) | 5 (45) | 6 (55) | ||
| Positive | 0 (0) | 22 (100) | 0 (0) | 18 (100) | ||
| Total | 8 | 32 | 5 | 24 | ||
Response was as defined by a 50% decrease in tumor area, reflected by cross-sectional diameters, in the setting of stable clinical findings and no increase in steroid doses. FISH = fluorescence in situ hybridization; IHC = immunohistochemistry.
We also investigated the relation between EGFR protein overexpression and response to erlotinib. We assessed EGFR overexpression in tumors of all 41 patients. Among the 11 patients whose tumors had diffuse positive EGFR staining, four (36%) responded to erlotinib. Among the 14 patients whose tumors were negative for EGFR staining, one (7%) responded to erlotinib. Among the 16 patients whose tumors had focally positive staining for EGFR, three (19%) responded to erlotinib ( Table 2 , P = .07). Among the 29 patients with glioblastoma multiforme, three of the seven patients with diffuse positive EGFR staining responded to treatment (43%), none of the 10 patients with negative staining responded (0%), and two of the 12 patients with focally positive staining responded (17%) ( P = .03). Thus, EGFR protein overexpression as measured by immunohistochemistry was associated with response to erlotinib treatment, and the association was stronger and statistically significant among patients with glioblastoma multiforme.
Mutations within the tyrosine kinase domain of EGFR appear to be associated with response to the EGFR inhibitor gefitinib in NSCLC ( 11 , 12 ) . Consequently, we sequenced exons 18, 19, 20, 21, and 23 of the EGFR gene from tumor tissue of six responders for whom sufficient tissue was available for this analysis. None of these patients had mutations in the exons examined.
Although we found that EGFR overexpression and gene amplification were associated with response to erlotinib, the finding that six patients with EGFR amplification were nonresponders suggests that EGFR amplification is not sufficient for response to erlotinib and suggests that another mechanism is also involved. We explored two potential mechanisms of erlotinib resistance in EGFR-amplified tumors. First, we investigated whether erlotinib resistance in tumors with EGFR amplification is associated with the overexpression of the ligand-independent EGFRvIII mutant, because in vitro studies have demonstrated particular resistance of this EGFR mutant to the EGFR inhibitor gefitinib ( 21 ) , although preliminary reports have not indicated similar resistance to erlotinib ( 22 ) . We found that two of the six nonresponding patients whose tumors had EGFR gene amplification expressed the EGFRvIII mutant ( Fig. 1, C ). We extended our analyses of EGFRvIII to the entire cohort and found no additional EGFRvIII positive patients, for totals of 39 EGFRvIII negative tumors and two EGFRvIII positive tumors. Thus, there was no association between EGFRvIII expression and response to erlotinib, although the statistical analysis was clearly limited by the few patients with EGFRvIII expression.
We also investigated whether erlotinib resistance in EGFR-amplified tumors might be related to the constitutive PKB/Akt activation as a result of PTEN mutations or alternative mechanisms. We used phosphorylation of Ser-473 in tumor PKB/Akt, determined by immunohistochemistry, as a surrogate for PKB/Akt activation ( Fig. 1, D ). To compare PKB/Akt phosphorylation status with other parameters, we combined tumors with focally positive and diffusely positive phosphorylated PKB/Akt staining into one positive group. Phosphorylated PKB/Akt was detected in four of the six nonresponders with EGFR amplification, but in none of the four responders with EGFR amplification (data not shown). Of note, both tumors expressing the EGFRvIII variant also displayed PKB/Akt phosphorylation, as expected from a previous study ( 23 ) that demonstrated selective phosphatidylinositol 3-kinase and PKB/Akt activation by EGFRvIII. Finally, two of the six nonresponders with EGFR amplification expressed neither phosphorylated PKB/Akt nor EGFRvIII, indicating additional, as yet elusive, mechanisms for erlotinib resistance.
To extend our analyses of erlotinib-resistant tumors with EGFR amplification, we analyzed these six nonresponding tumors for PTEN mutations. Two of the six erlotinib-resistant tumors with amplified EGFR harbored PTEN mutations, although only one of these tumors expressed phosphorylated PKB/Akt. One PTEN mutation resulted in deletion of the entire exon 3 coding sequence and is likely to result in an inactive form of PTEN. The second mutation consisted of a thymine-to-cytosine T170→C point mutation at position 170, resulting in the change of amino acid residue 56 from leucine to serine; it is unknown whether the L56S mutation inactivates PTEN, because this mutation has not been reported previously, to our knowledge. Therefore, PTEN mutations could not account for all EGFR-amplified erlotinib-resistant tumors expressing phosphorylated PKB/Akt.
Activation of the phosphatidylinositol 3-kinase/PKB/Akt pathway, a key effector of EGFR signaling, impedes tumor response to EGFR inhibitors ( 24 ) . We therefore tested the hypothesis that expression of activated, phosphorylated PKB/Akt is inversely associated with responses to erlotinib. We could assess the status of PKB/Akt and response to erlotinib in 40 tumors. Eighteen tumors of the 40 tumors lacked phosphorylated PKB/Akt; eight (44%) of these 18 tumors responded to erlotinib, and 10 (56%) did not respond to it. The other 22 tumors had phosphorylated PKB/Akt; none of these 22 tumors responded to erlotinib ( P <.001) ( Table 2 ). Within the subset of 29 patients with glioblastoma multiforme, 18 had phosphorylated-PKB/Akt-positive tumors, and none of then responded to erlotinib (0%). Of the 11 patients with phosphorylated-PKB/Akt-negative tumors, five responded to erlotinib (45%, P = .02). Therefore, there is a statistically significant inverse association between PKB/Akt phosphorylation and response to erlotinib for both the entire patient cohort and for the subset of glioblastoma multiforme patients. Overall, regardless of EGFR status, none of the 22 tumors expressing phosphorylated PKB/Akt responded to erlotinib. However, among the 18 tumors that lacked phosphorylated-PKB/Akt, one of the five EGFR-amplification-negative tumors responded to erlotinib treatment, and seven of the 13 EGFR-amplification-positive tumors responded to erlotinib treatment ( Table 3 ).
Radiographic response to erlotinib according to epidermal growth factor receptor (EGFR) and phosphorylated protein kinase B (PKB)/Akt status determined by immunohistochemistry *
| Phosphorylated PKB/Akt-positive and EGFR positive or negative, No. of patients (%) | Phosphorylated PKB/Akt-negative, No. of patients (%) | |||
|---|---|---|---|---|
| Response to erlotinib | EGFR negative | EGFR positive | ||
| Responders | 0 (0) | 1 (20) | 7 (54) | |
| Nonresponders | 22 (100) | 4 (80) | 6 (46) | |
Focal and diffuse positive staining for phosphorylated PKB/Akt and EGFR are grouped together as positive for this analysis.
In addition to measuring outcome by response, we also considered time to progression. In contrast to tumor responses, the outcome of time to progression was not associated with EGFR protein expression or with EGFR gene amplification but was statistically significantly associated with phosphorylated PKB/Akt ( P <.001). Median time to progression was 7.6 weeks (95% confidence interval [CI] = 4.7 to 8.0 weeks) for patients whose tumors displayed high levels of phosphorylated PKB/Akt and 20 weeks (95% CI = 8.7 to 23 weeks) for patients whose tumors displayed low levels of phosphorylated PKB/Akt. Thus, PKB/Akt activity was more strongly associated with radiographic response to erlotinib and time to progression than EGFR status.
D ISCUSSION
In this study we examined the relationship between molecular markers of gliomas and their response to the EGFR inhibitor erlotinib. We found that phosphorylation of PKB/Akt was the strongest predictor of lack of response to erlotinib. Of 22 patients whose tumors expressed phosphorylated PKB/Akt, none responded to erlotinib, whereas, of 18 patients whose tumors lacked phosphorylated PKB/Akt, eight responded to erlotinib. Response was also associated with EGFR gene amplification and EGFR protein overexpression, being stronger and statistically significant for glioblastoma multiforme tumors. These results emerged from analysis of a subset of a larger phase I study, acknowledging the limitation of various erlotinib dose levels inherent in a phase I study delineated below. Patients in this study could receive temozolomide in addition to erlotinib if they had not previously received or progressed on this alkylating agent, introducing further variability into the analysis. The small number of tumors expressing EGFRvIII mutant proteins limits analyses of the relationship between response to erlotinib and overexpression of EGFRvIII. Nevertheless, important associations between response to erlotinib and molecular markers emerged from this study.
Previous trials involving NSCLCs and colorectal and head-and-neck malignancies have not found associations between expression levels of EGFR and clinical responses ( 9 , 10 , 25 , 26 ) . In contrast, we detected an association between response to erlotinib and expression of both EGFR and phosphorylated PKB/Akt. The difference between this study and previous reports likely stems from the unique role of EGFR in glioma pathogenesis. EGFR is overexpressed in 40%–90% of glioblastoma multiforme tumors, driven by amplification in approximately 40% of overexpressing tumors ( 15 ) . Indeed, in this study, 25 (62.5%) of the 40 tumors examined displayed EGFR overexpression, and 10 (40%) of the 25 tumors with EGFR overexpression showed EFGR gene amplification. In contrast, EGFR is amplified in only 5%–13% of NSCLCs ( 27 , 28 ) . Consistent with this hypothesis, a recent study ( 28 ) of NSCLC that specifically examined EGFR gene amplification found an association between EGFR gene amplification and response to the EGFR inhibitor gefitinib.
It is therefore likely that associations between EGFR expression and response to EGFR inhibition are most apparent in tumor types such as gliomas, in which EGFR amplification is frequent. If so, it is possible that there is selection for this genetic aberration in gliomas. In contrast, EGFR overexpression in the absence of gene amplification may represent secondary noncritical consequences of tumor progression, whose sustained activity is not vital to tumor maintenance. This hypothesis is supported by recent results ( 11 , 12 ) that somatic EGFR mutations in NSCLC tumors confer sensitivity to gefitinib. These EGFR mutations may enhance tumor response to ligand stimulation and, therefore, may provide a selective advantage in tumor progression. However, our study clearly indicates that mutations in the EGFR gene are not the only marker associated with response to EGFR inhibitors.
In this study, phosphorylation of PKB/Akt was also strongly and statistically significantly associated with poor response to erlotinib and a short time to progression. This finding is especially notable in light of the histologic and treatment variability among patients in this study. This predictive capacity may be partially due to an association between PKB/Akt activation and poor clinical outcome more generally, as has been reported for prostate cancer and leukemia ( 29 , 30 ) . However, in our previous analyses of the phosphatidylinositol 3-kinase pathway in glioblastoma multiforme tumors, PKB/Akt phosphorylation was not an independent prognostic factor for survival ( 31 ) . Thus, the strong association between PKB/Akt phosphorylation and erlotinib response likely contributes to the association between PKB/Akt phosphorylation and time to progression.
Of 22 patients whose tumors displayed PKB/Akt phosphorylation, none responded to erlotinib. This finding contrasts with a recent report of NSCLC tumors, in which positive phosphorylated PKB/Akt staining was associated with improved response rates to gefitinib, a different EGFR inhibitor, and longer time to progression ( 32 ) but is consistent with other preclinical and clinical studies indicating that increased PKB/Akt activity is associated with decreased response to gefitinib ( 33 – 36 ) . It is not clear from our analysis what underlies the phosphorylation/activation of PKB/Akt. However, previous reports have shown that activation of phosphatidylinositol 3-kinase in response to EGF occurs through heterodimerization with erb-B3 ( 37 ) . Therefore, for future mechanistic and predictive studies of patients treated with EGFR inhibitors, it would be informative to assess the levels of erb-B3.
Our preliminary results support initiation of a clinical trial, planned as a phase II trial of 40 patients, who will be stratified according to molecular features of their gliomas determined after surgery but before initiation of therapy. All tumors will be characterized for the expression of phosphorylated PKB/Akt, which was the strongest predictor of response to erlotinib ( P <.001). Among phosphorylated PKB/Akt-negative tumors, those overexpressing EGFR had a 54% response rate and should be treated with erlotinib alone. The small number of phosphorylated PKB/Akt and EGFR-negative tumors, among them a single responder to erlotinib, precludes conclusions regarding the ultimate response rate expected for patients with such a molecular profile. Tumors with high levels of phosphorylated PKB/Akt are less likely to respond to erlotinib ( Table 2 ), and we propose treating them with rapamycin or one of its ester derivatives (i.e., CCI-779 or RAD001), perhaps in combination with erlotinib, if future preclinical and clinical trials support this combinatorial approach. This scheme is supported by preclinical results indicating that patients whose tumors express activated PKB/Akt will likely display particular sensitivity to mammalian target of rapamycin (mTOR) inhibitors ( 38 , 39 ) . Future trials of EGFR inhibitors should build on our current findings and with prospective molecular profiling should establish the most appropriate agent(s) for each individual patient. Clearly, in clinical trials testing signaling inhibitors, selection of patients with appropriate molecular characteristics will not only help to assess the true efficacy of specific novel agents but will also maximize benefits to individual patients.
Supported by NIH Brain Tumor SPORE grant (P50 CA097257) and GCRC grant M01-RR00079; clinical trial supported by Genentech, Inc., and NINDS P01 NS42927.
We thank Thinh Q. Pham, Jeremy Stinson, Somasekar Seshagiri, and Kanan Pujara for technical assistance with EGFR sequencing. We also thank the UCSF Comprehensive Cancer Center Genome Analysis core and the Immunohistochemistry and Molecular Pathology core, especially Loretta Chan, Karen Chew and Gregg Magrane.
References
Druker BJ, Talpaz M, Resta DJ, Peng B, Buchdunger E, Ford JM, et al. Efficacy and safety of a specific inhibitor of the BCR-ABL tyrosine kinase in chronic myeloid leukemia.
Slamon DJ, Leyland-Jones B, Shak S, Fuchs H, Paton V, Bajamonde A, et al. Use of chemotherapy plus a monoclonal antibody against HER2 for metastatic breast cancer that overexpresses HER2.
Sawyers CL. Opportunities and challenges in the development of kinase inhibitor therapy for cancer.
Glover KY, Perez-Soler R, Papadimitradopoulou VA. A review of small-molecule epidermal growth factor receptor-specific tyrosine kinase inhibitors in development for non-small cell lung cancer.
Salomon DS, Brandt R, Ciardiello F, Normanno N. Epidermal growth factor-related peptides and their receptors in human malignancies.
Nicholson RI, Gee JM, Harper ME. EGFR and cancer prognosis.
Moasser MM, Basso A, Averbuch SD, Rosen N. The tyrosine kinase inhibitor ZD1839 (“Iressa”) inhibits HER2-driven signaling and suppresses the growth of HER2-overexpressing tumor cells.
Moulder SL, Yakes FM, Muthuswamy SK, Bianco R, Simpson JF, Arteaga CL. Epidermal growth factor receptor (HER1) tyrosine kinase inhibitor ZD1839 (Iressa) inhibits HER2/neu (erbB2)-overexpressing breast cancer cells in vitro and in vivo.
Cappuzzo F, Gregorc V, Rossi E, Cancellieri A, Magrini E, Paties CT, et al. Gefitinib in pretreated non-small-cell lung cancer (NSCLC): analysis of efficacy and correlation with HER2 and epidermal growth factor receptor expression in locally advanced or metastatic NSCLC.
Bailey R, Kriss M, Wolf M, Kay A, Averbuch S, Askaa J, et al. Gefitinib (‘lressa’, ZD 1839) monotherapy for pretreated advanced non-small-cell lung cancer in IDEAL 1 and 2: tumor response is not clinically relevantly predictable from tumor EGFR membrane staining alone.
Paez JG, Janne PA, Lee JC, Tracy S, Greulich H, Gabriel S, et al. EGFR mutations in lung cancer: correlation with clinical response to gefitinib therapy.
Lynch TJ, Bell DW, Sordella R, Gurubhagavatula S, Okimoto RA, Brannigan BW, et al. Activating mutations in the epidermal growth factor receptor underlying responsiveness of non-small-cell lung cancer to gefitinib.
Davis FG, Freels S, Grutsch J, Barlas S, Brem S. Survival rates in patients with primary malignant brain tumors stratified by patient age and tumor histological type: an analysis based on Surveillance, Epidemiology, and End Results (SEER) data, 1973–1991.
Smith JS, Jenkins RB. Genetic alterations in adult diffuse glioma: occurrence, significance, and prognostic implications.
Chaffanet M, Chauvin C, Laine M, Berger F, Chedin M, Rost N, et al. EGF receptor amplification and expression in human brain tumours.
Kuan CT, Wikstrand CJ, Bigner DD. EGF mutant receptor vIII as a molecular target in cancer therapy.
Prados M, Chang S, Burton E, Kapadia A, Rabbitt J, Page M, et al. Phase I study of OSI-774 alone or with temozolomide in patients with malignant glioma.
Bredel M, Pollack IF, Hamilton RL, James CD. Epidermal growth factor receptor expression and gene amplification in high-grade non-brainstem gliomas of childhood.
Kallioniemi OP, Kallioniemi A, Kurisu W, Thor A, Chen LC, Smith HS, et al. ERBB2 amplification in breast cancer analyzed by fluorescence in situ hybridization.
Sauter G, Maeda T, Waldman FM, Davis RL, Feuerstein BG. Patterns of epidermal growth factor receptor amplification in malignant gliomas.
Learn CA, Hartzell TL, Wikstrand CJ, Archer GE, Rich JN, Friedman AH, et al. Resistance to tyrosine kinase inhibition by mutant epidermal growth factor receptor variant III contributes to the neoplastic phenotype of glioblastoma multiforme.
Iwata KK, Provoncha K, Gibson N. Inhibition of mutant EGFRvIII transformed cells by tyrosine kinase inhibitor OSI-774 (Tarceva).
Moscatello DK, Holgado-Madruga M, Emlet DR, Montgomery RB, Wong AJ. Constitutive activation of phosphatidylinositol 3-kinase by a naturally occurring mutant epidermal growth factor receptor.
Bianco R, Shin I, Ritter CA, Yakes FM, Basso A, Rosen N, et al. Loss of PTEN/MMAC1/TEP in EGF receptor-expressing tumor cells counteracts the antitumor action of EGFR tyrosine kinase inhibitors.
Salz L, Rubin M, Hochster H, Tchekmeydian NS, Waksal H, Needle M, et al. Cetuximab (IMC-C225) plus irinotecan (CPT-11) is active in CPT-11-refractory colorectal cancer (CRC) that expresses epidermal growth factor receptor (EGFR).
Baselga J, Trigo JM, Bourhis J, Tortochaux J, Cortes-Funes H, Hitt R, et al. Cetuximab (C225) plus cisplatin/carboplatin is active in patients (pts) with recurrent/metastatic squamous cell carcinoma of the head and neck (SCCHN) progressing on a same dose and schedule platinum-based regimen.
Reissmann PT, Koga H, Figlin RA, Holmes EC, Slamon DJ. Amplification and overexpression of the cyclin D1 and epidermal growth factor receptor genes in non-small-cell lung cancer. Lung Cancer Study Group.
Cappuzzo F, Hirsch FR, Rossi E, Bartolini S, Ceresoli GL, Bemis L, et al. Epidermal growth factor receptor gene and protein and gefitinib sensitivity in non–small-cell lung cancer.
Kreisberg JI, Malik SN, Prihoda TJ, Bedolla RG, Troyer DA, Kreisberg S, et al. Phosphorylation of Akt (Ser473) is an excellent predictor of poor clinical outcome in prostate cancer.
Min YH, Cheong JW, Kim JY, Eom JI, Lee ST, Hahn JS, et al. Cytoplasmic mislocalization of p27Kip1 protein is associated with constitutive phosphorylation of Akt or protein kinase B and poor prognosis in acute myelogenous leukemia.
Ermoian RP, Furniss CS, Lamborn KR, Basila D, Berger MS, Gottschalk AR, et al. Dysregulation of PTEN and protein kinase B is associated with glioma histology and patient survival.
Cappuzzo F, Magrini E, Ceresoli GL, Bartolini S, Rossi E, Ludovini V, et al. Akt phosphorylation and gefitinib efficacy in patients with advanced non-small-cell lung cancer.
Janmaat ML, Kruyt FA, Rodriguez JA, Giaccone G. Response to epidermal growth factor receptor inhibitors in non-small cell lung cancer cells: limited antiproliferative effects and absence of apoptosis associated with persistent activity of extracellular signal-regulated kinase or Akt kinase pathways.
Rojo F, Tabernero J, Van Cutsem E, Ohtsu A, Albanell J, Koizumi W, et al. Pharmacodynamic studies of tumor biopsy specimens from patients with advanced gastric carcinoma undergoing treatment with gefitinib (ZD 1839).
Mendelsohn J, Baselga J. Status of epidermal growth factor receptor antagonists in the biology and treatment of cancer.
Tabernero J, Rojo E, Jimenez E, Montaner I, Santom L, Guix M, et al. A phase I pharmacokinetic (PK) and serial tumor and skin pharmacodynamic (PD) study of weekly, every 2 weeks or every 3 weeks 1-hour (h) infusion EMD72000, an humanized monoclonal anti-epidermal growth factor receptor (EGFR) antibody, in patients (p) with advanced tumors known to overexpress the EGFR.
Kim HH, Sierke SL, Koland JG. Epidermal growth factor-dependent association of phosphatidylinositol 3-kinase with the erbB3 gene product.
Gera JF, Mellinghoff IK, Shi Y, Rettig MB, Tran C, Hsu JH, et al. AKT activity determines sensitivity to mammalian target of rapamycin (mTOR) inhibitors by regulating cyclin D1 and c-myc expression.

