


Abstract
A history of timber harvest in West Virginia has reduced red spruce (Picea rubens) forests to < 10% of their historic range and resulted in considerable habitat fragmentation for wildlife species associated with these forests. The Virginia northern flying squirrel (Glaucomys sabrinus fuscus) has been described as a red spruce obligate subspecies that must traverse this fragmented landscape to disperse among remnant red spruce patches. Food availability in the forest matrix surrounding red spruce may be a limiting factor to successful dispersal of G. s. fuscus. We examined the diet of flying squirrels using stable isotope analysis and used vegetation surveys to determine the availability of diet items in the habitats encountered by G. s. fuscus in the matrix surrounding red spruce fragments. Stable isotope analysis suggested hypogeous fungi, epigeous fungi, and invertebrates contributed the most to the diet of G. s. fuscus, followed by lichen. Tree buds contributed the least in spring, and beechnuts contributed the least in fall. The vegetation surveys revealed that no habitat type had a greater availability of the diet items that contributed most to the assimilated diet of G. s. fuscus, suggesting that stand age and structure may be more important for diet-item availability than habitat type.
In the central Appalachians in West Virginia, broad-scale disturbance and other anthropogenic factors reduced red spruce (Picea rubens) to < 10% of its historic range within the last century (Stephenson 1993). Further habitat degradation and heavy metal deposition have impeded regeneration of red spruce, transitioning forests from red spruce to young, regenerating oak (Quercus spp.), maple (Acer spp.), and American beech (Fagus grandifolia)-dominated hardwood forests, which have not yet reached the complex stage that is characteristic of old-growth forests (Schuler et al. 2002; USFWS 2013). The patchy distribution and potential ongoing decline of high-elevation red spruce forest may threaten the long-term viability of spruce-adapted species with limited dispersal capabilities, such as the Virginia northern flying squirrel (Glaucomys sabrinus fuscus). Recently removed from the endangered species list (USFWS 2013), G. s. fuscus is thought to be reliant upon this threatened forest type and must disperse through young, managed stands to maintain a viable population (Hanski 1991; Arbogast et al. 2005).
Evidence of reduced genetic variability suggests limited dispersal of G. s. fuscus among the remaining pockets of red spruce (Arbogast et al. 2005). Successful dispersal through fragmented habitats is one of the most important components of maintaining a functional metapopulation (Levins 1969; Johnson and Gaines 1990; Gilpin 1991; Hanski 1991; Venebal and Brown 1993; Clobert et al. 2012). Without dispersal, populations suffer from decreased genetic variability (Gilpin 1991) and higher extinction risks (Fahrig and Merriam 1994; Thomas 2000). Habitat fragmentation may limit dispersal of flying squirrels by increasing dispersal time (Smith et al. 2011), which may reduce fitness through increased risk to predation (Smith 2012) or through indirect effects (e.g., increased energy costs during dispersal—Flaherty et al. 2010a), that ultimately reduce fitness (Stamps et al. 2005; Bonte et al. 2012). Flying squirrels are capable of moving several km per night while searching for a suitable home range (Weigl 1974; Selonen and Hanski 2004; Hanski and Selonen 2009; Pyare et al. 2010). However, if the energetic cost of dispersal exceeds the energy stored by dispersing individuals, forage availability may limit flying squirrel movements (Flaherty et al. 2010a, 2010b; Bonte et al. 2012).
Availability of diet items for northern flying squirrels may be influenced by timber harvest and age of forest stands. Hypogeous and epigeous fungi, staples of flying squirrel diets in the Pacific Northwest (Maser et al. 1985; Pyare et al. 2002; Flaherty et al. 2010b), exhibited reduced availability in younger, managed stands (Amaranthus et al. 1994; Luoma et al. 2004; Flaherty et al. 2010b). Furthermore, lichen abundance in New England was strongly influenced by forest structure, with a higher diversity and availability in stands with increasing stand age and complexity (Selva 1994). Therefore, identification of diet items that are most important to G. s. fuscus and their availability in habitat that must be utilized for dispersal will improve our understanding of potential limits to dispersal in northern flying squirrels (Smith 2012).
We estimated the availability of diet items in managed forest types surrounding red spruce and used stable isotope analysis to characterize the diet of G. s. fuscus. We hypothesized that diet items that provided the highest percent contribution to the assimilated diet of G. s. fuscus would be less available in managed conifer, hardwood, and mixed conifer-hardwood habitat types compared to mature red spruce habitat in West Virginia (Loeb et al. 2000; Flaherty et al. 2010b). Specifically, our overall research objective was to examine whether food resources may be a limiting factor for dispersal of G. s. fuscus in fragmented landscapes. Understanding potential limits to dispersal and ways to increase dispersal success provides important information for conservation practitioners when considering how to best maintain a functional metapopulation of G. s. fuscus and ensure population viability.
Materials and Methods
Study area.
Our field site was in the northern half of the Monongahela National Forest (MNF) and Blackwater State Park located in the Allegheny Mountains of West Virginia, United States. Periods of extensive logging, fire, and development in the early 19th century removed most of the established, old-growth forest and disrupted the natural succession of the region, resulting in what is now a predominantly regenerating young-growth forest with an altered species composition (Pielke 1981; Schuler et al. 2002). Dominant canopy trees included silver maple (Acer saccharium), yellow birch (Betula alleghaniensis), American beech, red spruce, and eastern hemlock (Tsuga canadensis). Mid-story trees included young American beech and rhododendron (Rhododendron maximum), and dominant forest-floor species included ferns, blueberries (Vaccinum erythrocarpum), and blackberries (Rubus spp.). Precipitation ranges from 120 to 150 cm annually, most of which comes from snowfall (Stephenson 1993), and average temperatures range from 0°C to 21°C.
Food-item availability surveys.
We used vegetation, pitfall, and truffle surveys to evaluate the availability of diet items (Flaherty et al. 2010b) identified in > 20% of fecal samples in a previous study of G. s. fuscus diet by Mitchell (2001). To account for differences in diet-item availability within habitat types, we surveyed 4 previously delineated habitat types: red spruce, conifer, hardwood, and mixed conifer-hardwood. Red spruce forest was defined as having > 50% red spruce cover mixed with other conifer or hardwood species, whereas conifer forest had > 50% cover of various conifer species (e.g., pine, Pinus spp.) other than spruce. Mixed hardwood-conifer forest was defined as having an even mixture of conifer and hardwood species, whereas hardwood forest had < 10% conifer in the overstory. We surveyed a total of 60 stratified random plots, 15 in each of the 4 habitat types, and conducted the full suite of vegetation, pitfall trap, and truffle surveys (described below) at each site. We used preliminary data from the surveys completed during the 2014 field season to determine the total number of survey transects needed to detect differences in vegetation and food availability among the 4 habitat types with a statistical power of 0.80. Using G*Power software (Faul et al. 2007) and F-test fixed-effects analysis of variance (ANOVA) procedure, we determined that 15 survey sites in each habitat type would provide adequate power to evaluate differences among habitats. We restricted plots to < 350 m from the road for accessibility.
We used point-center quadrat plots with a diameter of 20 m. We placed 2 50-m field tapes (OTR50M; Keson, Aurora, Illinois) in the 4 cardinal directions (Flaherty et al. 2010b). To estimate availability of red spruce and American beech at each plot, we measured the distance to the nearest tree in each quadrat from the center of the plot, identified each tree to species, estimated height using a digital hypsometer (Nikon Forestry PRO Laser Rangefinder/Hypsometer; Nikon Vision Co., Ltd., Tokyo, Japan), and measured diameter at breast height (DBH) using a DBH tape (No. 59571; Forestry Suppliers). We calculated the importance value, the dominance of a tree species at a site (Cottam and Curtis 1956; Loeb et al. 2000; Schuler et al. 2002), for red spruce and American beech on each plot as:
This importance value for spruce has been used in other studies as a surrogate for availability of hypogeous fungi (Loeb et al. 2000).
At each of the 4 ends of the tape, we counted red spruce cones in a 1 × 1 m plot as an index of availability of conifer seeds, and then used a hand rake to search for truffles, the fruiting bodies of hypogeous fungi, in the organic soil layer, measuring fresh truffle biomass with a Pesola scale (10 g; Pesola AG, Schindellegi, Switzerland). We measured % cover along the 20-m tapes to estimate the availability of epigeous fungi and downed wood. To estimate invertebrate abundance, we buried 473-ml cups flush with the ground as pitfall traps. We placed 5 traps every 5 m along a randomly selected field tape and covered the cups with plastic plates to provide cover and protection from rain and with space between the ground and plate to allow invertebrates to walk underneath. Pitfall traps remained in the ground for 4 days and contents were then stored frozen to preserve the specimens for later identification. We identified invertebrates to class using Borror and White (1998).
For measurements of downed wood and invertebrates, we calculated the mean for each plot and used an ANOVA with a log transformation to adjust for non-normal data. For availability of epigeous fungi and red spruce and American beech importance values, we used a Kruskal–Wallis test to evaluate differences among habitat types (Zar 2010). To estimate the detection probability of invertebrates among habitat types, we used a proportion z-test (Zar 2010:549). We collected 10 independent samples for each diet item identified by Mitchell (2001) from red spruce habitats for stable isotope analysis.
For all statistical analyses performed during our study, we accepted a probability of α = 0.05 to indicate statistical significance.
Hair collection.
We deployed modified Tomahawk live traps (No. 201; Tomahawk Live Traps, Hazelhurst, Wisconsin—Trapp and Flaherty in press) that served as minimally invasive, single-capture hair snares in the MNF to collect hair from G. s. fuscus. We used plastic zip ties and wire to disable the locking mechanism that would normally have prevented captured individuals from escaping the trap. As the trapped individual pushed the door open to escape, they contacted 4 wire brushes (6.35 cm diameter; The Mill-Rose Company, Mentor, Ohio) attached to the perimeter of the door that snared hair samples upon contact. The trap door then closed behind the individual, thereby creating a single-capture system. In 2015, we suspended wooden dowel rods wrapped in double-sided packing tape from the sides of the trap and behind the treadle to increase the volume of collected hair as the individual moved through the trap (Suckling 1978; Sanecki and Green 2005; Schwingel and Norment 2010).
We attached traps horizontally 1.5 m from the ground on the bole of a tree following procedures described in Carey et al. (1991). We baited traps with a mixture of peanuts, peanut butter, oats, and molasses, switching to black oil sunflower seeds during periods of high black bear (Ursus americanus) activity. Bait was suspended from the top of the trap using a paperclip and wax paper to reduce bait consumption by mice (Peromyscus spp.). We covered the traps with a tarp to protect the bait and brushes from rain.
We deployed 10 snares at 4 locations: 2 along Canaan Loop Road (39.074 N, −79.471 W) and 2 in Blackwater State Park (39.112 N, −79.491 W) of West Virginia from May to October 2014. Because G. s. fuscus is a species of conservation concern, we checked traps daily to prevent any permanent captures until fully confident the traps functioned as expected and squirrels would escape, at which point we checked the traps every 3 days. If traps could not be checked as scheduled, we deactivated the traps until regular checking resumed.
We collected brushes and tape from closed traps for processing and set the traps with new brushes and tape. We removed any hair from the wire brushes and tape with tweezers, and placed collected hair in coin envelopes or microcapillary tubes with silica desiccant. We froze the coin envelopes and stored the microcapillary tubes at room temperature until mailing the samples to the Wildlife Physiology Lab in the Department of Forestry and Natural Resources at Purdue University for identification and processing. Before reusing brushes, we used an open flame on the bristles to remove any residual hair. We replaced tape on dowel rods for deployment. We identified the hair samples to species using morphological features under a compound microscope based on methods in Trapp and Flaherty (in press).
Additionally, we received hair samples from nest boxes from the USFS Greenbrier Ranger District (located approximately 50–60 km southwest of Davis, West Virginia, in the MNF) for use in stable isotope analysis. These hair samples were collected directly from individual flying squirrels during nest box checks conducted by Forest Service and West Virginia Division of Natural Resource biologists. All methods were approved by Purdue University’s Institutional Animal Care and Use Committee (Protocol #1310000959) and followed guidelines established by the American Society of Mammalogists (Sikes et al. 2011).
Stable isotope diet analysis.
We processed samples for stable isotope analysis in the Wildlife Physiology Lab at Purdue University. We cleaned and removed lipids from hair samples using a 2:1 chloroform:methanol solution and dried diet items collected during diet-availability surveys and hair for 48 h at 60°C (Cryan et al. 2004; Pauli et al. 2009). We then used a mixer mill (Retsch MM 200; Glen Mills Inc., Clinton, New Jersey) to grind each diet-item sample into a fine powder, and cut the hair into small fragments using scissors. We weighed subsamples of each sample in miniature tin weigh boats (4 × 6 mm; Costech Analytical Tech Inc., Valencia, California) using a Sartorius microbalance (model CPA2P; Arvada, Colorado) and submitted the samples to the University of Wyoming Stable Isotope Facility (UWSIF) for final analysis of stable isotope signatures. When sample quantity allowed, we weighed each sample in duplicate for quality control, and accepted sample results if the variance between the 2 subsamples did not exceed the variance of the standards (Ben-David and Flaherty 2012). Isotope data were obtained using a Costech 4010 Elemental Analyzer (Costech Analytical Technologies, Valencia, California) coupled to a Thermo DeltaplusXP IRMS mass spectrometer (Thermo Fisher Scientific, Inc., Waltham, Massachusetts). PeeDee Belemnite and atmospheric air were used as standards for δ13C and δ15N, respectively, and the UWSIF used Glutamic 1 and Glutamic 2 as quality control reference materials. The average standard uncertainty for both δ13C and δ15N was 0.1 during analysis.
Using a multivariate analysis of variance (MANOVA) and post hoc Tukey’s multiple comparison test as well as a k-nearest neighbor randomization test (Rosing et al. 1998), we delineated diet items into groups (Zar 2010), combining diet items that did not differ significantly (P > 0.05) in δ15N and δ13C values. We used a MANOVA to determine if the isotopic signatures differed among seasons and localities.
We used the dual-isotope linear mixing model SISUS (Stable Isotope Sourcing Using Sampling—Erhardt et al. 2014) to determine the proportional contribution of potential food items to the diet of G. s. fuscus by comparing the ratio of heavy to light isotopes of carbon (δ13C) and nitrogen (δ15N) of the hair (Supplementary Data SD1) to that of the potential diet items. Initial analyses using Bayesian mixing models (Moore and Semmens 2008) defaulted to uninformative priors likely due to distribution of the data; therefore, we used SISUS to avoid problems with model convergence. To account for diet-consumer discrimination, we used a transformation of 5.3‰ for δ13C and 3.5‰ for δ15N based on a similar diet study of another mycophagist mammal, the red-backed vole (Myodes gapperi—Sare et al. 2005). Because of changes in discrimination when switching to a higher-protein diet (Kurle et al. 2014), such as when adding beechnuts to the diet, we increased the δ13C to 5.7‰ for the spring diets based on a similar increase for hair samples when switching laboratory rats from a wheat diet to a wheat-fish diet (Kurle et al. 2014).
Results
Food availability.
The availability of some diet items differed among habitats. The importance value for red spruce (surrogate for hypogeous fungi availability—Loeb et al. 2000) was 1.8 times higher in red spruce habitat than conifer (z = −1.76, P = 0.04) and mixed conifer-hardwood (z = −1.76, P = 0.04) habitat. There was no difference in red spruce importance values between conifer and mixed conifer habitat (z < 0.001, P < 0.50). The hardwood habitat had no red spruce present, and therefore had an importance value of 0.00 (Table 1).
Mean (± SD) importance values and measurements used to evaluate habitat for Glaucomys sabrinus fuscus within the 4 habitat types in the Monongahela National Forest, West Virginia, United States, from August 2014 to August 2015.
| Conifer | Hardwood | Mixed conifer | Spruce | |
|---|---|---|---|---|
| Red spruce importance value | 51.60 ± 19.55 | 0.00 ± 0.00 | 51.75 ± 19.56 | 95.24 ± 22.12 |
| American beech importance value | 10.71 ± 28.28 | 32.98 ± 63.94 | 34.83 ± 49.97 | 13.10 ± 37.14 |
| Epigeous fungi transect intersection (cm) | 2.40 ± 0.83 | 1.64 ± 1.28 | 1.89 ± 1.33 | 2.06 ± 0.95 |
| Downed wood transect intersection (cm) | 72.07 ± 82.40 | 50.27 ± 38.14 | 142.21 ± 140.70 | 135.55 ± 105.53 |
| Lichen transect intersection (cm) | 0.00 ± 0.00 | 0.00 ± 0.00 | 0.00 ± 0.00 | 0.00 ± 0.00 |
| Invertebrate abundance (number of invertebrates/site) | 2.01 ± 2.16 | 2.07 ± 2.07 | 1.38 ± 1.08 | 1.76 ± 1.49 |
The importance value for American beech was highest in the mixed conifer-hardwood habitat, being 3.2 times more important in mixed conifer-hardwood than in conifer habitat (z = −1.93, P = 0.02), and 2.68 times more important than in spruce habitat (z = −1.93, P = 0.02). Mixed conifer-hardwood and hardwood habitats had similar American beech importance values (z = −0.58, P = 0.28). The American beech importance values for conifer, hardwood, and spruce habitats did not differ significantly (Table 1).
Epigeous fungi were 1.27 times more available in conifer habitat than in mixed conifer-hardwood habitat (z = 1.68, P = 0.04), and 1.17 times more available than in spruce habitat (z = 1.98, P = 0.02). The difference between conifer and hardwood habitats had a marginal P-value, suggesting a possible difference in epigeous fungi availability (z = 1.44, P = 0.07). The availability of epigeous fungi did not differ between hardwood habitat and mixed conifer-hardwood habitat (z = 0.26, P = 0.39) or spruce habitat (z = 0.51, P = 0.30); nor did epigeous fungi availability differ between mixed conifer-hardwood and spruce habitat (z = 0.24, P = 0.41; Table 1).
Differences in abundance of downed wood, which also may be related to availability of hypogeous fungi (Clarkson and Mills 1994), had a marginal P-value, suggesting a possible difference across habitat types (F3,56 = 2.53, P = 0.07; Table 1). We did not encounter any fallen arboreal lichen during the % occurrence surveys or any hypogeous fungi truffles in our truffle plots.
From the pitfall traps, we collected 275 specimens distributed among 11 taxa of invertebrates. Chilopoda made up 22% of the collected specimens, followed by Diplopoda at 21% and Coleoptera at 18%. Psocoptera were collected at the most plots (58%), followed by Diplopoda (48%) and Chilopoda (45%). Of the 3 most abundant invertebrates (Chilopoda, Diplopoda, Coleoptera), only Chilopoda differed in detection rate across habitat types, being captured in 3 times as many plots in conifer habitat than in spruce habitat (z = 2.24, P = 0.03; Table 2). Overall, invertebrate abundance did not differ among habitat types (F3,56 = 0.62, P = 0.61; Table 1).
Number of survey plots with successful captures for each taxa of invertebrate and the total number of specimens captured in West Virginia in 2014 and 2015. Each habitat type was sampled using 15 plots. The asterisk denotes a significant difference at the α = 0.05 level.
| Conifer | Hardwood | Mixed-conifer | Spruce | Total | Total specimens captured | |
|---|---|---|---|---|---|---|
| Acarina | 2 | 3 | 1 | 2 | 8 | 8 |
| Aranaea | 4 | 5 | 4 | 3 | 16 | 21 |
| Chilopoda | 9* | 7 | 8 | 3* | 27 | 62 |
| Coleoptera | 7 | 8 | 7 | 11 | 33 | 51 |
| Diplopoda | 7 | 9 | 6 | 7 | 29 | 58 |
| Diptera | 1 | 0 | 0 | 0 | 1 | 1 |
| Ensifera | 1 | 5 | 0 | 4 | 10 | 18 |
| Formicidae | 0 | 1 | 0 | 1 | 2 | 2 |
| Hymenoptera | 1 | 0 | 0 | 0 | 1 | 1 |
| Isopoda | 0 | 1 | 2 | 0 | 3 | 3 |
| Psocoptera | 8 | 9 | 7 | 11 | 35 | 50 |
Hair collection.
From May 2014 to October 2014, we collected 159 and 157 hair samples at Yellow Birch Trail and Canaan Loop Road, respectively, for a total of 316 samples. Of the 316 samples, 42 were identified as G. s. fuscus, of which 24 had > 0.250 µg for use in stable isotope analysis. Fifteen hair samples were from Yellow Birch Trail, and 9 were from Canaan Loop Road. Additionally, we received 9 samples from nest boxes located in the Greenbrier Ranger District. In 2015, we collected 3 hair samples from hair snares near Davis, West Virginia, and 3 were collected using hair snares in the Greenbriar Ranger District. Of the 40 hair samples processed for stable isotope analysis, 21 samples were collected in spring and 19 samples collected during fall (Table 3).
Mean (± SD) isotopic values for δ13C and δ15N of Glaucomys sabrinus fuscus hair samples (n = 40) for spring and fall in 2014 and 2015. For each year, the mean (± SD) isotopic values for δ13C and δ15N are provided for 5 locations in the Monongahela National Forest, West Virginia, United States.
| Year | n | δ13C | δ15N | |
|---|---|---|---|---|
| Spring | 2014 | 21 | −20.08 ± 1.15 | 5.88 ± 1.93 |
| Fall | 2014 | 12 | −20.00 ± 0.65 | 5.08 ± 1.36 |
| Canaan Loop Road | 2014 | 9 | −20.34 ± 1.38 | 5.43 ± 1.66 |
| Yellow Birch Trail | 2014 | 15 | −19.73 ± 0.80 | 5.54 ± 1.67 |
| Nest Boxes | 2014 | 9 | −20.29 ± 0.75 | 5.84 ± 2.16 |
| Spring | 2015 | 1 | −21.87 | 4.63 |
| Fall | 2015 | 6 | −21.28 ± 2.78 | 5.42 ± 10.26 |
| Davis, West Virginia | 2015 | 3 | −20.23 ± 3.05 | 8.21 ± 0.77 |
| Upper Greenbriar | 2015 | 3 | −22.33 ± 0.73 | 2.61 ± 1.13 |
Stable isotope analysis.
The mean isotopic signature for all G. s. fuscus hair was δ13C = −20.28 (± 1.19 SD) and δ15N = 5.54 (± 1.97 SD). The isotopic signature for G. s. fuscus differed among locations (F10,64= 4.445, P < 0.001; Table 3) and years (F2,37= 4.904, P = 0.013), but did not differ among seasons (F2,37= 0.526, P = 0.595). Because beechnuts were not available in spring, and tree buds were consumed in spring and rarely in fall, we analyzed the 2 seasons separately. Based on molting patterns of northern flying squirrels (with one primary molt generally beginning in May—Villa et al. 1999) and results from the fecal analysis in a previous study (Mitchell et al. 2001), we included beechnuts in the spring analysis as a diet item because the hair from individuals collected in spring should reflect the diet of the individual during fall (Dalerum and Angerbjörn 2005). Similarly, the fall analysis included tree buds because the hair collected in fall should reflect the diet of the individual during spring. However, there was no observed difference in the isotopic signature of hair between spring and fall (Table 3).
Diet items were combined into 4 groups based on a MANOVA with a post hoc Tukey’s multiple comparison test (F22,286= 42.16, P < 0.01; Table 4) and k-nearest neighbor (P < 0.01). The isotopic signature for 3 of the diet items in the groups differed across years (birch: F2,16= 13.00, P < 0.01; maple: F2,12= 10.54, P < 0.01; and spruce buds: F2,11= 10.32, P < 0.001). These differences likely occurred because of variations in precipitation between years (121 cm in 2014, 132 cm in 2015—NOAA 2016), as well as small sample sizes (Ben-David and Flaherty 2012). Despite the temporal differences (collecting potential food items in different years), when we entered year as a covariate in the MANOVA, the variables were categorized into the same groups suggesting there was no significant difference between years.
Sample size (n) and mean isotopic signature (± SD) for δ13C and δ15N for each collected diet item for Glaucomys sabrinus fuscus in August 2014 and August 2015 in the Monongahela National Forest, West Virginia, United States. Group letters represent a significant (α = 0.05) difference in δ13C and δ15N values calculated from a multivariate analysis of variance (MANOVA) with a post hoc Tukey’s multiple comparison test (Zar 2010) and a k-nearest neighbor analysis (Rosing et al. 1998).
| Diet item | n | δ13C | δ15N | Group |
|---|---|---|---|---|
| Bait | 9 | −27.89 ± 0.28 | 0.04 ± 0.13 | A |
| Beechnuts | 8 | −31.99 ± 01.30 | −1.38 ± 0.81 | A |
| Red spruce seeds | 6 | −25.54 ± 1.03 | −3.00 ± 0.88 | B |
| Lichen | 10 | −25.21 ± 1.13 | −4.72 ± 1.25 | B |
| American beech buds | 16 | −31.99 ± 1.30 | −1.21 ± 1.15 | C |
| Yellow birch buds | 19 | −31.56 ± 1.72 | −2.62 ± 1.82 | C |
| Blueberries | 10 | −29.48 ± 0.92 | −3.26 ± 1.92 | C |
| Red maple buds | 15 | −28.88 ± 2.16 | −2.95 ± 2.38 | B |
| Red oak buds | 13 | −30.58 ± 1.55 | −1.80 ± 1.35 | C |
| Red spruce buds | 14 | −30.33 ± 1.27 | −2.10 ± 1.58 | C |
| Epigeous fungi | 19 | −25.59 ± 1.30 | 4.96 ± 3.41 | D |
| Invertebrates | 16 | −25.64 ± 0.72 | 3.76 ± 1.42 | D |
| Hypogeous fungi | 10 | −26.66 ± 1.39 | 5.5 ± 1.67 | D |
Across seasons and locations, truffles, epigeous fungi, and invertebrates were the most important diet items based on the results of the stable isotope mixing model, contributing between 0.66 (fall) and 0.71 (spring) to the assimilated diet, followed by lichens, which ranged from 0.22 (spring) to 0.33 (fall), and beechnuts and vegetation at 0.07 and 0.01, respectively (Table 5; Fig. 1).
Relative contribution to the diet of Glaucomys sabrinus fuscus during spring and fall 2014–2015 in the Monongahela National Forest of West Virginia, United States. Proportions of diet items relative to the overall squirrel diet were estimated using a dual-isotope mixing model.
| Diet item | Relative contribution | |
|---|---|---|
| Spring | Fall | |
| Hypogeous fungi, epigeous fungi, and invertebrates | 0.66 | 0.71 |
| Lichens | 0.33 | 0.22 |
| Vegetation | 0.01 | — |
| Beechnuts | — | 0.07 |
| Diet item | Relative contribution | |
|---|---|---|
| Spring | Fall | |
| Hypogeous fungi, epigeous fungi, and invertebrates | 0.66 | 0.71 |
| Lichens | 0.33 | 0.22 |
| Vegetation | 0.01 | — |
| Beechnuts | — | 0.07 |
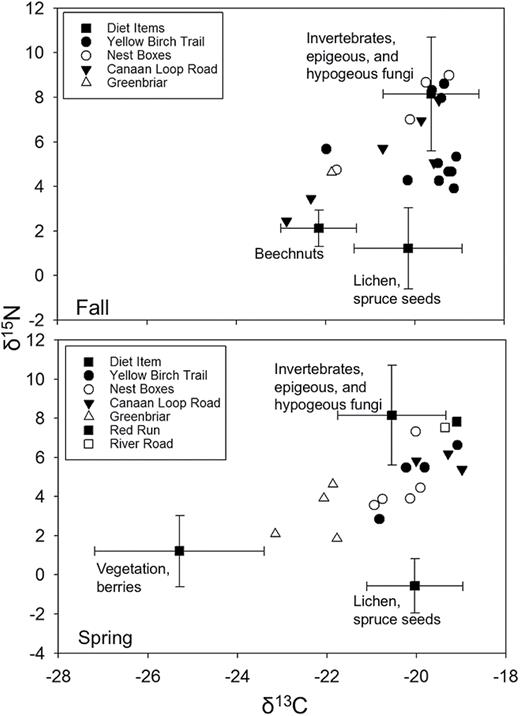
Range of isotopic means (± SD) for groups of potential diet items (squares) for Glaucomys sabrinus fuscus and isotopic signatures of individual squirrels from hair collected in the fall and spring of 2014 and 2015 in the Monongahela National Forest and Blackwater State Park, West Virginia, United States.
Discussion
The stable isotope analysis revealed that hypogeous fungi, epigeous fungi, invertebrates, lichen, and beechnuts were dominant components of the diet of G. s. fuscus. Our results demonstrate the value of stable isotope analysis as a follow-up to fecal analysis. Mitchell et al. (2001) found a high proportion of fecal pellets from G. s. fuscus in the MNF with tree buds present, which may have suggested a high contribution of tree buds to the assimilated diet of G. s. fuscus. Our results show, however, that whereas buds may be consumed by squirrels, these items are not highly assimilated into the tissues of G. s. fuscus. Furthermore, Mitchell et al. (2001) reported a decrease in lichen consumption in the fall, whereas our results suggest lichens play an increased role in the fall diet of G. s. fuscus. The disparities between the fecal analysis and stable isotope analysis may be explained by the differences in digestibility of various diet items. A wide variety of tree buds appear to be consumed by G. s. fuscus, but their apparent low digestibility increases their prominence in the fecal pellets. Lichen is highly digestible (Robbins 1987), and therefore when consumed may not be present in fecal matter or recognized by observers. G. s. fuscus may assimilate lichen more in the fall, which would account for the decrease in fecal pellet observations but increased tissue assimilation. Another consideration is the temporal relationship between diet and tissue or analysis method. Fecal samples reflect food items consumed during the last meal, whereas hair samples represent the overall assimilated diet since last molt (Dalerum and Angerbjörn 2005), which for northern flying squirrels was likely in spring (Villa et al. 1999).
Although truffles, epigeous fungi, and invertebrates comprised a majority of the diet of G. s. fuscus, we were unable to determine from stable isotope analysis alone which of the 3 contributed the most due to their similar isotopic signatures. A larger sample size as well as collection of specific species within each of the 3 categories may have provided sufficient evidence to differentiate separate groups. A similar study on Prince of Wales Island, Alaska, suggested that whereas invertebrate fragments were found in the fecal pellets of the Prince of Wales northern flying squirrel (G. s. griseifrons), a majority of them were small wings, which may be a result of incidental consumption while foraging for hypogeous and epigeous fungi (Flaherty et al. 2010b).
The consumption of tree buds in the spring and beechnuts in the fall suggests that these items supplement the diet of G. s. fuscus. Truffles and lichen are both low in nitrogen relative to foods with greater amounts of protein, and the nitrogen found in truffles may be indigestible by small mammals, including flying squirrels (Cork and Kenagy 1989; Dubay et al. 2008). Although tree buds and beechnuts do not provide the greatest proportional contribution to the assimilated δ15N and δ13C of G. s. fuscus, their consumption may provide alternative minerals or vitamins essential to their diet. Therefore, stable isotope analysis alone would not be able to reveal the potential importance of tree buds and beechnuts to the diet of G. s. fuscus. Our findings corroborate a similar study on the diet of G. s. griseifrons (Flaherty et al. 2010b) in Southeast Alaska. Their findings suggested a large contribution of lichen to the overall diet of G. s. griseifrons, despite a similar lack of substantial amounts of lichen found in the fecal pellets of a previous study (Pyare et al. 2002). This suggests that at least 2 subspecies of northern flying squirrel may rely more on lichen as a staple diet item than previously recognized.
Our food availability surveys revealed differences in availability of diet items among habitat types. Based on the lower red spruce importance values in hardwood, conifer, and mixed-conifer habitats, hypogeous fungi appear to be largely unavailable to dispersing G. s. fuscus in the habitat surrounding red spruce stands. Red spruce is positively associated with hypogeous fungi (Loeb et al. 2000), but the variable and patchy distribution of hypogeous fungi made direct measurement of availability difficult. Abundance of downed wood, which is positively associated with hypogeous fungi truffles in the western part of the continent (Clarkson and Mills 1994), was not different across habitat types. However, Loeb et al. (2000) found no association between downed woody debris and the presence of hypogeous fungi truffles in the southern Appalachians, suggesting that downed wood may not be an indicator of truffle availability for G. s. fuscus and stand age may be a more reliable indicator.
Epigeous fungi were most available in conifer habitat, and are more available in conifer, mixed conifer-hardwood, and hardwood habitats than in red spruce habitat, suggesting epigeous fungi may be available to dispersing G. s. fuscus. Although arboreal lichen was not encountered during our fieldwork, surveys of lichen abundance in New England found various species of lichen in both conifer and hardwood habitats, suggesting an availability of lichen across habitat types (Selva 1994). However, Selva (1994) found a strong connection between lichen abundance and forest age, with higher lichen availability in more mature forests. Furthermore, the importance value for American beech, which may correspond to the availability of beechnuts, was higher in hardwood and mixed conifer-hardwood habitats than in red spruce habitat. The beechnut crop corresponds with the dispersal season of G. sabrinus (Villa et al. 1999), potentially providing forage for dispersing individuals. However, G. s. fuscus may encounter high levels of competition for beechnuts from hard-mast specialists, such as G. volans and red squirrels (Tamiasciurus hudsonicus), and beechnuts are only available during a limited time period. Future research should focus on additional potential limiting factors, such as the behavioral exclusion of G. s. fuscus by G. volans in the habitat surrounding red spruce (Weigl 1978) and impacts of climate change on forest configuration and patch extent of red spruce (White and Cogbill 1992). Furthermore, a greater understanding of dispersal behavior of G. s. fuscus may provide further insights regarding the energetic requirements of dispersing juveniles and whether dispersing juveniles forage for specific foods, or rely on energy stores while moving through the landscape (Zollner and Lima 2005).
Based on our results, management of the dispersal matrix for G. s. fuscus should consider prioritizing mature red spruce patches that may act as connections between larger areas of red spruce. These patches may provide hypogeous fungi truffles and lichen for dispersing G. s. fuscus, as well as other diet items identified through stable isotope analysis. However, regardless of forest type, mature stands typically had structural features and composition that afforded food resources, whereas younger stands did not. This suggests that managers should consider stand age and structure to a greater degree than forest type for management of habitat outside of red spruce stands for G. s. fuscus.
Supplementary Data
Supplementary data are available at Journal of Mammalogy online.
Supplementary Data SD1.—The δ13C and δ15N signatures and C:N ratios for individual Glaucomys sabrinus fuscus sampled in the Monongahela National Forest, West Virginia, United States, in spring and fall 2014–2015. The Canaan Loop Road, Yellow Birch Trail, Red Run, and River Road samples were all collected using hair snares near Davis, West Virginia. The nest box samples were collected directly from individual squirrels during nest box checks in the northern region of the Monongahela National Forest. The Greenbriar samples were collected in the Greenbriar Ranger District approximately 50–60 km south of Davis, from nest box surveys.
Acknowledgments
Funding and support were provided by Purdue University, the Friends of Blackwater, USDA Forest Service Monongahela National Forest, and the National Institute of Food and Agriculture, Department of Agriculture, Hatch Project, Accession No. 1004115 (EAF). We thank B. All, C. Jamieson, and B. Harpool for checking traps and collecting hair, and C. Stihler and S. Jones for providing hair collected from nest boxes. We also thank P. Zollner and C. Day for friendly reviews of the manuscript.
Literature Cited
