


Abstract
The northern elephant seal, Mirounga angustirostris, was heavily hunted and declared extinct in the 19th century. However, a colony remained on remote Guadalupe Island, Mexico and the species has since repopulated most of its historical distribution. Here, we present a comprehensive evaluation of genetic variation in the species. First, we assess the effect of the demographic bottleneck on microsatellite variability and compare it with that found in other pinnipeds, demonstrating levels of variation similar to that in species that continue to be threatened with extinction. Next, we use sequence data from these markers to demonstrate that some of the limited polymorphism predates the bottleneck. However, most contemporary variation appears to have arisen recently and persisted due to exponential growth. We also describe how we use the range in allele size of microsatellites to estimate ancestral effective population size before the bottleneck, demonstrating a large reduction in effective size. We then employ a classical method for bacteria to estimate the microsatellite mutation rate in the species, deriving an estimate that is extremely similar to that estimated for a similar set of loci in humans, indicating consistency of microsatellite mutation rates in mammals. Finally, we find slight significant structure between some geographically separated colonies, although its biological significance is unclear. This work demonstrates that genetic analysis can be useful for evaluating the population biology of the northern elephant seal, in spite of the bottleneck that removed most genetic variation from the species.
The northern elephant seal (Mirounga angustirostris) possesses a unique recent population history among mammals. In the early 1800s, it was abundant and widely distributed on the Pacific coast of North America, from Baja California, Mexico to northern California, United States (Scammon 1874; Stewart et al. 1994). However, by 1860, an intensive sealing industry had already eliminated the species from most of its range and it was scarce everywhere (Doughty 1971; Townsend 1885). In the following decades, a few seals were sighted on islands off the coast of Baja California, but all were killed. In the absence of further sightings, by the late 1880s, the species was erroneously presumed to be extinct (Scammon 1874; Townsend 1885, 1912; Anthony 1931). In the 1890s, however, an expedition from the US National Museum of Natural History found a remnant population of elephant seals on Guadalupe Island (GI), Mexico and collected all but one of the animals, and the species was again erroneously declared extinct (Townsend 1912; Huey 1930). But a small population persisted on GI, and it began to slowly increase in size, despite continued pressure from hunters and collectors. Nonetheless, as of 1957, the species was still largely concentrated on GI, with less than 1% breeding in the California Channel Islands, United States (Bartholomew and Hubbs 1960).
In the last half century, however, the population has grown in a roughly density-independent manner (Figure 1), with a concurrent expansion of its geographic range to occupy most of its former habitat. LeBoeuf and Bonnell (1980) estimated the total population size of the northern elephant seal at 115 000 in 1980 and Lowry et al. (2014) estimated its size at 225 000 in 2010, with a continuing growth rate of 3.8%. Although many mammalian species have gone through severe demographic bottlenecks, none have gone through such a severe reduction followed by such a rapid population increase, at least in historical times (O’Brien and Evermann 1988).
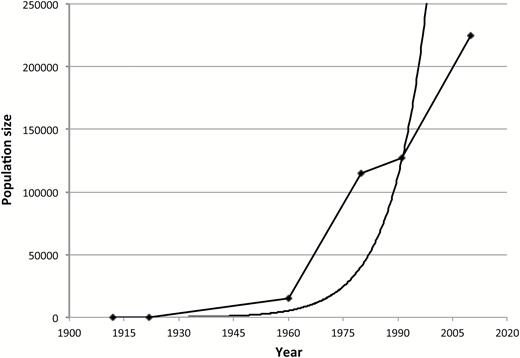
Northern elephant seal population growth. Estimated population sizes are represented by the diamonds and are from the following sources: Townsend 1912, Hanna 1925, Bartholomew and Hubbs 1960, LeBoeuf and Bonnell 1980, Stewart et al. 1994, Lowry et al. 2014. A curve that fits an exponential growth function to the data is also included.
Species which undergo extreme population bottlenecks typically lose much of their genetic variation (Nei et al. 1975) and the northern elephant seal is no exception. Bonnell and Selander (1974) examined 24 allozyme loci in 159 seals from sites which encompassed much of the geographic range of the species, and found no variation. They interpreted this monomorphism as a result of genetic drift due to the demographic bottleneck. Hoelzel et al. (1993) further confirmed this result by surveying 43 additional protein loci in 67 individuals from 2 central California rookeries. They also sequenced 300bp of the control region of mitochondrial DNA (mtDNA) in 40 animals from a central California rookery. Although this locus is normally highly polymorphic, they found only 3 variable sites and 2 haplotypes. In contrast, sequences of this same mtDNA locus from 48 southern elephant seals revealed 26 variable sites and 26 haplotypes (Hoelzel et al. 1993). Weber et al. (2000) examined this same mtDNA region in more than 100 animals from the 2 largest rookeries in the United States, San Miguel (SMI) and San Nicolas islands (SNI), and again found only the 2 haplotypes. They were also able to directly demonstrate the reduction in genetic variation through analysis of pre-bottleneck museum specimens and archaeological remains and Hoelzel et al. (2002) confirmed this result with additional loci, including several nuclear microsatellite markers. Lehman et al. (1993) examined variation with 2 minisatellite probes in the northern elephant seal and in the sympatric harbor seal (Phoca vitulina). They found highly reduced variation in the elephant seal relative to the harbor seal. Finally, Sanvito et al. (2013) isolated novel microsatellite loci in the northern elephant seal and characterized variation in 22 of them in a population from Mexico. They found only 9 of the 22 to be variable, with a mean number of alleles per locus of 1.7 (±1.2). However, as microsatellites and minisatellites mutate rapidly, it remains uncertain whether the variation observed at these loci arose recently through mutation or represents genetic variants that made it through the bottleneck.
A bottleneck of the sort experienced by the northern elephant seal can have at least 3 possible detrimental effects. First, the bottlenecked species is at risk of extinction through demographic and environmental stochasticity (Gilpin and Soulé 1986). Second, it faces inbreeding and consequent inbreeding depression, which can have major effects on fitness of natural populations (Conrad et al. 2013; Hoffman et al. 2014). Third, the decreased genetic variation reduces the ability of the species to respond to changes in the environment, including emergent pathogens (Franklin and Frankham 1998).
Here, we assess the effect of this demographic bottleneck on nuclear genetic variability in the northern elephant seal using a large number of microsatellite loci. Our initial goal is to determine whether a pattern of monomorphism, as observed at allozyme loci, or of limited but measurable genetic variation, as found at with mtDNA and tandem repeat loci, is observed at multiple loci spread across the genome. We also compare genetic variation in the northern elephant seal and in 5 closely related phocid seal species, using data from microsatellite loci. We then use sequence data from the microsatellite loci to evaluate whether any of the limited polymorphism uncovered in the contemporary population predates the bottleneck or has been generated by post-bottleneck mutations.
Next, we use information about microsatellite mutation and the fate of neutral alleles in an exponentially growing population to predict which of the alleles observed may have newly arisen by mutation since the reduction in size, drawing inference from the allele frequency distributions. We then use this information to estimate mutation rates, employing the approach developed in the classic paper by Luria and Delbrück (1943) who studied mutation to virus resistance in an exponentially growing population of bacteria started from a single cell. Such an approach has been employed to estimate mutation and recombination rates in exponentially growing human populations (Hästbacka et al. 1992; Shenkar et al. 1996). The northern elephant seal population growth has been roughly analogous to that of the classical bacterial system, because the post-bottleneck species was founded by such a small number of individuals and the population has grown exponentially in number since the bottleneck. We also exploit information inherent in the range of allele size at microsatellite loci to draw inference about the size of the ancestral northern elephant seal population.
Finally, we use population samples from all of the major breeding colonies/areas of the species to assess whether population structure has arisen since the bottleneck, in spite of the recent founding of all of the colonies by migrants from the remnant population on GI.
Materials and Methods
Sample Collection
Tissue samples were obtained from colonies representing nearly the entire breeding range of the northern elephant seal (Figure 2). A total of 169 northern elephant seal tissue samples were collected from adults of 2 of the 3 largest northern elephant seal colonies on SNI (n = 64) and SMI (n = 105) Islands, California in 1997 and focused on putative mother/pup pairs, as these potentially provide information about linkage and Mendelian inheritance. Samples were also collected in 1998 at Piedras Blancas, California (PB; n = 96), and an additional 269 northern elephant seal pups, almost entirely from the northernmost colonies of Año Nuevo, the Farallon Islands and Point Reyes, California, were sampled either during the course of veterinary care or upon necropsy at the Marine Mammal Center, Sausalito, California. Samples were also collected in the 2003 and 2005 breeding seasons from 285 weaned pups of both sexes at the main Mexican breeding colonies: San Benito and Cedros Islands (SBC; n = 112), and GI (n = 173).
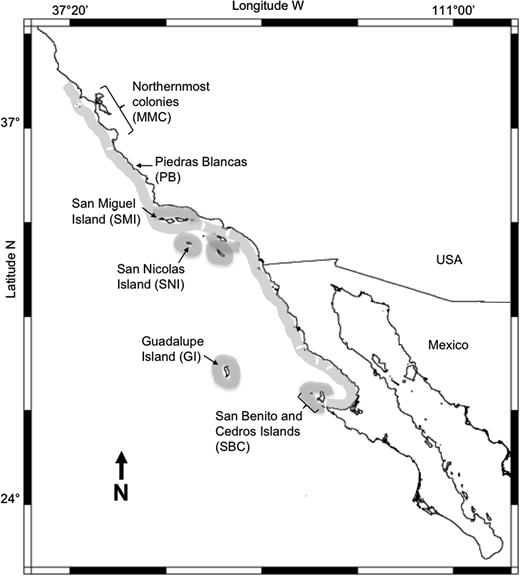
Northern elephant seal distribution of breeding areas (shaded) and sampling sites: SBC (n = 112); Guadalupe Island (n = 173); SNI (n = 82); SMI (n = 105); PB (n = 96) and the northernmost colonies which correspond to Año Nuevo, the Farallon Islands and Point Reyes (n = 269). MMC = Marine Mammal Center.
Genetic Analysis
Tissue samples were digested with proteinase K, followed by DNA extraction with a filter-based system (DNeasy Tissue Kit, Qiagen Inc.), either individually or in 96 well microplates with a semi-automated protocol on a BioRobot 3000 (Qiagen).
Primer sets for 60 microsatellite loci previously identified in other pinnipeds were screened initially for amplification and polymorphism on a panel of 8–16 northern elephant seals. These loci were originally discovered in 10 different pinniped species, mostly phocids, but including representatives from all 3 major pinniped lineages. As such, ascertainment bias should be limited and potentially only an issue for interspecific analyses. Primer sequences and references for the original descriptions of these loci are in Table 1 and Supplementary Table 1. These microsatellite loci were amplified using polymerase chain reaction (PCR) in 15 µL volumes containing approximately 80 ng of template DNA, 0.041U AmpliTaq DNA polymerase (Applied Biosystems, Inc.), 1.5 μL PCR buffer (Applied Biosystems), 0.9 mM MgCl2, 0.5 mM dNTPs, and 5 μmol of each primer. Reverse primers were fluorescently labeled. PCR conditions consisted of an initial denaturation at 95 °C for 2 min followed by: (95 °C for 15 s, 53 °C for 15 s, 72 °C for 45 s) × 9 cycles and (89 °C for 15 s, 55 °C for 15 s, 72 °C for 45 s) × 24 cycles and finally 5 min at 72 °C.
Polymorphic microsatellite loci, the species in which they were originally identified, the number of alleles found in this study, the allelic richness from rarefaction, and the expected (He) and observed (Ho) heterozygosity by locus
| Locus | Species in which locus was identified | Reference | Number of alleles | Allelic richness | He | Ho |
|---|---|---|---|---|---|---|
| Hi-8 | Hydrurga leptonynx | Davis et al. (2002) | 3 | 2.99 | 0.64 | 0.64 |
| Lw-20 | Leptonychotes weddellii | " | 4 | 3.13 | 0.66 | 0.65 |
| Lw-18 | " | " | 4 | 2.14 | 0.5 | 0.25 |
| Lw-16 | " | " | 2 | 2.00 | 0.45 | 0.42 |
| Lw-10 | " | " | 4 | 2.07 | 0.5 | 0.51 |
| Lw-8 | " | " | 2 | 1.40 | 0.05 | 0.05 |
| HG2.3 | Halichoerus grypus | Allen et al. (1995) | 4 | 3.01 | 0.61 | 0.6 |
| HG3.6 | " | " | 2 | 1.90 | 0.18 | 0.18 |
| HG4.2 | " | " | 2 | 2.00 | 0.5 | 0.52 |
| HG8.9 | " | " | 3 | 2.72 | 0.53 | 0.51 |
| HG8.10 | " | " | 2 | 1.99 | 0.3 | 0.29 |
| MA11A | Mirounga angustirostris | Gemmell et al. (1997) | 2 | 1.99 | 0.31 | 0.3 |
| MA11C | " | Allen (1995) | 3 | 1.29 | 0.03 | 0.03 |
| PVC1 | Phoca vitulina | Duffy et al. (1996) | 5 | 3.03 | 0.66 | 0.64 |
| PV9 | " | Goodman (1997) | 2 | 2.00 | 0.43 | 0.4 |
| PV17 | " | " | 2 | 1.01 | 0 | 0 |
| PVC26 | " | Coltman et al. (1996) | 2 | 1.99 | 0.3 | 0.3 |
| PVC43 | " | " | 4 | 3.45 | 0.45 | 0.45 |
| PVC74 | " | " | 7 | 3.08 | 0.66 | 0.32 |
| Orr1 | Odobenus r. rosmarus | Buchanan et al. (1998) | 5 | 3.06 | 0.56 | 0.55 |
| Orr10 | " | " | 3 | 1.93 | 0.19 | 0.1 |
All loci are dinucleotide repeats.
Microsatellite fragment analysis was performed on an ABI377 automated DNA sequencer (Applied Biosystems) and allele sizes estimated using Genotyper 2.1 software (Applied Biosystems). Allele size determinations were performed twice manually to reduce scoring error. Polymorphic microsatellite loci were selected for further analysis.
The sequence of each allele from every polymorphic locus was determined through a cloning and Sanger-sequencing protocol to evaluate the contribution of sequence-level variation to allele size variation. An additional PCR was performed in a 50 μL volume with 80 ng of DNA as a template. The PCR products were assayed in agarose and then purified and ligated into TA cloning vectors (Invitrogen, Inc.) according to the manufacturer’s instructions. Half of the ligated product was then used to transform competent cells by heat shock. Cells were plated onto LB/Carbencillin agarose plates with IPTG and X-Gal added for color selection. Positive colonies were cultured overnight in 4 mL of LB/Carbencillin and minipreps were then prepared. Plasmid DNA was sequenced on either a 377 or a 3730xl automated DNA sequencer (Applied Biosystems). Clones were sequenced in both directions and at least 2 clones were sequenced for each allele. When there were discrepancies between the 2 sequences, or when a sequence differed in size from what had been determined in the genotyping analysis, additional clones were sequenced to identify errors introduced in the PCR or cloning steps. The sequences were used to determine the number of uninterrupted repeats and the minimum number of mutations that separated alleles.
Statistical Analysis
Microsatellite allele frequencies, linkage disequilibrium (LD) and deviations from Hardy-Weinberg equilibrium (HWE) were examined using GENEPOP 4.0 (Rousset 2008). Because of the small number of alleles, the exact test of Louis and Dempster (1987) was employed. Probabilities of exclusion for paternity analysis were calculated from the allele frequencies according to Weir (1990). HWE was calculated in PVC74, Lw18 and Orr10 by excluding males and pups of unknown sex because of known X-linkage (Coltman et al. 1996; Davis et al. 2002; Sanvito et al. 2012). Expected (He) and observed (Ho) heterozygosities were estimated using GENETIX 4.05 (Belkhir et al. 1996–2004).
We compared the levels of genetic variability in the northern elephant seal with those in other pinniped species using data from the literature (Coltman et al. 1996; Gemmell et al. 1997; Pastor et al. 2004). The species compared include its 3 closest extant relatives: the southern elephant seal (Mirounga leonina), the Mediterranean monk seal (Monachus monachus), and the Hawaiian monk seal (Monachus shaunslandii). The grey seal (Halichoerus grypus) and the harbor seal (P. vitulina) were also included in this analysis for several reasons. First, most of the loci tested in this study were developed for those species. Second, sample sizes from those data sets are large, as with the current study. We compared the average number of alleles per locus since it is more sensitive to reductions in population size (Nei et al. 1975). All loci for which data were available in more than 3 of the above-listed species were included.
Mutation rate estimates were calculated using the Po approach of Luria and Delbrück (1943). This method is based on the equation π = 1−e−gμ where π is the proportion of chromosomes that carry the mutation, g is the number of generations since the bottleneck, and μ is the mutation rate. To calculate π, only the alleles present at a frequency lower than 5% and which differed by a single repeat unit from a common allele were considered to represent new mutations (Supplementary Table 2). Note that this analysis only considers the frequency of these alleles following the bottleneck and does not make any assumptions about their frequency prior to the bottleneck, as genetic drift can substantially change such frequencies during a reduction in population size. The number of generations (g) was estimated from the reproductive life history data of LeBoeuf and Reiter (1988) by taking the average of the mean age at which pups were weaned for females and the mean age at which males copulated. The long-term effective population size (Ne) of the ancestral northern elephant seal population was calculated using the equation n = (1 + 8 Neμ)−2 (Ohta and Kimura 1973), where n is the number of alleles and μ is the average mutation rate. The range in allele size was used as an estimate of the number of alleles in the ancestral population. The mutation rates calculated using the method above were used.
Differentiation between colonies was determined using an exact test (Raymond and Rousset 1995) as implemented in GenePop (Rousset 2008). Additionally, population genetic structure was inferred using the fixation index FST (Wright 1965).
Results
Of the 60 microsatellite loci that gave an interpretable pattern after optimization, 21 were found to be polymorphic with 2–7 alleles present and a global mean of 3.19 alleles per locus (2.48–2.71 when considered by colony; Table 2). Observed heterozygosity for the 21 variable loci ranged from 0.363 in the northernmost colonies to 0.375 in SBC. Observed and expected heterozygosities were strongly correlated (P < 0.05). Minimal LD between markers was found, with only 1 pair of markers (Lw-20a and PVC1a) in significant LD after Bonferroni correction. All loci were in HWE in all populations and in the northern elephant seal as a whole.
Expected (He) and observed (He) heterozygosity, mean number of alleles per locus, and allelic richness after rarefaction by population and over all
| Population | N | He | Ho | Alleles per locus | Allelic richness |
|---|---|---|---|---|---|
| MMC | 269 | 0.407 | 0.363 | 2.71 | 2.23 |
| PB | 96 | 0.402 | 0.367 | 2.57 | 2.26 |
| SNI | 64 | 0.388 | 0.367 | 2.57 | 2.21 |
| SMI | 105 | 0.394 | 0.370 | 2.48 | 2.19 |
| IG | 173 | 0.408 | 0.365 | 2.52 | 2.24 |
| SBC | 112 | 0.415 | 0.375 | 2.57 | 2.25 |
| Global | 454 | 0.405 | 0.367 | 3.19 | 2.23 |
Population codes are as in Figure 2.
Many of the allele frequency distributions in the northern elephant seal (Supplementary Table 2) revealed disjunct allele sizes (e.g., MA11A and HG4.2), with the observed alleles separated in size by several repeat units. At other loci, variation was continuous (e.g., PVC26, PV9, and MA11C). The pattern of allele frequencies was also quite variable. Some loci possessed all alleles in high frequencies (e.g., HG4.2 and Lw-16) and other loci have some alleles in high frequency and some that are rare (e.g., MA11C and HG3.6).
The number of alleles present in the northern elephant seal and in 5 other pinniped species is compared in Table 3. The average number of alleles for the northern elephant seal (3.19 alleles/locus) is the highest of the 4 closely related species except the southern elephant seal (3.65 alleles/locus); however, the sample size is 1 or 2 orders of magnitude higher in the northern elephant seal than in these other species. The species that are known to have undergone bottlenecks (the northern elephant seal, and the Mediterranean and Hawaiian monk seals) have around half of the variation present in species that are not known to have suffered such population reductions (weighted average = 3.09 alleles/locus vs. weighted average other species = 5.41 alleles/locus). The fact that variability in the southern elephant seal is greater than in the northern elephant seal, in spite of the very small sample size, indicates that the low variability in the northern elephant seal is not a lineage-specific phenomenon.
Comparison of allelic diversity in the northern elephant seal and 5 other phocid species
| Species | N | Population size | No. of polymorphic loci | Average no. of alleles per locus |
|---|---|---|---|---|
| Northern elephant seala | 819 | ∼225 000g | 21 | 3.19 |
| Southern elephant sealb | 6 | 739 498h | 17 | 3.65 |
| Grey sealc | 1633 | ∼430 000i | 9 | 9.80 |
| Harbor seald | 259 | 327 630i | 15 | 5.13 |
| Hawaiian monk seale | 2409 | 1112i | 8 | 3.50 |
| Mediterranean monk sealf | 98 | ∼300f | 15 | 2.32 |
N: sample size. Genetic data from: aThis study; bGemmell et al. 1997; cKlimova et al. 2014; dOlsen et al. 2014; eSchultz et al. 2008; fPastor et al. 2004. Population size estimates from: gLowry et al. 2014; hMcMahon et al. 2005; iNOAA, NMFS Stock Assessment Reports 2007.
Sequence-level variation of the 21 variable loci was examined to infer which alleles predated the bottleneck and which had been created by mutation since the bottleneck. This strategy rests on the assumption that 2 alleles will not be separated by more than 1 mutation if one has arisen from the other since the bottleneck and that, in certain cases, sequence data will reveal additional differences that are not evident in size data. The sequence data demonstrated that most of the loci are simple repeat microsatellites with alleles separated by a simple difference in the number of repeats. However, some loci contain multiple differences between alleles (e.g., HG8.9 and PVC74; Figure 3). At HG8.9, there are differences in 2 repeat regions and the 2 alleles are thus separated by a minimum of 2 mutations. PVC74 is even more complex. The 3 most frequent alleles (209bp = 39.25%, 215bp = 24.3%, 221bp = 36.06%) showed evidence of multiple mutations. The smallest allele (209bp) is separated from the larger alleles by at least 6 mutations in 5 different regions. The 2 larger alleles are separated by both a length change and a base substitution. All 3 of these alleles are in relatively high frequency and therefore almost definitely predate the bottleneck. The other 4 alleles (211bp, 213bp, 219bp, and 223bp), however, at frequencies ranging from 0.08% to 0.16%, are all separated from a common allele by 1 repeat, consistent with the assumption that they arose through recent mutations.
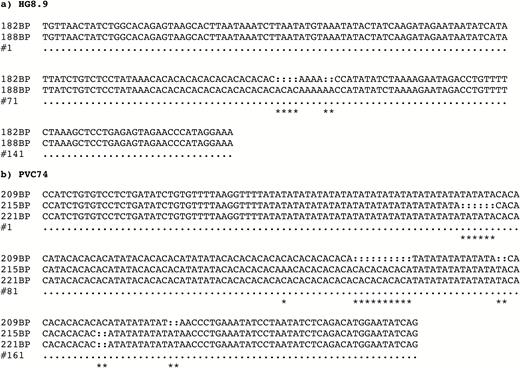
Complex mutational histories of microsatellite alleles in the northern elephant seal. (a) Sequence of 2 segregating alleles of HG8.9, (b) sequence of the 3 most common segregating alleles of PVC74. Stars represent differences between the alleles. Alignments within the repeat regions are arbitrary and homology of repeat units is neither known nor implied.
The estimated proportion of chromosomes that carry new mutations was 0.003 and the number of generations that passed between the bottleneck for the northern elephant seal and sample collection was approximately 12.75. The average mutation rate estimated for the 21 loci was thus μ = 2.22 × 10⁻⁴ mutations/locus/generation. Ancestral effective population size (Ne) was estimated using the range in allele size as described above and varied from 298 to 4761 over loci. The mean ancestral Ne calculated from all loci was 1259 and represents the long-term variance effective size over the genealogical history of the existing variation at these loci.
Little overall genetic structure was observed within the species, with very low pairwise FST values observed (range −0.0012 to 0.0084; Table 4), almost all of which were not significantly different than zero. However, a significant signal of genetic structure was observed between SNI and the northernmost rookeries (FST = 0.0071, P < 0.005). Genotypic differentiation tests between these 2 groups were also significant with (χ2 = 71.94, P < 0.005), as well as between those from PB and SNI (χ2 = 75.96, P < 0.005). However, the genetic differences uncovered were slight and their biological significance unclear.
Pairwise FST estimates for all loci (below diagonal) and genotypic differentiation
| Population | MMC | PB | SNI | SMI | GI | SBC |
|---|---|---|---|---|---|---|
| MMC | 39.972 | 71.939 | 54.749 | 40.761 | 38.455 | |
| PB | −0.0004 | 75.960 | 50.001 | 45.629 | 38.167 | |
| SNI | 0.0071 | 0.0084 | 52.494 | 58.699 | 63.171 | |
| SMI | 0.0022 | 0.0012 | 0.0046 | 61.845 | 50.282 | |
| GI | −0.0002 | −0.0003 | 0.0040 | 0.0029 | 35.492 | |
| SBC | −0.0002 | −0.0008 | 0.0053 | 0.0026 | −0.0012 |
Chi-squared values (above diagonal) are shown. Bold indicates significant after Bonferroni correction. Population codes are as in Figure 2.
Discussion
We demonstrate here that modest amounts of variability exist at microsatellite loci throughout the nuclear genome of the northern elephant seal and that at least some of it predates the 19th century bottleneck. This observation is in contrast with studies of nuclear genetic variability based on allozymes (Bonnell and Selander 1974; Hoelzel et al. 1993), which uncovered no nuclear genetic variability in this species. Our results corroborate the studies of Lehman et al. (1993), who found a small amount of nuclear variation in the species with probes for human minisatellites, but goes further in that we were able to directly measure the number of alleles and their size. Our results are also concordant with those of Sanvito et al. (2013), who found limited but measurable variability in newly discovered microsatellites surveyed in an elephant seal population from Mexico. Nevertheless, the northern elephant seal has extremely reduced variation relative to other pinniped species, including its closest relative the southern elephant seal, and has variation that is in the range of pinniped species that continue to be on the brink of extinction (Pastor et al. 2004). Given the large number of individuals and loci screened, the average of 3.19 alleles/locus is among the lowest value reported in any mammalian species (Garner et al. 2005), emphasizing the extremely reduced genetic variation present in the northern elephant seal.
We describe genetic variation on a much finer scale both quantitatively and qualitatively than previous northern elephant seal genetic studies. Sequence variability between alleles of some microsatellite loci demonstrate that at least some nuclear genetic variation was retained through the bottleneck. For example, the 3 most frequent alleles at locus PVC74 are separated by at least 6 mutations. The probability that such a pattern could have arisen from a monomorphic locus as a result of mutation since the bottleneck is exceedingly small, assuming that they are neutral. For this to be the case, the ancestral allele would need to undergo multiple mutations in 3 separate allelic lineages, in just a few generations, and leave no sign of intermediates. Furthermore, for those descendant alleles to rise to high frequency in an exponentially growing population, the new alleles would have to arise early in the post bottleneck recovery period, further restricting the number of generations in which this variability might have arisen. A similar argument applies for HG8.9, although the fact that a minimum of 2 mutations may separate the 2 alleles does not provide as strong evidence for pre-bottleneck variability. The patterns found at these loci indicating pre-bottleneck variation are some of the only ones where sequence variation could confirm such a phenomenon, since multiple mutations at simple repeat microsatellites typically result in homoplasy, whereas microsatellites with complex or multiple repeat regions often retain the sequence signature of multiple mutations (Garza and Freimer 1996).
Allele frequency distributions of the 21 variable microsatellite loci, coupled with what we know about microsatellite mutation, also indicate that much of the variation present today survived the bottleneck. Although insertions and deletions of several repeat units occur (e.g., Di Rienzo et al. 1994; Primmer et al. 1996; Wierdl et al. 1997), most microsatellite mutations involve the insertion or deletion of a single repeat unit (e.g., Strand et al. 1993; Weber and Wong 1993) and newly arising alleles will usually differ in size by 1 repeat unit from the progenitor allele. In an exponentially growing population, the frequency of an unselected allele is related to its age. In general, low frequency alleles have arisen recently and high frequency alleles are either founders or arose early in the exponential growth process (the “jackpot” phenomenon of Luria and Delbrück [1943]). Since the number of meiotic events is relatively small in the initial period, these “jackpot” events will be much rarer. Thus, a locus which has acquired variation solely through mutation after the bottleneck will generally have 1 high-frequency allele, with 1 low-frequency allele (or rarely several) which differs in size by a single repeat unit. This is exactly the pattern seen for some of the loci assayed (e.g., MA11C and HG3.6). However, several of the allele frequency distributions (Supplementary Table 2) reveal loci which have alleles with disjunct numbers of repeats and which are in high frequency (HG4.2, Lw-16), which suggests that they are also surviving pre-bottleneck variants. Other loci (HG8.9, PVC43, PVC74) have some alleles in high frequency with disjunct numbers of repeats and some of which are in low frequency and differ in size from a high frequency allele by a single repeat unit. The pattern of variability at this last set of loci can be interpreted as being the result of pre-bottleneck variation with the low frequency alleles representing variation due to new mutations. Other loci, such as HG8.10 and PV9, are more difficult to interpret. The patterns observed could easily be due to pre-bottleneck variation which by chance happened to preserve alleles with adjacent numbers of repeats, or they could represent loci at which the jackpot phenomenon has occurred; an allele arose after the bottleneck but early in the population growth phase, thus bringing the allele to appreciable frequency.
The patterns of allele frequency described above also allow estimation of the mean rate of mutation, μ, at these microsatellite loci, following the classic approach of Luria and Delbrück (1943). The estimate of μ derived using this method, 2.22 × 10⁻⁴ mutations/locus/generation, is very similar to that estimated for human dinucleotide microsatellites through direct observation (2.73 × 10⁻⁴; Sun et al. 2012) in what is likely the best such published estimate and similar to the estimates derived for other mammals with many different methods (e.g., Dallas 1992; Ellegren 1995). This finding indicates that, while there is substantial variation between loci, microsatellite repeat types and in different species, the mean rate across many microsatellites of the same repeat type is very similar within vertebrates, or at least mammals.
The allele frequencies also contain information about pre-bottleneck population size. In an outbred population, which has maintained a large size, many alleles are maintained at microsatellite loci. These alleles will be arrayed along the axis of repeat number and, in general, most allelic states within the range of repeat numbers will be occupied (Garza and Williamson 2001). This means that the range in repeat number can be used as a crude estimate of the number of alleles at a microsatellite locus in a population at equilibrium. If we assume that the individuals who made it through the bottleneck were not selected on the basis of their microsatellite genotype, and that the alleles that survived are a random sample from the allele size distribution, then the range in allele size in the contemporary northern elephant seal population is a crude (but conservative) estimate of the number of alleles present before the bottleneck. We can then apply equilibrium theory derived for the stepwise mutation model, which relates levels of standing variation and mutation rate to the effective population size, Ne (Ohta and Kimura 1973) and estimate pre-bottleneck Ne. For example, for locus PVC74 this gives a pre-bottleneck estimate of 8 alleles (range 209–223bp) and Ne = 4791. Averaged over all loci, this gives an estimate of pre-bottleneck Ne = 1259. The number of alleles estimated in this manner is likely an underestimate since the range in allele size has surely been greatly reduced, in at least some loci, due to the bottleneck. Given that the effective population size is usually much smaller than census size (Crow and Kimura 1970; Mace and Lande 1991; Frankham 1995; Kalinowski and Waples 2002; Palstra and Fraser 2012), and that there is potentially a large variance in male reproductive success in the northern elephant seal (LeBoeuf and Reiter 1988), the pre-bottleneck northern elephant seal population was quite large. The fact that many alleles were present and the calculated effective population size is relatively large is contrary to the interpretation of archaeological data as detailing a prehistoric bottleneck of the entire northern elephant seal species by native peoples on the California Channel Islands (Stewart et al. 1993). It is possible that the archaeological pattern reflects local overexploitation of large pinnipeds and perhaps even local extirpation, but the patterns described here argue against species-wide overexploitation and a prehistoric anthropogenic bottleneck. Rather, the data suggest that the pre-bottleneck northern elephant seal population was richly variable and had not suffered any recent severe bottlenecks.
Very low but significant genetic differentiation was found between several northern elephant seal colonies. In 1922, GI was declared a reserve for the protection of the northern elephant seal (Poder Ejecutivo Federal 1922). From that point on, the species began to increase in population size and geographic distribution. The California Channel Islands were the first breeding colony established in the United States, with breeding first observed at the beginning of the 1950s. Tagging studies indicate that the northernmost colonies were colonized by individuals from the Channel Islands (LeBoeuf and Laws 1994). Therefore, the genetic structure observed between SNI and the northernmost colonies, including PB which is one of the most recent colonies established, could be the result of differences in allele frequencies due to founder effects. In addition, the new mutations may play a role in the observed genetic differentiation reported. Regardless of its origin, it is unlikely the observed genetic differentiation is biologically significant and associated with any adaptive differences (Hedrick 1999). Further evaluation of population-level and genome-wide variation, as well as fitness of resident and migrant breeders, could elucidate the extent to which any of the differentiation observed is temporally stable and associated with local adaptation.
The fact that the northern elephant seal has levels of genetic variability similar to species with population sizes an order of magnitude smaller underscores the severity of the northern elephant seal population bottleneck and confirms that the northern elephant seal is indeed depauperate in nuclear genetic variation. This low variability has hampered previous attempts to use genetic markers to study northern elephant seal biology (Lehman et al. 1993). However, the many microsatellite loci for which we collected data here have much more genetic variation than previously described markers, segregate in a Mendelian manner and are in HWE. This indicates that there is sufficient variation in the northern elephant seal genome, including at these microsatellite loci, to address long-standing questions of parentage, philopatry and migration.
Species that undergo such a substantial loss of genetic variation are generally regarded as having reduced evolutionary potential and ability to present a variable response to parasites and pathogens (Franklin and Frankham 1998). Yet, the northern elephant seal has seen a demographic rebound from near extinction that is unprecedented for a large vertebrate. Although a few other pinniped species have rebounded from large declines (e.g., New Zealand fur seals), the declines were not accompanied by concordant losses of nearly all nuclear genetic variation (Dussex et al. 2016). The northern elephant seal demographic recovery does not seem to have been hindered substantially by mortality due to inbreeding or pathogenic epizootic events, as have been experienced by some other pinnipeds (e.g., Osterhaus et al. 1990; Pastor et al. 2004; Osborne et al. 2015) It is unclear whether this is simply due to fortuitous environmental and exposure conditions in the post-bottleneck period, or whether it is because the reduction in immunogenetic variation of the species was not commensurate with the reduction in other nuclear genetic variation (Garza 1998), as has also been documented in another extremely bottlenecked carnivore (Aguilar et al. 2004). The rapid rate of demographic recovery in the northern elephant seal, along with its location on the extremely remote GI, may have worked in concert to help the species avoid large mortality events that might have threatened the species existence during the perilous early period of recovery. Although the dramatic reduction in genetic variation in northern elephant seals does not appear to have hindered its ability to expand exponentially and recolonize most of its former habitat, we do not here provide any data on fitness or adaptive potential of the species and it is not clear if it remains vulnerable to decline due to genetic factors. However, the species has reestablished demographic stability and geographic heterogeneity and we have documented the regeneration of measurable genetic variation, which may mean that the northern elephant seal has avoided the worst potential effects of the loss of genetic variation due to its near extinction in the 19th century. Future investigation should focus on understanding the contribution of neutral and immunogenetic variation to the continuing demographic success of the northern elephant seal, as well as understanding the mechanisms behind the dramatically different demographic trajectories of pinniped species following population declines.
Supplementary Material
Supplementary data is available at Journal of Heredity online.
Funding
This study was partially funded by National Institutes of Health (GM40282 to M. Slatkin, K02 MH001375 to N.B.F.); NASA Cooperative Agreement (NCC2-1009 to J.C.G.); and by the Marine Mammal Center in Sausalito (A.A-C.).
Data Availability
The microsatellite genotype and allele sequence data for all loci are available in Dryad: doi:10.5061/dryad.7k749.
Acknowledgments
We thank L. Bull, F. Gulland, J. Patton, J. Rine, Y. Schramm, M. Slatkin, and C. Wade for helpful advice and discussions. US samples were collected under the auspices of US Marine Mammal Protection Act research permits 827 and 487–1506 to Hubbs/Sea World Research Institute. Mexican samples were collected under Mexican government permits (Off. No. SGPA/DGVS 8628, Ext. No. DOO.02-0291) to C. García-Aguilar. We thank R. Beas, J. P. Gallo-Reynoso, C. García-Aguilar, F. Gulland, M. Haulena, B. Hatfield, and B. Stewart for assistance with sample collection.
References
Author notes
Address correspondence to John Carlos Garza, Fisheries Ecology Division, Southwest Fisheries Science Center, National Marine Fisheries Service, 110 McAllister Way, Santa Cruz, CA 95060, or e-mail: carlos.garza@noaa.gov.
Corresponding editor: Alfred Roca
