


Objective: To examine changes in patient outcome variables, length of stay (LOS), and mortality after implementation of computerized provider order entry (CPOE).
Materials and Methods: A 5-year retrospective pre-post study evaluated 66 186 patients and 104 153 admissions (49 683 pre-CPOE, 54 470 post-CPOE) at an academic medical center. Generalized linear mixed statistical tests controlled for 17 potential confounders with 2 models per outcome.
Results: After controlling for covariates, CPOE remained a significant statistical predictor of decreased LOS and mortality. LOS decreased by 0.90 days, P < .0001. Mortality decrease varied by model: 1 death per 1000 admissions (pre = 0.006, post = 0.0005, P < .001) or 3 deaths (pre = 0.008, post = 0.005, P < .01). Mortality and LOS decreased in medical and surgical units but increased in intensive care units.
Discussion: This study examined CPOE at multiple levels. Given the inability to randomize CPOE assignment, these results may only be applicable to the local setting. Temporal trends found in this study suggest that hospital-wide implementations may have impacted nursing staff and new residents. Differences in the results were noted at the patient care unit and room levels. These differences may partly explain the mixed results from previous studies.
Conclusion: Controlling for confounders, CPOE implementation remained a statistically significant predictor of LOS and mortality at this site. Mortality appears to be a sensitive outcome indicator with regard to hospital-wide implementations and should be further studied.
INTRODUCTION
Background and significance
Over the last 15 years the Institute of Medicine,1–3 the United States government,4 and others5–11 have examined health care safety and efficiency, including electronic health records (EHRs). Despite these publications, the impact of EHRs on patient outcome measures remains uncertain. This study aims to expand on the previous studies’ understanding of the impact of computerized provider order entry (CPOE) on patient outcomes using commonly referenced measures such as length of stay (LOS) and mortality.
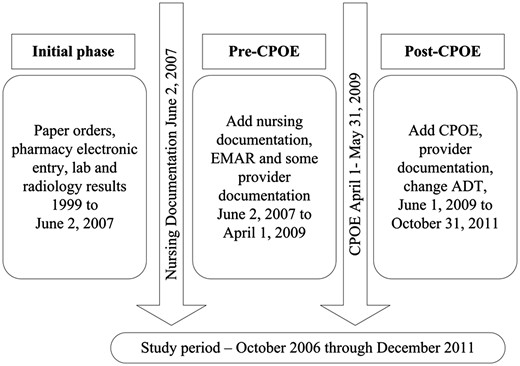
Electronic health record implementation timeline
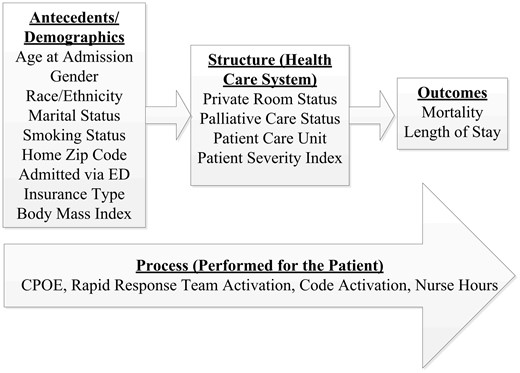
Antecedent, structure, and process variables included in the study
MATERIALS AND METHODS
Design
This 5-year retrospective, pre-post design (2.5 years each) study was conducted at an academic medical center comprising a 450-bed medical and surgical hospital, a 50-bed cancer hospital, and a 90-bed psychiatric hospital. The total sample of 104 153 hospital admissions included 66 188 unique patients. The purpose of this study was to expand upon the existing literature by including additional structure and process covariates while taking advantage of the discrete CPOE implementation within a larger EHR implementation to evaluate the potential impact on mortality and LOS.
Selection criteria
Sampling
Following Institutional Review Board approval, hospital admissions for adult patients 18 years and older admitted for >24 hours with a status of inpatient were included in the study. Labor and delivery visits were excluded from the study because maternal and neonatal mortality are calculated differently.21
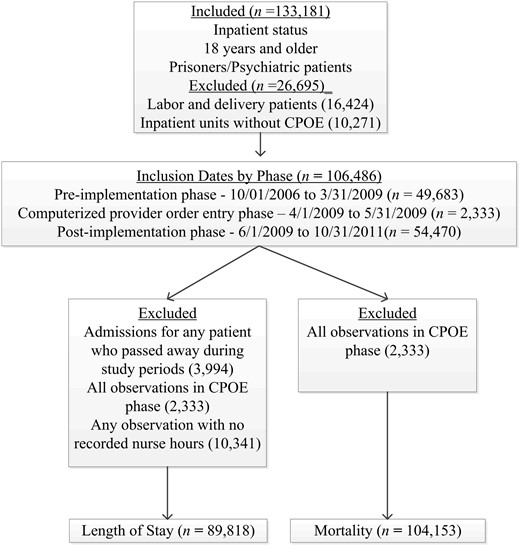
A discrete study observation included an inpatient admission/visit to 1 of 22 distinct patient care units. Visits were included in the pre-CPOE phase if the patient was admitted between October 1, 2006, and March 31, 2009 (n = 49 683). The post-CPOE phase included patient visits between June 1, 2009, and October 31, 2011 (n = 54 470). Both phases were 2.5 years in length. Visits during the CPOE implementation phase (April 1, 2009, through May 31, 2009) were excluded from the analyses (n = 2333) because of a rolling implementation schedule with ongoing changes in process during that phase.
Patients who expired were excluded from the LOS sample, resulting in a final LOS sample size of 89 818 observations and 58 242 patients (Figure 3). The final mortality sample included 104 153 observations comprising 65 113 distinct patients.
Statistical analysis strategy
Traditional statistical analyses were deemed inappropriate for the overall analyses, due to the clustering (nesting) of observations created by patients who had multiple visits. Mixed effects linear modeling procedures that accounted for clustering and other dependence were used for the overall analyses (A.L., G.D.). HPMixed procedure in SAS (v. 9.3) was used for analysis of LOS, a continuous dependent variable. Mortality was assessed with generalized linear mixed procedures in SPSS for Windows (v. 21.0). All variables were entered into the model and removed in a step-wise fashion until only statistically significant (P < .05) variables remained.
Two models were constructed for each dependent variable. The first model evaluated each of the 22 patient care units as a unique unit of analysis. An intermediate step grouped the units by the Centers for Disease Control’s National Healthcare Safety Network (NHSN) classification,22 reducing the number of units to 14. Similar unit types were further recoded as 1 of 5 major patient care unit types: medical/surgical, intensive care, oncology, psychiatry, or rehabilitation.
Due to excessive missing values, outdated documentation policies, and/or changes in coding, body mass index (60% missing) and case mix index (25% missing) were excluded from the final analyses, leaving 15 initial covariates in each beginning model.
RESULTS
Design
The study was designed with patient care unit as the unit of analysis. However, results varied by structure variables (Table 1). Statistically significant decreases occurred in both measures at the facility level. Differences between patient care units were noted when comparing units individually and when similar units were grouped. At the room level, statistically significant differences were found between private and semiprivate rooms for both LOS and mortality.
Structure items and new knowledge gained
| No. | Structure types | Data type | N | Notes | New knowledge |
|---|---|---|---|---|---|
| 1 | Facility | Raw | 3 | General hospital, cancer hospital, psychiatric hospital | Overall trend showed decrease in LOS and mortality. |
| 2 | Unit type (grouped) | Abstracted | 5 | Medical/surgical unit, intensive care unit, psychiatric unit, oncology unit, rehabilitation unit | Differences in LOS and mortality between med/surg and ICU. |
| 3 | Unit type (standard) | Raw | 14 | NHSN mapping resulted in 14 different types of units, too many to compare. | Not evaluated |
| 4 | Unit type (local) | Raw | 22 | Institution-specific patient care units | Unit culture, order set type, end-user training, and patient severity may impact results. |
| 5 | Room | Raw | 350–450 | Increase in number of private rooms in post-implementation phase | Semi vs private showed results contradictory to previous studies.16 |
Sample characteristics
Almost two-thirds (62.5%) of the hospital visits involved unique patients who had a single visit to the hospital. The remaining 37.5% of visits were patients who had multiple visits during the study. Table 2 presents the percentages for each covariate by pre- and post-CPOE phase. Although most of the covariates showed statistical differences between the phases, the strength of association was weak. Cramer’s V was <0.2 for all variables except private room status, which had a value of 0.46, a moderate strength of association.23 Given the very large sample size,24 it was not unexpected that all covariates had a significant P-value. However, these preliminary exploratory analyses supported the decision to use generalized linear mixed models for data analysis.
Sample characteristics by implementation phase
| Covariate | Pre | Post | Total |
|---|---|---|---|
| n (%) | n (%) | n (%) | |
| Gender | |||
| Female | 25 098 (50.56) | 26 106 (47.93) | 51 204 (49.16) |
| Male | 24 584 (49.53) | 28 364 (52.07) | 52 948 (50.84) |
| Race | |||
| White/Caucasian | 36 753 (74.04) | 42 848 (78.66) | 79 601 (76.43) |
| People of color | 2190 (4.41) | 2871 (5.27) | 5061 (4.86) |
| Not reported | 10 740 (21.64) | 8751 (16.07) | 19 491 (18.71) |
| Ethnicity | |||
| Hispanic/Latino | 3143 (6.33) | 3469 (6.37) | 6612 (6.35) |
| Not Hispanic/ not Latino | 30 889 (62.23) | 41 974 (77.06) | 72 863 (69.96) |
| Not reported | 15 651 (31.53) | 9027 (16.57) | 24 678 (23.69) |
| Marital Status | |||
| Married/partnered | 26 732 (53.85) | 28 858 (52.98) | 55 590 (53.37) |
| Single | 12 742 (25.67) | 14 644 (26.88) | 27 386 (26.29) |
| Widowed | 4090 (8.24) | 3948 (7.25) | 8038 (7.72) |
| Divorced/separated | 5456 (10.99) | 6194 (11.37) | 11 650 (11.19) |
| Not reported | 663 (1.34) | 826 (1.52) | 1489 (1.43) |
| Home Zip Code | |||
| UT | 38 145 (76.85) | 42 102 (77.29) | 80 247 (77.05) |
| MT, ID, NV, WY | 7907 (15.93) | 9401 (17.26) | 17 308 (16.62) |
| Other location | 3631 (7.31) | 2967 (5.45) | 6598 (6.33) |
| Smoking | |||
| Yes | 3838 (7.73) | 10 786 (19.8) | 14 624 (14.04) |
| No | 45 845 (92.36) | 43 684 (80.2) | 89 529 (85.96) |
| Admitted Via ED | |||
| Yes | 15 367 (30.96) | 17 505 (32.14) | 32 872 (31.56) |
| No | 34 316 (69.13) | 36 965 (67.86) | 71 281 (68.434) |
| Insurance Type | |||
| Private | 24 762 (49.89) | 24 548 (45.07) | 49 310 (47.34) |
| Government | 379 (0.76) | 1017 (1.87) | 1396 (1.34) |
| Medicaid | 4659 (9.39) | 5430 (9.97) | 10 089 (9.69) |
| Medicare | 16 420 (33.08) | 19 233 (35.31) | 35 653 (34.23) |
| Self-pay | 2995 (6.034) | 3858 (7.08) | 6853 (6.58) |
| Other | 468 (0.94) | 384 (0.7) | 852 (0.82) |
| Room Status | |||
| Private room | 14 074 (28.35) | 37 425 (68.71) | 51 499 (49.45) |
| Semiprivate room | 23 778 (47.9) | 5166 (9.48) | 28 944 (27.79) |
| Not reported | 11 831 (23.83) | 11 879 (21.81) | 23 710 (22.76) |
| Palliative Care Status | |||
| Yes | 838 (1.69) | 2137 (3.92) | 2975 (2.86) |
| No | 48 845 (98.4) | 52 333 (96.08) | 101 178 (97.14) |
| Rapid Response Activated | |||
| Yes | 190 (0.38) | 468 (0.86) | 658 (0.63) |
| No | 49 493 (99.71) | 54 002 (99.14) | 103 495 (99.37) |
| Resuscitation Activated | |||
| Yes | 124 (0.25) | 228 (0.42) | 352 (0.34) |
| No | 49 559 (99.84) | 54 242 (99.58) | 103 801 (99.66) |
| Age | |||
| Mean, median, mode | 50.75, 51, 55 | 52.27, 53, 57 | 51.54, 52, 57 |
| Sample Size | 49 683 | 54 470 | 104 153 |
Totals may not equal 100% due to rounding errors.
All variables significant at P < .0001.
Length of stay
The outcome variable, LOS, was not normally distributed and was therefore transformed to a more normally distributed variable using a Box-Cox nonlinear formula.25 We verified that the transformed data were more normally distributed. All significance tests were run using the approximately normal transformed data. Because of the nonlinear transformation, additivity is not preserved and the transformed results lack a natural metric for interpretation.25,26 To assist with interpretation, results were back-transformed (Table 3) using the inverse Box-Cox formula.
Length of stay and mortality statistical results
| Sample | Length of Stay | Mortality | ||
|---|---|---|---|---|
| 22 units | 5 groups | 22 units | 5 groups | |
| N | 89 818 | 89 818 | 104 153 | 104 152 |
| Pre-estimate | 5.18 | 5.7 | 0.008 | 0.006 |
| Post-estimate | 4.26 | 4.88 | 0.005 | 0.005 |
| Decrease | 0.90 daysa | 0.92 daysa | 3 deaths/1000 admissions | 1 death/1000 admissions |
| P-value | <.0001 | <.0001 | <.001 | <.01 |
| Pre-CI | 3.96-6.99 | 3.32-11.40 | 0.002-0.027 | 0.002-0.095 |
| Post-CI | 3.32-5.61 | 2.92-9.31 | 0.002-0.018 | 0.002-0.081 |
| Random effect | 0.1161 | 0.1183 | 7.472 | 10.22 |
| Variance | 0.1403 | 0.1143 | 2.526 | 7.429 |
aAdditivity not preserved due to Box-Cox transformations.
A total of 89 818 admissions were used in the analyses, pre n = 39 387 (43.9%) and post n = 50 431 (56.1%). The 28% increase in the number of admissions during the post phase was due in part to the addition of hospital rooms.
Two models were created, one based on individual patient care units (Table 1, row 4) and one based on grouped unit types (Table 1, row 2). Twelve variables remained significant predictors of LOS in both models: study phase, age, race, marital status, zip code, insurance type, private room status, smoking status, admitted via ED, palliative care status, code activated, and rapid response team activated. The 3 most significant predictors in both models were study phase (pre- or post-CPOE implementation), room status, and state of residence (Table 2).
When reviewing the results from the facility level, CPOE was found to be a significant predictor of LOS in both models, with a decrease of 0.90 days and 0.92 days (Table 3). The model that aggregated patient care units by type had a wider confidence interval (2.92, 9.31).
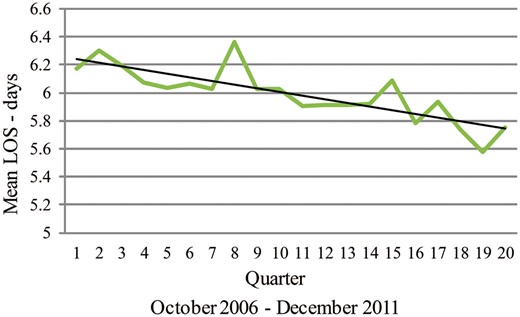
Mean LOS by quarter
Findings at the patient care unit level show that LOS varied by unit type and by individual unit. All psychiatric units had a decrease in LOS, one unit by almost 3 days (Table 4). All medical/surgical units averaged a decrease in LOS, while 4 of 5 intensive care units showed an increase in LOS.
Mean length of stay by patient unit by phase
| Patient Unit | Pre Mean | Post Mean |
|---|---|---|
| Medical/Surgical 1 | 4.91 | 4.06 |
| Medical/Surgical 2 | 6.48 | 5.52 |
| Medical/Surgical 3 | 4.35 | 4.39 |
| Medical/Surgical 4 | 5.55 | 4.93 |
| Medical/Surgical 5 | 4.74 | 4.56 |
| Medical/Surgical 6 | 6.51 | 4.63 |
| Medical/Surgical 7 | 13.89 | 10.91 |
| Medical/Surgical 8 | 5.31 | 4.84 |
| Medical/Surgical 9 | 4.29 | 4.14 |
| Medical/Surgical 10 | 5.4 | 5.29 |
| Intensive Care 1 | 14.07 | 13.85 |
| Intensive Care 2 | 13.3 | 15.03 |
| Intensive Care 3 | 8.31 | 9.95 |
| Intensive Care 4 | 5.01 | 7.17 |
| Intensive Care 5 | 11.82 | 14.29 |
| Psychiatric 1 | 12.53 | 10.56 |
| Psychiatric 2 | 6.92 | 6.62 |
| Psychiatric 3 | 10.2 | 8.93 |
| Psychiatric 4 | 9.9 | 8.72 |
| Psychiatric 5 | 13.29 | 10.42 |
| Psychiatric 6 | 8.6 | 8.2 |
| Rehabilitation 1 | 14.95 | 15.36 |
Mortality
A total of 104 153 admissions were included, pre n = 49 683 and post n = 54 470, representing a 9.6% increase in admissions during the study phase. Covariates remaining in both mortality models as significant predictors of mortality were study phase, age, ethnicity, marital status, insurance type, private room status, and admitted via the ED. Smoking status had a weak influence and was significant only in the model that aggregated units by type. The 5 most significant predictors (Table 5) in the mortality models were study phase (pre- or post-CPOE), room status, admitted via the ED, ethnicity, and age.
F- and P-values for significant predictors in length of stay and mortality models
| Variable | Length of Staya | Mortalitya | ||
|---|---|---|---|---|
| Individual Units | Aggregated Units | Individual Units | Aggregated Units | |
| Sample Size | 89 818 | 89 818 | 104 153 | 104 152 |
| Study phase (F) | 721.33 | 451 | 38.007 | 6.602 |
| Age (F) | Not significant | Not significant | 29.5 | 33.497 |
| Ethnicity (F) | Not significant | Not significant | 36.799 | 11.824 |
| State of residence (F) | 196.97 | 206.24 | Not significant | Not significant |
| Private vs semi room (F) | 3076 | 1904 | 63.304 | 31.713 |
| Admitted via the ED (F) | Not significant | Not significant | 62.695 | 141.675 |
aAll P-values significant at < .0001.
Gender and state of residence were not statistically significant predictors of mortality in either model. Palliative care status, code team activation, and rapid response team activation magnified the results (tripling or quadrupling). During statistical analyses we discovered that these variables acted as intermediate outcomes (mediating variables) and were therefore removed from the analyses.
The number of patient rooms, private rooms, and admissions increased in the post-CPOE phase. Although mortality incidences also increased, from 833 to 955, mortality rate decreased, from 1.78% in the pre-implementation phase to 1.75% in the post-implementation phase. Furthermore, study phase (pre- or post-CPOE) remained a statistically significant predictor of mortality after accounting for confounders. After adjusting for confounders, the model evaluating patient care units individually (Table 3) showed a decrease in mortality of 3 deaths per 1000 observations (n = 54 470), or 162 deaths extrapolated over the study. Similarly, after adjusting for confounders, the model aggregating patient care units by type showed a decrease of 1 death per 1000 visits, or 54 fewer deaths over the 2.5-year post-implementation phase.
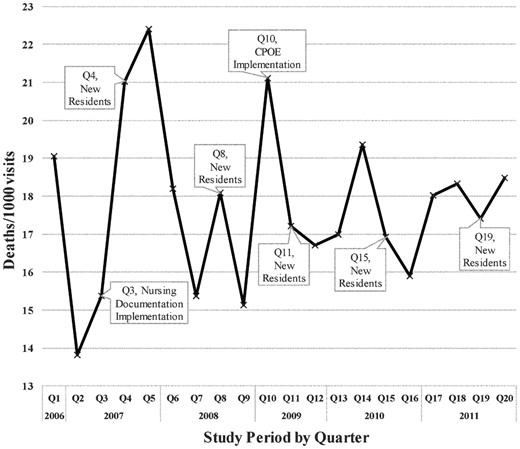
Mortality rate per 1000 visits per fiscal quarter
DISCUSSION
Length of stay
Differences in LOS were associated with structure variables including facility, patient care unit, patient care unit type, and private or semiprivate patient room. At the facility level, LOS was shortened, on average, by almost 1 day. At the patient unit level, fluctuations were noted between patient care units. Differences were also found between private and semiprivate rooms.
The decrease in LOS at the facility level may represent the natural progression as LOS has decreased globally over the last 50 years.27 Changes that could have influenced the trend include better diagnostic tools, an increase in knowledge, changes in insurance billing policies, increased use of minimally invasive procedures, and more appropriate use of home health, rehabilitation, and skilled nursing facilities. While it is likely that the above changes contributed to the decrease in LOS, CPOE was the most significant difference between pre and post phases and thus a contributor to the overall decrease.
Patients assigned a semiprivate room and those who resided in Utah were more likely have a shorter LOS. It is likely out-of-state patients were transferred to this facility because of the severity of their illness, whereas some local patients use this hospital for routine care. Patients assigned to semiprivate rooms going home sooner was an unexpected result, contradictory to common thought and other studies.16 This result may reflect an artifact, because immunocompromised and infectious patients are rarely assigned to semiprivate rooms. Excluding these covariates from the study would have left gaps in the analyses and not exposed a potentially controversial finding, and may in part explain contradictory results from previous studies.
Hypothesized benefits for discharging patients 1 day early include reduced risk of exposure to nosocomial infections, reduced risk of receiving incorrect medications, reduced financial burden on all parties, and increased hospital bed availability. Like previous studies evaluating process change,28,29 CPOE reflects increased efficiency with placing, transmitting, and initiating patient orders, reducing LOS.
It is not possible to control for all the longitudinal changes in care; however, 15 variables were controlled for, supporting the finding that CPOE had an independent, statistically significant impact.
Mortality
Both models in this study showed a statistically significant decrease in mortality, while controlling for multiple confounders. The 5 most significant predictors of mortality were study phase (pre- or post-CPOE), admitted via the ED, room status, age older than 80, and ethnicity (Table 5). Logical associations are expected with admission via the ED and being >80 years old. However, this study discovered anomalous results regarding room status. Semiprivate room status was a predictor of fewer deaths and perhaps represents an artifact of patient assignment based on severity of illness. Ethnicity of not Hispanic/not Latino was associated with fewer deaths. Ethnicity as a predictor may have been related to a mandatory documentation change in the patient registration process during part of the post-CPOE phase, reflecting more accurate recording of this variable, and might not represent care delivered or be related to CPOE implementation.
Statistically significant reductions in mortality were noted at the facility level. Differences were found at the patient unit and room levels, again possibly explaining the results in previous studies.5–11 Most previous studies used a single patient care unit or a limited subset of patient care units.
Most medical/surgical units had reduced mortality rate, while an opposite trend was observed in the ICUs. The results in the med/surg units may be representative of standards of care, in the form of diagnosis- or procedure-specific order sets created by medical content experts for the CPOE implementation. The increase in mortality noted in ICUs may be due to increased patient complexity, complexity that may not have been represented in the original CPOE order sets. These findings suggest the need to control for patient severity indicator in future studies and may help identify why differences occur between unit types. These findings, which make a direct comparison difficult, suggest that the choice of patient care units profoundly influences the findings and may explain the mixed results found in previous studies.5–11
Two very interesting patterns were noted in Figure 5. The first pattern showed that mortality increased in the 3 months immediately preceding both nursing documentation and CPOE implementation (Figure 5). One might consider whether (a) mortality is sensitive to institutional changes and (b) the nursing care is negatively influenced by institution-level changes and/or EHR changes. Many disruptions occur before a large-scale implementation, including shifting floor nurses to a “super-user” role and sending nursing staff to offsite training. Mandatory overtime was also discussed, which must have had nurses anticipating working extra hours and wondering how that would impact their home lives. We know nurses are constantly disrupted30 in their daily work, but we do not know if the added “changeruption” of an upcoming EHR implementation pushes them past their personal cognitive stacking load and ultimately impacts mortality rates. We encourage further exploration of this finding to determine if mortality is a sensitive outcome measure and/or institution-level “changeruptions” impact nursing staff and, ultimately, patient mortality.
The second observed pattern was a decrease in mortality in the post-CPOE implementation phase during the quarter when new physician residents arrived. In the pre-implementation period, mortality increased during these quarters (Figure 5). In the post-implementation period, there was an unexpected decrease in the quarter immediately following CPOE implementation. We speculate that the 350 go-live order sets provided enough structured information to bridge the gap between medical studies and resident experience. Another consideration is the timing of the implementation. The isolated CPOE implementation allowed the institution to focus on physician access, training, and order set updates.
These findings associated with mortality shed light on the mixed results found in previous studies and introduce facets on mortality as an outcome variable. The new results illuminate the need to continue researching EHR implementation, especially if nursing care might be compromised due to institutional changes and new medical trainee care improves.
Strengths and limitations
This study was unique in examining the impact of CPOE on patient outcome measures from the facility, patient unit, and individual patient levels. One of the key strengths is the large sample size, which included 3 hospitals, 22 patient care units, and more than 89 000 observations on over 58 000 patients, which makes it larger than any previous study. The study was also unique in the number of potential confounders used to challenge the association between CPOE and the outcome variables of LOS and mortality. An additional strength is the robust statistical modeling techniques that accounted for clustering, multiple patient visits, and non-normal distributions.
The data for this study were collected from a single academic medical center; other institutions may have different findings. Other studies relied on a variety of study designs and sites used diverse EHR implementation strategies, making it difficult to directly compare the findings. However, the results from this study may partly explain the lack of consistency in previous studies.
Determining if facility- or institution-level changes impact nursing and patient outcomes is worthy of future study. Exploring the potential impact of CPOE on new residents should lead to further order set analysis and could potentially lead to changes in medical training and resident orientation.
This retrospective study did not examine the effects of differences in a patient care unit’s culture, policies and procedures, management style, patient acuity and comorbidities, or training. This study did not account for changes in government regulations and requirements or in insurance policies, or the advancement of medical and nursing sciences. Additionally, changes due to the use of minimally invasive procedures, outpatient surgeries, increased referrals to home health services, skilled nursing facilities, and rehabilitation units were not part of the analysis. Future studies may want to explore the unit effect by including indicators of severity such as the Case Mix Index,31 Apache II32 scores, or the Comprehensive Severity Index.33 Future studies should consider adding 30-day readmissions, deaths occurring within 30 days of discharge, and comparing single-visit patients with multiple-visit patients.
CONCLUSIONS
To our knowledge, this is one of the first studies to evaluate the relationship between CPOE implementation, LOS, and mortality from multiple structural levels. This study generated expected and unexpected results. Statistically significant reductions in both length of stay and mortality were expected and found in the post-CPOE phase. Patient care unit had a differential effect on both length of stay and mortality, and while this was an unexpected result, it is a logical conclusion that may explain conflicting results from previous studies. Unexpected results include an increase in mortality in the 3 months preceding the 2 major implementations, revealing potential “changeruptions” to the nursing staff, and the repeated decrease in mortality in the quarters corresponding to new resident arrival. A third unexpected result is the association noted with semiprivate rooms and decreased LOS and mortality. Although the reduced LOS and mortality could be directly attributed to CPOE, based on a retrospective observational study alone, the results from this study illustrate the need to further explore the impact of CPOE implementation at the hospital system, individual patient care unit, and room levels.
DISCLOSURE
This research received no specific grant from any funding agency in the public, commercial, or not-for-profit sector.
The authors have no competing interests to declare.
ACKNOWLEDGMENTS
The authors would like to thank Chris Brooks and Chris Martineau for their assistance with tables and figures.
AUTHOR CONTRIBUTORS
Conception and study design: A.M.L, K.A.S., V.G.D., J.T., M.A.P.
Acquisition of data: A.M.L., V.G.D.
Analysis and/or interpretation of data: A.M.L., K.A.S., M.A.P., G.W.D., V.G.D., J.T.
Drafting the manuscript: A.M.L., V.G.D., K.A.S., M.A.P., G.W.D.
Revising the manuscript critically for important intellectual content: A.M.L., K.A.S., V.G.D., M.A.P., G.W.D., J.T.
Approval of the version of the manuscript to be published: A.M.L., K.A.S., V.G.D., M.A.P., G.W.D., J.T.
REFERENCES
