


Abstract
Platelet derived growth factor is integral to maintenance of blood brain barrier, increases in response to blood brain barrier disruption, and may reflect neuroinflammation. Based on previous reports of better outcomes with dopaminergic antidepressants in depressed patients with elevated inflammatory biomarkers, we hypothesize that elevated peripheral platelet derived growth factor levels can serve as a powerful biomarker for selecting dopaminergic antidepressants.
Platelet derived growth factor, basic fibroblast growth factor, and granulocyte colony stimulating factor were measured as part of Bioplex Pro human cytokine 27-plex kit in participants of the Combining Medications to Enhance Depression Outcomes trial who provided baseline plasma (n=166) and were treated with either bupropion-plus-escitalopram, escitalopram-plus-placebo, or venlafaxine-plus-mirtazapine. Differential changes in overall symptom severity and anhedonia as well as side effects were tested with a treatment-arm-by-biomarker interaction in mixed model analyses. Effect of biomarkers with significant interaction was calculated in subsequent analyses stratified by treatment arm.
There was a significant treatment-arm-by-platelet derived growth factor interaction for depression severity (P=.03) and anhedonia (P=.008) but not for side effects (P=.44). Higher baseline platelet derived growth factor level was associated with greater reduction in depression severity (effect size=0.71, P=.015) and anhedonia (effect size=0.66, P=.02) in the bupropion- selective serotonin reuptake inhibitor but not the other two treatment arms. There was no significant treatment-arm-by-biomarker interaction for both depression severity and side effects with the other two biomarkers.
As compared with selective serotonin reuptake inhibitor monotherapy or venlafaxine-plus-mirtazapine, bupropion-plus-escitalopram selectively improves anhedonia, which in turn results in improved overall depression severity in depressed patients with elevated platelet derived growth factor levels.
Blood tests of inflammation can improve current “trial and error” based practice of antidepressant selection by personalizing the choice between dopaminergic antidepressants (e.g., bupropion) vs selective serotonin reuptake inhibitor antidepressants (SSRIs). However, the mechanism underlying this differential effect is unclear. We found that higher baseline levels of platelet-derived growth factor (PDGF), a potential marker of inflammation in brain, is associated with greater overall symptomatic (effect size= 0.70) and anhedonia (effect size= 0.66) improvement in depressed patients treated with bupropion-SSRI combination. A similar effect was not seen with SSRI alone or a combination of venlafaxine and mirtazapine. Improvement in anhedonia predominantly accounts for the baseline PDGF-based improvement with bupropion-SSRI combination.
Introduction
Elevated levels of pretreatment biomarkers of peripheral inflammation such as C-reactive protein and interleukin 17 (IL-17) can guide selection of dopaminergic antidepressants over predominantly serotonergic antidepressants (Uher et al., 2014; Jha et al. 2017a; Miller et al., 2017a). Similarly, anti-cytokine therapies have been shown to reduce symptom severity in depressed patients with elevated peripheral inflammation (Raison et al., 2013; Kappelmann et al., 2016). However, biological mechanisms underlying neuroinflammation in depressed patients secondary to peripheral inflammation remain unclear. In fact, it has been postulated that peripheral inflammation may not always result in either neuroinflammation or major depression. In unselected groups of depressed patients, levels of inflammatory biomarkers either do not correlate or correlate modestly with depression severity (Cassidy-Bushrow et al., 2012; Bryleva et al., 2017; Jha et al., 2017b; Köhler-Forsberg et al., 2017). Thus, identifying peripheral markers in blood that reflect neuroinflammation may help with developing novel treatments and could also identify specific subgroups that would require different treatments, thus personalizing the choice of currently available antidepressants.
Among peripheral markers of inflammation, elevated levels of interleukin 6 in depressed patients compared with controls (Dowlati et al., 2010; Haapakoski et al., 2015), even after controlling for obesity (Shelton et al., 2015), has been one of the most consistent findings. Elevated IL-6 promotes production of IL-17 (Dong, 2008). As shown in panel A of Figure 1, IL-17 binds to the endothelial cells of blood brain barrier (BBB) and induces formation of reactive oxygen species (Huppert et al., 2010), which in turn increases the permeability of BBB and facilitates the infiltration of peripheral immune cells into the CNS (Kebir et al., 2007). Elevated stress and peripheral inflammation has also been shown to damage the BBB and facilitate infiltration of monocytes in the CNS (Wohleb et al., 2014). In response to BBB damage, pericytes increase the synthesis of platelet derived growth factor (PDGF) (Arimura et al., 2012). Hence, elevated levels of PDGF in periphery may reflect neuroinflammation as supported by findings that higher levels of PDGF are inversely associated with integrity of myelin sheaths in depressed patients (Benedetti et al., 2016).
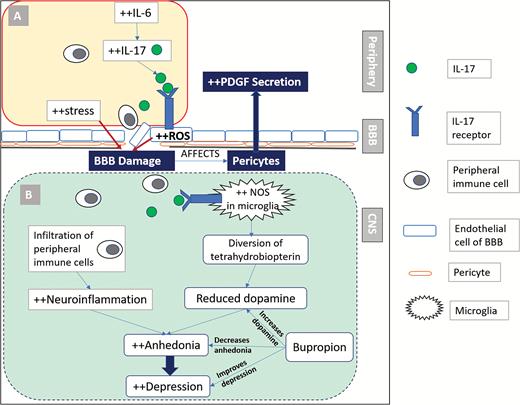
Platelet derived growth factor (PDGF) is a peripheral marker of neuroinflammation, which predicts improved outcomes with bupropion. Elevated interleukin 6 (IL-6) in depressed patients results in increased interleukin 17 (IL-17) levels (A), which binds to the IL-17 receptors on endothelial cells of blood brain barrier (BBB). This results in generation of reactive oxygen species (ROS), which along with stress can lead to BBB damage and infiltration of peripheral immune cells in the CNS. Damage to the BBB has been shown to increase PDGF. Neuroinflammation (B), as reflected by increased PDGF, results in anhedonia, partially through diversion of tetrahydrobiopterin from dopamine synthesis by activation of nitric oxide synthase (NOS) in microglia. Bupropion is a dopaminergic antidepressant that ameliorates anhedonia and may be preferentially effective in depressed patients with elevated PDGF levels.
As shown in panel B of Figure 1, BBB damage results in infiltration of peripheral immune cells as well as IL-17 within the CNS. Microglial cells express IL-17 receptors (Kawanokuchi et al., 2008); binding of IL-17 to microglial receptors induces nitric oxide synthase (NOS) and inflammatory cytokines (Kawanokuchi et al., 2008; Sarma et al., 2009), which in turn leads to reduced synthesis of dopamine by diversion of tetrahydrobiopterin, an essential cofactor of NOS and tyrosine hydroxylase, away from rate limiting step (conversion of tyrosine to L-3,4-dihydroxyphenylalanine) in dopamine synthesis (Miller et al., 2017b). This results in the changes in brain dopamine metabolism (Felger, 2017) as well as the reductions in effort-based motivation for reward in animals (Vichaya et al., 2014). In human beings, inflammation is associated with anhedonia (Eisenberger et al., 2010; Felger et al., 2016; Swardfager et al., 2016), and peripheral inflammation has been shown to reduce the connectivity of corticostriatal reward circuitry in depressed patients (Felger et al., 2016). Administration of dopaminergic drugs results in reversal of anhedonia symptoms in animals exposed to inflammatory cytokines (Felger, 2017; Felger and Treadway, 2017). Similarly, use of bupropion, an antidepressant medication that inhibits dopamine reuptake (Ascher et al., 1995), has been shown to reduce the levels of proinflammatory cytokines (interferon gamma and tumor necrosis factor alpha) after lipopolysaccharide activation in mice (Brustolim et al., 2006). In contrast, administration of SSRIs in rodents has been shown to increase levels of inflammatory cytokines (IL-1beta, IL-6, interferon gamma, and tumor necrosis factor alpha) in the frontal cortex (Warner-Schmidt et al., 2011). In human studies, treatment with SSRIs has been shown to reduce serum IL-6 and IL-1beta levels (Hannestad et al., 2011). In summary, peripheral inflammation can cause BBB disruption/dysfunction, thereby increasing PDGF levels and promoting neuroinflammation. Resultant reduction in CNS dopamine and symptoms of anhedonia can be reversed by administration of dopaminergic drug. Thus, we hypothesize that elevated PDGF can serve as a treatment selection biomarker for dopaminergic antidepressants by identifying depressed patients more likely to experience improvement in anhedonia as well as overall depression severity. This addresses an urgent need to identify moderators of treatment response to improve outcomes (Trivedi, 2013, 2016; Trivedi et al., 2016).
The primary aim of this report is to test the hypothesis that elevated baseline levels of PDGF predict better treatment outcomes with bupropion vs other antidepressant medications. We included other growth factors in this panel, as inflammatory markers have been shown to stimulate release of growth factors (Honorati et al., 2006). Using data from the Combining Medications to Enhance Depression Outcomes (CO-MED) trial, which compared escitalopram plus placebo, bupropion plus escitalopram, and venlafaxine plus mirtazapine treatment arms, we (1) tested for differential treatment outcomes among the 3 treatment arms based on pretreatment PDGF level as well as other growth factors, and (2) evaluated if changes in anhedonia accounted for greater symptomatic improvement in depressed patients with higher PDGF levels.
Methods
Study Overview
Data for this report were obtained from the CO-MED trial, which has been described in detail by Rush et al. (Rush et al., 2011). Participants (n=665) were randomly assigned after stratification for site to the following treatment arms: SSRI monotherapy (escitalopram plus placebo), bupropion-SSRI combination (sustained-release [SR] bupropion plus escitalopram), and venlafaxine-mirtazapine combination (extended-release [XR] venlafaxine plus mirtazapine). The analytic sample of this report includes a subset of CO-MED trial participants who provided plasma samples at baseline. Baseline plasma was collected as part of a separate add-on biomarker study, which was optional and required an additional consent. Hence, all subjects in this report provided a written informed consent for participation in the main trial as well as an additional optional consent for the biomarker collection. Thus, the number of plasma samples (n=166) collected at baseline was a subset of the total number of CO-MED trial participants (n=665). Those participants who did not provide plasma (n=499) at baseline were younger (mean age=44.51 years vs 42.11, P =.03) and had lower use of statin medication (20.5% vs 13.6%, P=.03) compared with the analytic sample of this report but did not differ on any other baseline clinical and sociodemographic features (Jha et al. 2017a). Additionally, as participation in the continuation phase of CO-MED was censured for those participants with inadequate response (Rush et al., 2011), we restricted the analyses only to the acute-phase visits (baseline and weeks 1, 2, 4, 6, 8, 10, and 12). The CO-MED trial used broad inclusion and exclusion criteria (fully listed at https://clinicaltrials.gov/ct2/show/NCT00590863) while recruiting from psychiatric and primary care clinics that were chosen to ensure adequate minority representation and a diverse participant group (Rush et al., 2011). The trial was reviewed and approved by the Institutional Review Boards at UT Southwestern Medical Center at Dallas, the University of Pittsburgh Data Coordinating Center, each participating regional center, and all relevant clinics.
Medications
Participants in all 3 treatment arms received 2 types of pills in single blind fashion (study personnel knew of both pill types, but participants knew only the first pill type). Dosage adjustments were made during the first 8 weeks of participation using principles of measurement-based care, with dose increases permitted only if side effects were tolerable and depression severity was not adequately controlled. Dose escalation regime as well as mean doses of medications in each treatment arm have been previously described in detail by Rush et al. (Rush et al., 2011). Participants in the SSRI monotherapy treatment arm were started on escitalopram at 10 mg/d and placebo was added at week 2 as the second pill type. At the end of 12 weeks, the mean escitalopram dose was 17.6 mg/d and mean placebo dose was 1.4 pills/d. For the bupropion-SSRI combination treatment arm, participants were started on 150 mg of bupropion SR and titrated to 300 mg/d at week 1, and escitalopram 10 mg/d was added as the second pill type at week 2. At the end of 12 weeks, mean bupropion SR dose was 324.0 mg/d and mean escitalopram dose was 14.0 mg/d. Participants in the venlafaxine-mirtazapine treatment arm were started on venlafaxine XR, which was titrated from 37.5 mg/d to 150 mg/d at week 1 visit, and mirtazapine 15 mg/d was added at week 2 as the second pill type. At the end of 12 weeks, the mean venlafaxine XR dose was 207.6 mg/d and mean mirtazapine dose was 25.3 mg/d. Dose adjustments employed measurement-based care principles previously used in large-scale clinical trials (Trivedi et al., 2006b).
Assessments
At baseline, participants provided sociodemographic information. At baseline and all treatment visits, participants filled out the 16-item Quick Inventory of Depressive Symptomatology – Self-Report (QIDS-SR) scale and Frequency, Intensity, and Burden of Side Effect Rating Scale (FIBSER).
QIDS-SR
This commonly used scale has 16 items, each of which includes 4 choices that are scored from 0 to 3. A total score is calculated from 9 of these 16 items (consistent with the 9 criterion symptom domains of major depressive disorder [MDD]) leading to a range of 0 to 27 (Rush et al., 2003). Both measures correlate highly (0.86–0.93) with Hamilton Rating Score for Depression (Rush et al., 2006a). In previous reports, the reported Cronbach’s α of QIDS-SR has ranged from 0.86 to 0.87 (Rush et al., 2003, 2006a; Trivedi et al., 2004). In the CO-MED trial, the QIDS-SR served as the primary depression symptom severity outcome measure.
Inventory of Depressive Symptomatology Clinician Rated (IDS-C)
Of the 30 items of IDS-C (each item has 4 choices which are scored from 0 to 3), 28 items are summed to generate a total score (range 0 to 84), which correlates very highly (Pearson’s moment correlation = 0.95) with the 17-item Hamilton Rating Score for Depression (Rush et al., 1996). In previous reports, the Cronbach’s α of IDS-C has ranged from 0.67 to 0.94 (Rush et al., 1996; Trivedi et al., 2004). Anhedonia, as measured by a subscale of 3 items of IDS-C, has been shown to compare favorably to the Snaith-Hamilton Pleasure Scale (Snaith et al., 1995) and was used as outcome for this report (Felger et al., 2016).
FIBSER
This commonly used side effect rating scale was initially developed to document the frequency, intensity, and burden of side effects in the large (n=4041) multisite Sequenced Treatment Alternatives to Relieve Depression study (Wisniewski et al., 2006). The 3 items of this self-report measure are rated on a scale of 0 to 6, with higher numbers reflecting greater severity of side effects. The Cronbach’s α of FIBSER in Sequenced Treatment Alternatives to Relieve Depression ranged from 0.91 to 0.93 at different study visits (weeks 2, 4, 6, 9, 12, and 14) (Wisniewski et al., 2006). The sum of 3 items has been used as an overall score of FIBSER (Schatzberg et al., 2015).
Measurement of PDGF and Other Growth Factors
Plasma samples extracted from CO-MED trial participants (n=166) were transported overnight to the Biologic Core of National Institute of Mental Health Repository and Genomics Resource (NIMH RGR) for storage at -80°C. All samples for this report were obtained from the NIMH RGR core. Levels of PDGF and other biomarkers were measured in all samples at the same time, blinded to treatment allocation and outcomes by the Microarray Core at UT Southwestern Medical Center using the Bioplex Pro human cytokine standard 27-plex kit (Bio-Rad Laboratories) with a Bio-plex 200 instrument that was equipped with Bio-Plex Manager software, version 6.0 (Bio-Rad Laboratory). This 27-plex kit measures PDGF, FGF-basic, and G-CSF, which were interpreted only if the intra- and inter-assay coefficients of variation were <10% of detection limits (or precision range) specified by manufacturer. The levels of PDGF, FGF-basic, and G-CSF were expressed in pg/mL with correction for 4-fold dilution using the standards provided in the kit (Bio-Rad Laboratory).
Statistical Analyses
We used log-transformation for biomarkers that were not normally distributed. We used separate repeated-measures mixed model analyses with QIDS-SR, anhedonia, and FIBSER total score to test for treatment arm-by-baseline biomarker interaction for PDGF, FGF-basic, and G-CSF after controlling for select baseline covariates (age, gender, and BMI) using methods outlined by Uher et al. (Uher et al., 2014). A significant treatment arm-by-biomarker interaction suggests that the outcomes in 3 treatment arms differed on the basis of baseline biomarker levels. Hence, this was the interaction of interest in our study. When interaction was statistically significant, we used stratified analyses for each treatment arm to quantify the change, including calculation of effect sizes, in outcomes (QIDS-SR, anhedonia, and/or FIBSER) based on biomarker levels, consistent with the approach of Uher et al. (Uher et al., 2014). To visualize the treatment arm-by-biomarker interaction, we plotted the average estimates of dependent variable (QIDS-SR, anhedonia, and/or FIBSER) over the course of acute-phase of CO-MED trial (including baseline) against the baseline plasma biomarker level. To evaluate if changes in anhedonia accounted for greater symptomatic improvement, we included anhedonia score at each available visit as a covariate in the stratified analyses for treatment arm with a significant effect of baseline biomarker. We used SAS version 9.3 for all our analyses and set the threshold of significance at P <.05.
Results
Plasma samples were available from 166 participants who constitute the analytic sample of this report. The mean (SD) concentrations of PDGF, FGF-basic, and G-CSF at baseline were 1630.95 (1249.65) pg/mL, 103.94 (27.39) pg/mL, and 96.98 (29.40) pg/mL, respectively. Participants in all 3 treatment arms did not differ on sociodemographic and clinical variables or biomarkers, except participants in the venlafaxine-mirtazapine combination, who had a significantly lower age, as shown in Table 1.
Sociodemographic Characteristics and Clinical and Biological Markers of CO-MED Trial Participants (n=166) with Plasma Available at Baseline
| SSRI monotherapy | Bupropion-SSRI | Venlafaxine-mirtazapine | ||||||
|---|---|---|---|---|---|---|---|---|
| Number | 51 | 55 | 60 | |||||
| Categorical variables | n | % | n | % | n | % | χ2 (df) | P value |
| Male sex | 16 | 31.4 | 16 | 29.1 | 17 | 28.3 | 0.13 (2) | .94 |
| White race | 27 | 52.9 | 39 | 70.9 | 41 | 68.3 | 4.60 (4) | .29 |
| Hispanic ethnicity | 8 | 15.7 | 7 | 12.7 | 12 | 20 | 1.13 (2) | .57 |
| Income <$2000/month | 26 | 56.5 | 29 | 61.7 | 37 | 64.9 | 1.26 (4) | .87 |
| Education <12 y | 4 | 7.8 | 11 | 20.0 | 9 | 15 | 4.20 (4) | .38 |
| Presence of anxious features | 33 | 64.7 | 43 | 78.2 | 44 | 73.3 | 2.45 (2) | .29 |
| Presence of atypical features | 10 | 19.6 | 12 | 21.8 | 13 | 21.7 | 0.10 (2) | .95 |
| Presence of melancholic features | 14 | 27.5 | 17 | 30.9 | 20 | 33.3 | 0.45 (2) | .80 |
| Presence of suicidal ideation | 27 | 52.9 | 31 | 56.4 | 36 | 60.0 | 0.56 (2) | .76 |
| Depression onset before age 18 | 18 | 35.3 | 24 | 43.6 | 25 | 41.7 | 0.83 (2) | .66 |
| Continuous variables | Mean | SD | Mean | SD | Mean | SD | F value (df) | P value |
| Age in years | 47.0 | 11.8 | 46.3 | 12.1 | 40.8 | 11.2 | 4.92 (2) | .01 |
| QIDS-SR | 15.7 | 3.4 | 15.0 | 4.7 | 16.0 | 4.1 | 0.97 (2) | .38 |
| Anhedonia (from IDS-C) | 5.4 | 2.0 | 5.3 | 2.2 | 5.7 | 2.0 | 0.63 (2) | .53 |
| Log of PDGF in pg/mL | 7.1 | 0.8 | 7.2 | 0.7 | 7.1 | 0.7 | 0.37 (2) | .69 |
| FGF-basic (pg/mL) | 103.6 | 30.5 | 108.4 | 22.4 | 100.2 | 28.6 | 1.31 (2) | .27 |
| Log of G-CSF in pg/mL | 4.6 | 0.3 | 4.6 | 0.3 | 4.5 | 0.3 | 0.97 (2) | .38 |
Abbreviations: bupropion-SSRI, combination of sustained-release bupropion plus escitalopram; CO-MED, Combining Medications to Enhance Depression Outcomes; FGF, fibroblast growth factor; G-CSF, granulocyte colony stimulating factor; IDS-C, Inventory of Depressive Symptomatology Clinician-rated; PDGF, platelet derived growth factor; QIDS-SR, Quick Inventory of Depressive Symptomatology Self-Report; SSRI monotherapy, escitalopram plus placebo; venlafaxine-mirtazapine, combination of extended-release venlafaxine plus mirtazapine.
In separate mixed-model analyses for QIDS-SR, anhedonia, and FIBSER, we found that PDGF had a significant treatment-arm-by-biomarker interaction for QIDS-SR (F=3.50, df=2, 157, P=.033) and anhedonia (F=4.95, df=2, 157, P=.008) (also see Table 2).
Moderating Effects of PDGF and Other Growth Factors on Overall Depression Severity, Anhedonia, and Side Effects in CO-MED Trial
| Depression severity* | Anhedonia* | Side effects* | |||||||
|---|---|---|---|---|---|---|---|---|---|
| F | df | P | F | df | P | F | df | P | |
| PDGF | |||||||||
| Treatment arm | 3.36 | 2, 157 | .037 | 4.79 | 2, 157 | .01 | 0.60 | 2, 148 | .55 |
| Log of baseline PDGF level | 0.81 | 1, 157 | .37 | 0.09 | 1, 157 | .77 | 2.71 | 1, 148 | .10 |
| Log-PDGF-by-treatment arm interaction | 3.50 | 2, 157 | .033 | 4.95 | 2, 157 | .008 | 0.83 | 2, 148 | .44 |
| FGF-basic | |||||||||
| Treatment arm | 0.89 | 2, 157 | .41 | 1.25 | 2, 157 | .29 | 0.83 | 2, 148 | .44 |
| Baseline FGF-basic level | 0.03 | 1, 157 | .86 | 1.22 | 1, 157 | .27 | 1.32 | 1, 148 | .25 |
| FGF-basic-by-treatment arm interaction | 1.22 | 2, 157 | .30 | 1.09 | 2, 157 | .34 | 0.78 | 2, 148 | .46 |
| G-CSF | |||||||||
| Treatment arm | 0.52 | 2, 157 | .60 | 1.38 | 2, 157 | .25 | 1.82 | 2, 148 | .17 |
| Log of baseline G-CSF level | 1.24 | 1, 157 | .27 | 10.02 | 1, 157 | .002 | 0.40 | 1, 148 | .53 |
| Log-G-CSF-by-treatment arm interaction | 0.53 | 2, 157 | .59 | 1.13 | 2, 157 | .33 | 2.21 | 2, 148 | .11 |
Abbreviations: CO-MED, Combining Medications to Enhance Depression Outcomes; F, F value from the mixed model analyses; FIBSER, Frequency, Intensity, and Burden of Side Effects Rating Scale; FGF, fibroblast growth factor; G-CSF, granulocyte colony stimulating factor; IDS-C, Inventory of Depressive Symptomatology Clinician-rated; PDGF, platelet derived growth factor; QIDS-SR, Quick Inventory of Depressive Symptomatology Self-Report.
Anhedonia was measured by the 3-item anhedonia-subscale of the IDS-C and FIBSER.
Treatment arms include: escitalopram plus placebo, combination of sustained-release bupropion plus escitalopram, and combination of extended-release venlafaxine plus mirtazapine.
* Gender, age, BMI, visit, and visit-by-treatment arm interaction were covariates in all mixed model analyses.
In subsequent analyses stratified by treatment arm, we found that higher log of PDGF levels at baseline predicted lower depression severity over the course of acute-phase treatment only in bupropion-SSRI combination treatment arm (Cohen’s d effect size=0.70, est.= -1.86, SE= 0.73, P=.015) and not in SSRI monotherapy (Cohen’s d effect size=0.04, est.= 0.10, SE=0.73, P=.89) or venlafaxine-mirtazapine combination treatment arm (Cohen’s d effect size=0.03, est. =0.08, SE=0.76, P=.91) (also see Table 3). As shown in Figure 2, we found that QIDS-SR (averaged over acute-phase including baseline) decreased with increasing levels of PDGF at baseline in bupropion-SSRI combination (correlation coefficient = -0.66) but not in SSRI monotherapy (correlation coefficient = 0.08) and venlafaxine-mirtazapine combination (correlation coefficient = 0.17) treatment arms.
Differential Effect of Platelet-Derived Growth Factor (PDGF) on Depression Severity and Anhedonia Based on Treatment Arm in CO-MED Trial
| Estimate* | SE | F value | df | Effect size | P Value | |
|---|---|---|---|---|---|---|
| Depression severity | ||||||
| SSRI monotherapy | 0.10 | 0.73 | 0.02 | 1, 46 | 0.04 | .89 |
| Bupropion-SSRI | -1.86 | 0.73 | 6.37 | 1, 50 | 0.70 | .015 |
| Venlafaxine-mirtazapine | 0.08 | 0.76 | 0.01 | 1, 55 | 0.03 | .91 |
| Anhedonia | ||||||
| SSRI monotherapy | 0.72 | 0.37 | 3.87 | 1, 46 | 0.57 | .06 |
| Bupropion-SSRI | -0.71 | 0.30 | 5.62 | 1, 50 | 0.66 | .02 |
| Venlafaxine-mirtazapine | 0.10 | 0.34 | 0.08 | 1, 55 | 0.08 | .78 |
Abbreviations: bupropion-SSRI, combination of sustained-release bupropion plus escitalopram; CO-MED, Combining Medications to Enhance Depression Outcomes; SSRI monotherapy, escitalopram plus placebo; venlafaxine-mirtazapine, combination of extended-release venlafaxine plus mirtazapine.
Estimate obtained from solution for fixed effects in mixed model analyses and represents the estimated difference in self-reported depression severity as measured by Quick Inventory of Depressive Symptomatology Self-Report (QIDS-SR) and anhedonia as measured by the 3-item anhedonia-subscale of the Inventory of Depressive Symptomatology Clinician-rated (IDS-C) for 1 unit difference in log of PGDF in each treatment arm.
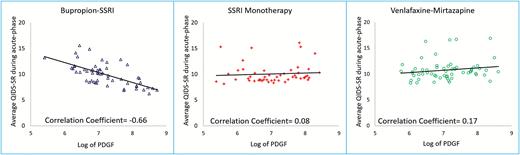
Depression severity during acute-phase of Combining Medications to Enhance Depression Outcomes (CO-MED) trial based on baseline plasma platelet derived growth factor (PDGF) level. Average Quick Inventory of Depressive Symptomatology – Self-Report (QIDS-SR) was obtained from mixed model analyses of all available visits (least square means) during the acute-phase of CO-MED trial for the following three treatment arms: selective serotonin reuptake inhibitor (SSRI) monotherapy, bupropion-SSRI combination, and venlafaxine-mirtazapine combination. PDGF is platelet-derived growth factor.
In stratified analyses of change in anhedonia based on PDGF levels, we found that higher levels at baseline predicted lower severity of anhedonia over the course of acute phase with bupropion-SSRI combination (Cohen’s d effect size=0.66, P=.015) but not with SSRI monotherapy (Cohen’s d effect size=0.57, P=.06) or venlafaxine-mirtazapine combination (Cohen’s d effect size=0.08, P=.78) treatment arms (also see Table 3). As shown in Figure 3, we found that higher baseline levels of PDGF were associated with lower severity of anhedonia (averaged over acute-phase including baseline) with bupropion-SSRI combination (correlation coefficient= -0.57). Conversely, higher baseline PDGF levels were associated with smaller reductions in anhedonia with SSRI monotherapy (correlation coefficient of anhedonia averaged during acute-phase and log of PDGF= 0.52) and venlafaxine-mirtazapine (correlation coefficient of anhedonia averaged during acute-phase and log of PDGF= 0.24).
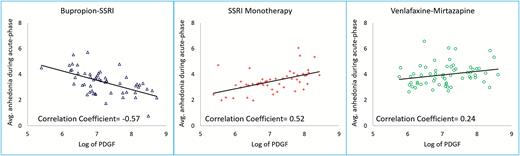
Severity of anhedonia during acute-phase of Combining Medications to Enhance Depression Outcomes (CO-MED) trial based on baseline plasma platelet derived growth factor (PDGF) level. Average score of anhedonia subscale of Inventory of Depressive Symptomatology Clinician Rated (IDS-C) was obtained from mixed model analyses of all available visits (least square means) during the acute-phase of CO-MED trial for the following three treatment arms: selective serotonin reuptake inhibitor (SSRI) monotherapy, bupropion-SSRI combination, and venlafaxine-mirtazapine combination.
We included anhedonia scores at each visit as a covariate to evaluate if improvement in anhedonia accounted for improvement in depression severity in the bupropion-SSRI treatment arm, and found that change in depression severity with one unit increase in log of PDGF at baseline was no longer statistically significant (Cohen’s d effect size=0.52, est.= -1.17, SE=0.63, F=3.49, df=1, 50, P=.07) after controlling for anhedonia.
Discussion
We have for the first time found in a large sample of depressed patients that elevated levels of PDGF at baseline were selectively associated with greater reduction in overall depression severity and anhedonia with bupropion-SSRI combination treatment, but not in those treated with SSRI monotherapy or venlafaxine-mirtazapine combination. We also found that improvement of anhedonia accounted for the baseline PDGF-based improvement in depression severity with bupropion-SSRI. To our knowledge, this is the first study evaluating the moderator effect of baseline levels of PDGF on antidepressant treatment outcomes.
Our findings are consistent with the potential role of drugs modulating dopaminergic neurotransmission in treatment of depression with an exciting application of using pramipexole, a dopamine receptor agonist which was reportedly effective in a recent case series of treatment resistant depression patients (Fawcett et al., 2016). Thus, the findings of this study have immediate application for clinical practice. Our findings also have significant implications for research as we attempt to understand the precise mechanism of how neuroinflammation causes depression and how best to modify treatment in those presenting with neuroinflammation. With initial antidepressant treatment, over two-thirds of MDD patients continue to have significant depressive symptoms (Rush et al., 2006b, 200bc; Trivedi et al., 2006a, 2006b). No clinical variables (such as baseline depression severity, atypical features, melancholic features, and obesity) or reliable and valid biomarkers (including imaging and electrophysiological markers) have proven to be useful in identifying subgroups of MDD patients who will respond differently to currently available antidepressant medications (Rush et al., 2011; Arnow et al., 2015). Hence, our findings address the urgent need to identify biological markers at baseline that can facilitate selection amongst currently available antidepressant treatments (Toups and Trivedi, 2012).
Our study has several limitations. This is a secondary analysis of participants in the CO-MED trial. As identifying biological markers as moderators of treatment outcome was not the primary outcome of the CO-MED trial, we did not a priori test the power needed to detect moderator effects of PDGF. However, the moderator effect sizes in our study are large (Cohen’s d > 0.5) (Cohen, 1988) and compare favorably with the moderator effect size for treatment selection in previous studies (Wallace et al., 2013, 2017). Additionally, the immune system is a complex interplay of multiple factors and therefore, reverse translation through animal models will be necessary to confirm these findings. Apathy, or lack of motivation, may occur in depressed patients taking SSRIs such as escitalopram (FDA, 2017) and reportedly improves with bupropion treatment (Corcoran et al., 2004). Apathy significantly correlates with anhedonia (Ang et al., 2017) and is described in context of social inactivity in depressed patients (Marin, 1990). Lack of systematic evaluation of SSRI-emergent apathy or changes in apathy with treatment is another limitation of this report. Further, as the CO-MED trial permitted dose adjustment of antidepressant medications per MBC guidelines, it is uncertain as to how these dose adjustments affected the differential treatment response based on baseline PDGF levels. In light of these limitations, findings from this study should be considered preliminary and need replication and extension. Additionally, by design in the CO-MED trial, each treatment arm contained a medication with serotonergic activity that could restrict the interpretation of these findings specifically to bupropion.
In conclusion, in our study, we found strong evidence for the first time that elevated levels of PDGF are selectively associated with better clinical outcomes, mediated predominantly by anhedonia improvement, in depressed patients treated with a combination of bupropion and escitalopram compared with those treated with either escitalopram monotherapy or a combination of venlafaxine and mirtazapine.
Statement of Interest
Drs Jha, Minhajuddin, and Gadad have no potential conflicts of interest. Dr Trivedi is or has been an advisor/consultant and received fees from: Alkermes, AstraZeneca, Cerecor, Eli Lilly & Company, Lundbeck, Naurex, Neuronetics, Otsuka Pharmaceuticals, Pamlab, Pfizer Inc., SHIRE Development, and Takeda. In addition, he has received grants/research support from National Institute of Mental Health and National Institute on Drug Abuse.
Acknowledgments
The authors thank the clinical staff at each clinical site for their assistance with this project, all the study participants, and Jennifer Furman, PhD, for administrative support.
This work was supported by the National Institute of Mental Health (N01 MH-90003 to M. H. Trivedi and A. J. Rush). This work was also supported in part through the Center for Depression Research and Clinical Care at UT Southwestern (principal investigator: Madhukar H. Trivedi, MD), The Hersh Foundation, and The Jordan Harris Foundation. Forest Pharmaceuticals, GlaxoSmithKline, Organon, and Wyeth Pharmaceuticals provided medications for CO-MED trial at no cost. The content of this publication does not necessarily reflect the views or policies of the U.S. Department of Health and Human Services, nor does mention of trade names, commercial products, or organizations imply endorsement by the U.S. government. NIMH had no role in the drafting or review of the manuscript or in the collection or analysis of the data.
References
