


Abstract
Background The study investigated differences in lung cancer mortality risk between social classes.
Methods Twenty years of mortality follow-up were analysed in 7052 men and 8354 women from the Renfrew/Paisley general population study and 4021 working men from the Collaborative study.
Results More manual than non-manual men and women smoked, reported morning phlegm, had worse lung function and lived in more deprived areas. Lung cancer mortality rates were higher in manual than non-manual men and women. Significantly higher lung cancer mortality risks were seen for manual compared to non-manual workers when adjusting for age only and adjustment for smoking reduced these risks to 1.41 (95% CI : 1.12–1.77) for men in the Renfrew/Paisley study, 1.28 (95% CI : 0.94–1.75) for women in the Renfrew/Paisley study and 1.43 (95% CI : 1.02–2.01) for men in the Collaborative study. Adjustment for lung function, phlegm and deprivation category attenuated the risks which were of borderline significance for men in the Renfrew/Paisley study and non significant for women in the Renfrew/Paisley study and men in the Collaborative study. Adding extra socioeconomic variables, available in the Collaborative study only, reduced the difference between the manual and non-manual social classes completely.
Conclusions There is a difference in lung cancer risk between social classes, in addition to the effect of smoking. This can be explained by poor lung health, deprivation and poor socioeconomic conditions throughout life. As well as anti-smoking measures, reducing socioeconomic inequalities and targeting individuals with poor lung function for help with smoking cessation could help reduce future lung cancer incidence and mortality.
It is now well established that cigarette smoking is the main cause of lung cancer.1,2 What is still unclear is why the West of Scotland has among the highest lung cancer incidence rates in the world.3 This observation can only be partially explained by the levels of cigarette smoking in the local population. Comparison of a prospective cohort study representative of the West of Scotland with other cohort studies (UK doctors, US veterans and American Cancer Society Volunteers) showed higher rates of lung cancer mortality in the West of Scotland at each level of cigarette consumption.4 Studies from outside the UK have demonstrated the existence of social inequalities in the risk of lung cancer.5–9 Part of this has been shown to be due to different smoking habits between the social classes (such as amount smoked and inhalation), but a difference still remains. Two large prospective cohort studies from the West of Scotland with 20 years of mortality follow-up were analysed to understand which additional factors may contribute to the different risk of lung cancer mortality between social classes. Together they contained over 19 000 middle-aged men and women with information on risk factors at initial examination, including smoking habit and social class. The inclusion of a large cohort of UK women in this analysis is an important addition to the literature, particularly since lung cancer mortality in women is increasing.10,11
Methods
The two prospective cohort studies analysed in this study were:
the Renfrew/Paisley study, a population-based cohort from two adjacent urban burghs, considered to be typical of the West of Scotland, screened between 1972 and 1976.12–14 Men and women aged between 45 and 64 and identified by a door-to-door census as living in Renfrew and Paisley were invited to take part. The response rate was 80%.
the Collaborative study of workers employed in various public and private sector organisations in the Central Clydeside conurbation in the West of Scotland, screened between 1970 and 1973.15 Response rates were available for workplaces from which 87% of the sample was recruited. For these sites, 70% of those invited took part.
Figure 1 shows the location of the studies.
The analysis included participants aged 45–64 years at the time of screening (the ages common to both studies). There were 7052 men and 8354 women in the Renfrew/Paisley study and 4021 men in the Collaborative study. Women from the Collaborative study were excluded from this analysis as the numbers were too small.
Participants completed a questionnaire which included a self-reported smoking history. Questionnaires were checked when the participant attended a clinic where physical measurements were taken. Smoking categories were defined by the following exposure groupings: never smoked, 1–14, 15–24, ≥25 cigarettes per day, pipe or cigar smoker only and ex-smoker. Ex-smokers were additionally defined by the amount they formerly smoked: 1–14, 15–24 and ≥25 cigarettes per day. The duration of smoking was calculated as the years from starting smoking to the screening examination for current smokers, and the years between starting and stopping smoking for the ex-smokers. Participants were also asked if they inhaled.
Social class was defined by the Registrar General's classification16 based on occupation at the time of screening. In the Renfrew/ Paisley study participants were asked their usual occupation and, if retired, their last full time occupation. Women were given their own occupation except for housewives who were given their husband's or father's occupation. Participants were classified as non-manual if they were in social classes I, II or III(non-manual) and manual when in social classes III(manual), IV, or V. Participants with missing social class or smoking data were excluded, leaving 6972 men and 7998 women in the Renfrew/Paisley study, and 4007 men in the Collaborative study available for the analysis.
Occasional phlegm was defined as a positive answer to a question on usually bringing up phlegm from the chest in the morning in winter.17 If it was also present for 3 months in the winter each year, it was defined as persistent phlegm. If additionally a period of increased cough and phlegm lasting for ≥3 weeks in the previous 3 years was reported, it was defined as infective phlegm.
The forced expiratory volume in one second (FEV1) was measured at the screening examination using a vitalograph spirometer with the subject standing. The FEV1 score was calculated by obtaining the expected FEV1 from a linear regression equation of age and height for each study, derived from a healthy subset of the population who had never smoked and answered no to questions on phlegm, breathlessness, wheezy or whistling chest and if the weather affected breathing.14,15 The regression equations were:
The FEV1 score was defined as the actual FEV1 as a percentage of the expected FEV1.
The home address at the time of screening was retrospectively postcoded, enabling deprivation category as defined by Carstairs and Morris to be ascertained.18 Deprivation category varies from 1 (least deprived) to 7 (most deprived) and is based on four census variables—male unemployment, overcrowding, car ownership and the proportion in social classes IV and V.
In the Collaborative study only, additional socioeconomic variables were available. These were father's social class19 and social class at entry to the workforce,20 number of siblings, years of education15 and whether a regular car driver.15
Study participants were flagged at the National Health Service Central Register in Edinburgh. A 20-year follow-up period was taken for all participants. In this time 441 men and 176 women in the Renfrew/Paisley study, and 150 men in the Collaborative study died of lung cancer.
Age-adjusted mortality rates were calculated using a life-table approach and were standardized by 5-year age groups using the age distribution of the Renfrew/Paisley cohort as the standard. Cox's Proportional Hazards regression models21 were used to calculate relative risks (RR) of mortality for manual social classes compared to non-manual. Adjustment for other variables was made by entering them into the model simultaneously. Age, FEV1 score, deprivation category, father's social class, social class at entry to the workforce and siblings were treated as continuous variables. Education and car driver were treated as categorical variables. Adjustment for smoking was made by entering it as the eight smoking categories, years of smoking as a continuous variable and inhalation as a categorical variable. Adjustment for phlegm was made by entering it as four categories.
Age-adjusted means were calculated using PROC GLM of the SAS system22 and tests for differences between social classes for continuous variables were calculated using t-tests. Age-adjusted proportions were calculated by the direct method using the age distribution of the Renfrew/Paisley cohort as the standard. Tests for differences between social classes for discrete variables were calculated using χ2 tests.
Results
The social class composition of the studies was different (Table 1). In the Renfrew/Paisley study, only 31% of men were in non-manual social classes, whereas in the Collaborative study 48% of men were in non-manual social classes. Forty-three per cent of women in the Renfrew/Paisley study were in non-manual social classes. In all three studies there were significantly more participants who had never smoked in the non-manual than the manual social classes. There were more current smokers in the manual social classes. More non-manual than manual men and women were ex-smokers. The majority of current smokers reported inhaling, but there was no significant difference between manual and non-manual social classes except in men from the Renfrew/Paisley study, where significantly more manual men inhaled. Reporting of phlegm, particularly infective phlegm, was higher in men and women in manual social classes. Significantly more manual workers lived in deprived areas in each study. Other socioeconomic variables were available for the Collaborative study only—less manual workers were regular car users, and more manual workers had fathers in manual social classes, had a manual first regular occupation and left full-time education early. Also, manual workers had significantly more siblings.
Of the current smokers, manual workers had been smoking for longer than non-manual workers in each study, but for ex-smokers this was seen only in men from the Renfrew/Paisley study. Lung function as measured by FEV1 score was significantly worse in manual workers than non-manual workers.
Age-adjusted lung cancer mortality rates by smoking category, classified as never, current or former, are shown for each study in Table 2. Mortality rates were higher in men from the Renfrew/Paisley study than men from the Collaborative study and lowest in women from the Renfrew/Paisley study. Rates were highest for current smokers in all three studies, whilst former smokers had rates between those for never and current smokers. This was also seen for non-manual and manual categories separately. For each smoking category, the mortality rate was higher for manual workers than for non-manual workers (except for former smokers in the Collaborative study).
The RR of lung cancer mortality was calculated for manual workers compared to non-manual workers in each study separately (Table 3). There was a significantly higher risk for manual workers when adjusting for age only (1.75 [95% CI : 1.40–2.20] for men in the Renfrew/Paisley study, 1.48, [95% CI : 1.09–2.02] for women in the Renfrew/Paisley study and 1.73 [95% CI : 1.24–2.42] for men in the Collaborative study). Additional adjustment for smoking reduced the risks substantially, but they still remained statistically significant for the men, however they became non-significant for the women. Further adjustment for FEV1 score and phlegm attenuated the risks which were still significant for men in the Renfrew/ Paisley study and became non-significant in the Collaborative study. For the men, further adjustment for deprivation category reduced the risk. Adding the extra socioeconomic variables (car user, father's social class, social class at entry to the workforce, siblings and education), which were available in the Collaborative study only, reduced the difference between the manual and non-manual social classes completely.
Discussion
This analysis has confirmed the social class difference in lung cancer mortality seen, but not completely explained, in other studies5–9 and identified markers which accounted for this difference by adjusting for a range of available risk factors. The studies were located in the West of Scotland, with one being a general population study of men and women, and the other a study of employed men. Their social class composition was different, with more manual than non-manual men and women in the Renfrew/Paisley study and with equal numbers of non-manual and manual men in the Collaborative study. Lung cancer mortality rates were higher in men from the Renfrew/Paisley study than the Collaborative study for each smoking category, and this may be partially explained by the larger number of manual men in the Renfrew/Paisley study. Each study considered separately had higher rates of lung cancer mortality for manual than non-manual participants by smoking category. The higher prevalence of cigarette smoking amongst manual men and women clearly contributes to their higher rates of lung cancer. However, the analysis suggests that smoking provides only a partial explanation, although the possibility of residual confounding due to measurement error in smoking history data or to unmeasured aspects of cigarette smoking cannot be ruled out.23
The difference in lung cancer mortality risk between social classes was very similar in the two male cohorts (Table 3). This suggests that the ‘healthy worker effect’ which will apply to the Collaborative study is not influencing the risk difference between the manual and non-manual men. After adjusting for risk factors available in both studies the RR were 1.27 (95% CI : 1.00–1.61) in the Renfrew/Paisley study and 1.24 (95% CI : 0.86–1.79) in the Collaborative study. The risk factors were smoking, including the amount smoked, duration of smoking and inhalation, lung function as measured by FEV1 score (which has been shown to be strongly associated with lung cancer mortality risk14), phlegm and deprivation category (which makes a contribution to mortality risk independent of social class and can be considered an indicator of material well-being24). This was reduced further to 1.03 (95% CI : 0.68–1.57) in the Collaborative study when other socioeconomic variables were included in the model (car usage, which can also be considered an indicator of material well-being,25 and father's social class, social class at entry to the workforce, number of siblings and education, which are all indicators of early life conditions), showing that there was no longer any difference between non-manual and manual social classes. Early life socioeconomic conditions and lifetime material well-being may thus have contributed to susceptibility to lung cancer, in addition to smoking and other lung problems. Adverse social circumstances in early life seem to be less important with respect to lung cancer than several other important causes of death however.19
The difference in lung cancer risk between manual and non-manual women was smaller than in the male cohorts and became non-significant once adjustments were made for smoking. This smaller difference could be due to difficulties in assigning the correct social class to women. Women's lung cancer rates are substantially lower than men's (Table 2).3
Other risk factors which were not measured in these studies have been shown to be related to lung cancer risk. It has been suggested that low consumption of fruit and vegetables and the consequent low level of essential antioxidants, particularly β-carotene and vitamins A and C, may be associated with increased risk of lung cancer.26 The Zutphen study in the Netherlands found that men with low stable intakes of fruit, vegetables and β-carotene had twofold increased RR for lung cancer over men with high stable intakes, after adjusting for smoking.27 A study of dietary supplementation of vitamin E and β-carotene in male smokers, however, found no reduction in lung cancer incidence. In fact, an increase in lung cancer risk was seen in groups taking β-carotene.28 Unfortunately, no dietary information was collected in the current studies, but lower levels of intake of antioxidant vitamins were found in manual compared to non-manual participants of the Scottish Heart Health Study (a study of men and women aged 40–59 years from 22 Scottish districts surveyed in 1984–1986) and manual participants consumed fresh fruit and green vegetables less frequently than non-manual partcipants.29,30 It is possible that differences in lung cancer risk between social classes could be due to the poorer diet of lower social class groups. Van Loon et al found a positive association between intake of vitamin C and retinol with level of education in a large study from the Netherlands.9 They found an inverse association between lung cancer risk and highest level of education and this persisted after adjusting for smoking and dietary information. It is possible that diet is a marker for poor socioeconomic conditions for which other measures such as FEV1, phlegm and deprivation category have been used in the current study, or there may be a real protective effect of diet on the development of a lung cancer.
Occupational exposure and environmental pollution have been suggested as possible factors in the risk of lung cancer. A study in Denmark found that outdoor pollution was not the explanation for the twofold difference in lung cancer between Copenhagen and rural Denmark—it could be explained by smoking, occupation, type of dwelling and marital status.7 However, a study from Northeast England found an association between lung cancer mortality and proximity to industry in women, which could not be explained by smoking, occupation, socioeconomic factors or artifact, suggesting a role of industrial air pollution.31 Van Loon et al studied the role of occupational exposure in the socioeconomic difference in lung cancer risk in men in the Netherlands32. They found that occupational exposure to asbestos, paint dust, polycyclic aromatic hydrocarbons and welding fumes could not explain the inverse association between socioeconomic status, as measured by education and by occupation, and lung cancer risk. Inhalation of radon gas has also been suggested as a risk factor for lung cancer.33
The Copenhagen Male Study found that social class differences in lung cancer risk could be partially explained by comprehensive adjustment for smoking which included form of smoking, amount smoked, inhalation and pack years.5 The RR of the lowest social class (unskilled workers) compared to the highest (highly educated and administrators) was statistically significant after adjustment for smoking (2.9, 95% CI : 1.5–5.9). They also investigated occupational exposure to dust and fumes but found it could not explain the social class differences. They suggested that the remaining social class differences could be due to differences in vulnerability which may be caused by exposures early or later in life. The current study has been able to use other risk factors and socioeconomic factors to explain the difference in lung cancer risk between social classes in addition to smoking. The difference was explained by poor lung function, lung disease as defined by phlegm production and deprivation category of residence which itself can be considered a marker for several socioeconomic factors, for example poor quality housing. Additional early life socioeconomic indicators, amount of education and regular use of a car were remaining factors (available in the Collaborative study only), which seemed to explain the difference in lung cancer risk between social classes completely. An unavoidable drawback of the study was that there was no information available on smoking habit during the follow-up period and it is possible that changes in exposure may have affected the results.
The West of Scotland has among the highest lung cancer incidence rates in the world3 and lung cancer kills more men than any other cancer in the UK.10,11 It is second to breast cancer in women in England and Wales11 and it has overtaken breast cancer as the biggest cancer killer in women in Scotland.10 Smoking is undisputedly the major cause, so preventative efforts should continue to be focused on smoking cessation and attempts to stop the young from ever beginning to smoke. However, adverse social circumstances and poor lung function may also increase risk,14,34 and at the least they indicate people with a high risk of lung cancer for whom anti-smoking intervention would produce the greatest benefits.35 Reducing socioeconomic inequalities through improving the lifetime circumstances of those worst off may also help to reduce lung cancer rates and would contribute to reducing inequalities in health.
Age-adjusted prevalence and means of smoking habits and other risk factors by social class in men and women aged 45–64 in the Renfrew/Paisley study and men aged 45–64 in the Collaborative study
| Renfrew/Paisley men | Renfrew/Paisley women | Collaborative men | |||||||
|---|---|---|---|---|---|---|---|---|---|
| Non- manual | Manual | Test for differencea | Non- manual | Manual | Test for differencea | Non- manual | Manual | Test for differencea | |
| a t test for continuous variables, chi-squared test for discrete variables. | |||||||||
| b Over never and current smokers. | |||||||||
| c Current smokers only. | |||||||||
| No. | 2162 | 4810 | 3430 | 4568 | 1909 | 2098 | |||
| Prevalences (%) | |||||||||
| Never smoked | 21.0 | 14.8 | P < 0.0001 | 48.3 | 44.1 | P = 0.007 | 18.0 | 11.9 | P < 0.0001 |
| Current smokers | |||||||||
| 1–14 | 10.1 | 12.8 | P = 0.001 | 18.0 | 19.5 | P = 0.10 | 12.3 | 16.9 | P < 0.0001 |
| 15–24 | 23.6 | 31.6 | P < 0.0001 | 21.4 | 26.0 | P < 0.0001 | 20.5 | 30.8 | P < 0.0001 |
| ≥25 | 13.5 | 16.1 | P = 0.008 | 3.5 | 4.0 | P = 0.73 | 12.9 | 12.5 | P = 0.15 |
| Overall χ2b | P < 0.0001 | P = 0.001 | P < 0.0001 | ||||||
| Ex-smokers | |||||||||
| 1–14 | 7.2 | 6.3 | P = 0.17 | 5.4 | 3.8 | P = 0.001 | 9.6 | 8.9 | P = 0.04 |
| 15–24 | 12.9 | 9.5 | P < 0.0001 | 2.5 | 2.0 | P = 0.14 | 14.6 | 10.2 | P = 0.001 |
| ≥25 | 9.0 | 6.7 | P = 0.001 | 0.8 | 0.5 | P = 0.24 | 7.7 | 6.0 | P = 0.07 |
| Pipe or cigar only | 2.3 | 2.0 | P = 0.33 | 0.02 | 0.08 | P = 0.30 | 2.9 | 2.4 | P = 0.005 |
| Inhalec | 82.6 | 86.8 | P = 0.001 | 75.1 | 78.8 | P = 0.06 | 88.5 | 91.1 | P = 0.33 |
| Phlegm | |||||||||
| Occasional | 4.9 | 7.1 | P = 0.001 | 4.3 | 5.4 | P = 0.029 | 5.2 | 6.0 | P = 0.17 |
| Persistent | 12.1 | 12.8 | P = 0.43 | 4.6 | 5.9 | P = 0.019 | 8.9 | 12.8 | P = 0.017 |
| Infective | 12.5 | 21.0 | P < 0.0001 | 9.0 | 14.1 | P < 0.0001 | 11.5 | 16.4 | P < 0.0001 |
| Deprivation category 6 & 7 | 13.0 | 25.3 | P < 0.0001 | 17.2 | 28.1 | P < 0.0001 | 18.8 | 44.1 | P < 0.0001 |
| Car user | – | – | – | – | 59.0 | 33.7 | P < 0.0001 | ||
| Manual father's social class | – | – | – | – | 59.1 | 90.9 | P < 0.0001 | ||
| Manual 1st social class | – | – | – | – | 33.7 | 89.6 | P < 0.0001 | ||
| Left education at ≤14 | – | – | – | – | 30.0 | 84.3 | P < 0.0001 | ||
| Means (SD) | |||||||||
| Duration of smoking (years) | |||||||||
| Current smokers | 36.1 (6.7) | 36.8 (6.8) | P = 0.008 | 31.8 (8.2) | 32.4 (8.3) | P < 0.0001 | 32.6 (5.9) | 33.7 (6.0) | P < 0.0001 |
| Ex-smokers | 22.4 (9.9) | 23.6 (11.0) | P = 0.008 | 22.5 (10.1) | 22.4 (10.8) | P = 0.34 | 18.6 (9.8) | 19.4 (10.4) | P = 0.07 |
| FEV1 score | 93.0 (21.4) | 86.8 (22.4) | P < 0.0001 | 96.8 (22.2) | 89.5 (23.5) | P < 0.0001 | 96.9 (20.6) | 89.4 (20.4) | P < 0.0001 |
| Siblings | – | – | – | – | 2.9 (2.3) | 4.4 (2.7) | P < 0.0001 | ||
20-year age-adjusted lung cancer mortality rates (per 10 000 person years) for men and women in the Renfrew/Paisley study and men in the Collaborative study, aged 45–64, by smoking category and social class
| Smoking category | |||
|---|---|---|---|
| Never | Currenta | Former | |
| a Includes pipe or cigar smokers. | |||
| Renfrew/Paisley men | |||
| No. of men | 1166 | 4083 | 1723 |
| No. of deaths | 9 | 378 | 54 |
| Age-adjusted mortality rate | 4.5 | 70.7 | 20.4 |
| Non-manual | |||
| No. of men | 457 | 1070 | 635 |
| No. of deaths | 3 | 80 | 13 |
| Age-adjusted mortality rate | 3.9 | 57.8 | 13.5 |
| Manual | |||
| No. of men | 709 | 3013 | 1088 |
| No. of deaths | 6 | 298 | 41 |
| Age-adjusted mortality rate | 4.8 | 75.4 | 24.5 |
| Renfrew/Paisley women | |||
| No. of women | 3659 | 3737 | 602 |
| No. of deaths | 19 | 150 | 7 |
| Age-adjusted mortality rate | 2.9 | 26.0 | 7.2 |
| Non-manual | |||
| No. of women | 1629 | 1497 | 304 |
| No. of deaths | 6 | 52 | 3 |
| Age-adjusted mortality rate | 2.3 | 20.7 | 5.3 |
| Manual | |||
| No. of women | 2030 | 2240 | 298 |
| No. of deaths | 13 | 98 | 4 |
| Age-adjusted mortality rate | 3.3 | 29.2 | 7.2 |
| Collaborative men | |||
| No. of men | 586 | 2359 | 1062 |
| No. of deaths | 2 | 129 | 19 |
| Age-adjusted mortality rate | 1.5 | 37.7 | 18.9 |
| Non-manual | |||
| No. of men | 339 | 986 | 584 |
| No. of deaths | 0 | 41 | 12 |
| Age-adjusted mortality rate | 0 | 35.3 | 30.4 |
| Manual | |||
| No. of men | 247 | 1373 | 478 |
| No. of deaths | 2 | 88 | 7 |
| Age-adjusted mortality rate | 3.3 | 39.0 | 6.9 |
20-year relative risk and 95% CI of lung cancer mortality in manual compared to non-manual men in men and women from the Renfrew/Paisley study and men from the Collaborative study aged 45–64
| Renfrew/Paisley men | Renfrew/Paisley women | Collaborative men | |
|---|---|---|---|
| a Smoking categories, duration of smoking & inhalation. | |||
| b FEV1 score & phlegm. | |||
| c Deprivation category & car. | |||
| d Father's social class, 1st social class, number of siblings & education. | |||
| Adjusted for: | |||
| age | 1.75 (1.40–2.20) | 1.48 (1.09–2.02) | 1.73 (1.24–2.42) |
| age & smokinga | 1.41 (1.12–1.77) | 1.28 (0.94–1.75) | 1.43 (1.02–2.01) |
| age, smokinga, lung healthb | 1.29 (1.03–1.62) | 1.16 (0.85–1.59) | 1.35 (0.96–1.90) |
| age, smokinga, lung healthb, deprivation category | 1.27 (1.00–1.61) | 1.18 (0.85–1.62) | 1.24 (0.86–1.79) |
| age, smokinga, lung healthb, material well-being indicatorsc | – | – | 1.14 (0.79–1.66) |
| age, smokinga, lung healthb, material well-beingc & early lifed indicators | – | – | 1.03 (0.68–1.57) |
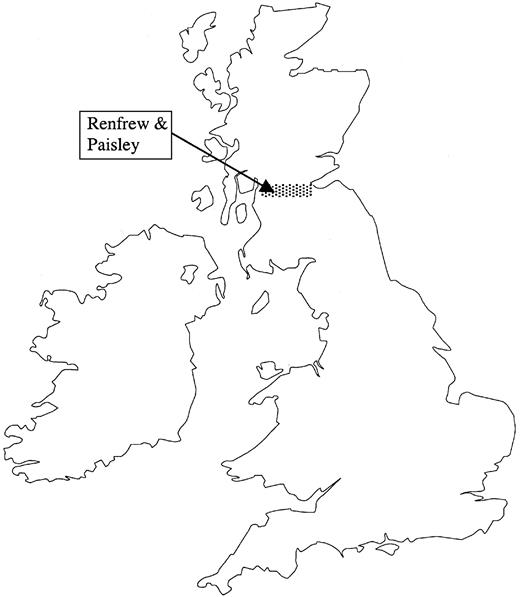
Map of Great Britain showing location of the studies NB: Shading represents collaborative study area.
This study was funded by the Scottish Office Home and Health Department.
References
Schairer E, Schöniger E. Lungenkrebs und Tabakverbrauch.
Doll R, Peto R, Wheatley K et al. Mortality in relation to smoking: 40 years' observations on male British doctors.
WHO. Cancer Incidence in Five Continents Vol. VII. Lyon: International Agency for Research on Cancer, 1997.
Gillis CR, Hole DJ, Hawthorne VM. Cigarette smoking and male lung cancer in an area of very high incidence. II. Report of a general population cohort study in the West of Scotland.
Hein HO, Suadicani P, Gyntelberg F. Lung-cancer risk and social-class—the Copenhagen male study—17 year follow-up.
Bucher HC, Ragland DR. Socioeconomic indicators and mortality from coronary heart-disease and cancer—a 22-year follow-up of middle-aged men.
Engholm G, Palmgren F, Lynge E. Lung cancer, smoking, and environment: a cohort study of the Danish population.
Pearce N, Bethwaite P. Social class and male cancer mortality in New Zealand, 1984–7.
Van Loon AM, Goldhohm RA, Van den Brandt PA. Lung cancer: Is there an association with socioeconomic status in The Netherlands?
Registrar General for Scotland. Annual Report of the Registrar General for Scotland 1996. Edinburgh: General Register Office for Scotland, 1997.
Office for National Statistics. Mortality Statistics: Causes 1996. London: The Stationery Office, 1998.
Hawthorne VM, Watt GCM, Hart CL et al. Cardiorespiratory disease in men and women in urban Scotland: baseline characteristics of the Renfrew/Paisley (Midspan) Study population.
Watt GCM, Hart CL, Hole DJ et al. Risk factors for cardiorespiratory and all cause mortality in men and women in urban Scotland: 15 year follow-up.
Hole DJ, Watt GCM, Davey Smith G et al. Impaired lung function and mortality risk in men and women: Findings from the Renfrew and Paisley prospective population study.
Davey Smith G, Hart C, Hole D et al. Education and occupational social class: which is the more important indicator of mortality risk?
Medical Research Council. Definition and classification of chronic bronchitis for epidemiological purposes.
Carstairs V, Morris R. Deprivation and Health in Scotland. Aberdeen: Aberdeen University Press, 1991.
Davey Smith G, Hart CL, Blane D et al. Adverse socioeconomic conditions in childhood and cause specific adult mortality: prospective observational study.
Hart CL, Davey Smith G, Blane D. Inequalities in mortality by social class measured at 3 stages of the lifecourse.
Davey Smith G, Phillips AN. Confounding in epidemiological studies: why ‘independent’ effects may not be all they seem.
Davey Smith G, Hart CL, Watt G et al. Individual social class, area-based deprivation, cardiovascular disease risk factors and mortality: the Renfrew and Paisley study.
Wannamethee SG, Shaper A. Socioeconomic status within social class and mortality: a prospective study in middle-aged British men.
Gey KF. Prospects for the prevention of free radical disease, regarding cancer and cardiovascular disease.
Ocke M, Bueno-de-Mesquita H, Feskens E et al. Repeated measurements of vegetables, fruits, beta-carotene, and vitamins C and E in relation to lung cancer. The Zutphen Study.
The Alpha-Tocopherol BCCPSG. The effect of vitamin E and beta carotene on the incidence of lung cancer and other cancers in male smokers.
Bolton-Smith C, Brown CA, Tunstall-Pedoe H. Nutrient sources in non-manual and manual occupational groups. Results from the Scottish Heart Health Study (SHHS).
Bolton-Smith C, Smith WCS, Woodward M et al. Nutrient intakes of different social class groups: results from the Scottish Heart Health Study (SHHS).
Pless-Mulloli T, Phillimore P, Moffatt S et al. Lung cancer, proximity to industry, and poverty in Northeast England.
Van Loon AM, Goldbohm RA, Kant I et al. Socioeconomic status and lung cancer incidence in men in The Netherlands: Is there a role for occupational exposure?
Darby S, Whitley E, Silcocks P et al. Risk of lung cancer associated with residential radon exposure in south-west England: a case-control study.

