


Abstract
Post-cardiac surgical cognitive dysfunction occurs more commonly following valvular procedures. Cognitive function has been related to vascular health status; however, the relation between pre-existent arterial stiffness and perioperative cognitive dysfunction is yet to be defined. The objective of this study was to assess whether aortic stiffness is related to cognitive dysfunction in surgical aortic stenosis (AS) pre- and postoperatively.
Between June 2010 and August 2012, patients undergoing aortic valve replacement (AVR) for AS were recruited for inclusion in this prospective observational study. Aortic pulse wave velocity (PWV) was used as a measure of aortic stiffness and cognitive function was assessed using the computerized Cambridge Neuropsychological Test Automated Battery (CANTAB) preoperatively and (409 ± 159 days) post-AVR.
Fifty-six patients (age 71 ± 8.4 years) were recruited. Of the total, 50 (89%) completed postoperative follow-up. Pre- and postoperatively, patients with normal PWV (PWV-norm) had significantly superior delayed memory, sustained visual attention and executive function compared with those with high PWV (PWV-high). Immediate memory and decision-making were similar between groups. Postoperatively, improvement in cognitive function was more marked in PWV-high compared with PWV-norm patients. In two models of multiple regression analysis, PWV as a continuous variable was independently related to all preoperative main cognitive components as well as postoperative executive function. PWV as a dichotomous variable was independently related to all pre- and postoperative main cognitive function components.
AVR may not be associated with an independent or homogeneous effect on cognitive decline. Aortic PWV might be useful as an additional indicator for cognitive dysfunction before and after surgical intervention for AS.
INTRODUCTION
Over recent decades, we have seen a significant decline in morbidity and mortality after cardiac surgery such that these outcomes are no longer always the optimal goalposts by which to measure operative ‘success’. Therefore, symptomatic and functional outcomes, including cognitive function, have become of increasing importance.
Cognition can be described simply as the acquisition, storage, transformation and use of knowledge. It is a complex process involving interactions between different parts of the brain, particularly the hippocampus, where memories are created [1]. Following cardiopulmonary bypass (CPB), neuropsychological/cognitive dysfunction is common, particularly after valve surgery, with 10–30% of patients experiencing postoperative delirium, 33–83% experiencing short-term cognitive changes and 20–60% experiencing long-term cognitive disturbance [2]. The cause of this dysfunction is multifactorial, related to preoperative risk factors as well as the systemic inflammatory response syndrome, hypoperfusion and microembolization associated with cardiac surgery [2, 3]. Despite the functional importance of post-surgical cognitive dysfunction, detection and quantification of cognitive impairment is difficult and requires time-consuming and detailed cognitive assessment [4]. As such, there has been increasing interest in developing a robust and reproducible clinical or biochemical marker of cognitive function [3].
Pulse wave velocity (PWV) is a measure of the pattern of blood flow through a vessel. It reflects the functional elastic properties and structural integrity of the vessel wall, the ‘arterial stiffness’. Structural damage to the vessel wall increases vessel stiffness and PWV. Carotid–femoral PWV is the ‘gold standard’ measure of arterial stiffness and is the most validated and widely used method to assess the aorta [5, 6]. Furthermore, the availability of the ‘Reference Values for Arterial Stiffness’ published in 2010, based on over 16 000 subjects from eight European countries, has allowed for arterial stiffness to be measured in several disease-specific populations [5]. As such, PWV has now been shown to be an independent predictor of cardiovascular (CV) and all-cause mortality in older patients [7], and those with hypertension [6] and diabetes mellitus [8].
High PWV has been associated with cerebral small-vessel disease and cognitive function impairment and decline in older patients [9]. Furthermore, arterial stiffness has recently been linked to poorer cognitive function or cognitive decline in both the general population and hypertensive patients [10, 11]. In 2011, the American Heart Association stated ‘Carotid intimal-medial thickness and arterial stiffness are emerging as markers of arterial aging and may serve as risk markers for VCI (vascular cognitive impairment)’ [12]. However, the relation between PWV and cognitive function in cardiac surgery patients is undetermined.
Therefore, aim of this study was to determine the relation between arterial stiffness and cognitive dysfunction after cardiac surgery by measurement of PWV and the Cambridge Neuropsychological Test Automated Battery (CANTAB), quantitatively assessing arterial stiffness and cognitive function, respectively. Furthermore, we aimed to determine whether aortic stiffness measured with PWV is an indicator of pre-existent cognitive dysfunction in aortic stenosis (AS) patients and the ability of this measure to determine cognitive function following aortic valve replacement (AVR).
MATERIALS AND METHODS
Overview
Ethical approval (11/H0709/3) was granted and informed consent obtained from all participants before inclusion. Between June 2010 and August 2012, patients with severe AS in whom surgical intervention was clinically indicated were recruited to participate in this study. Patients were excluded if they had a history of/presented with: (i) aortic dissection; (ii) severe aortic regurgitation; (iii) thoracic aorta (more than just the root) or abdominal aortic aneurysm; (iv) chronic kidney disease; (v) Marfan's syndrome; (vi) any psychiatric or significant neurological condition; (vii) regular treatment for mental illness including antidepressants; or (viii) mini-mental state examination score <25.
Aortic stiffness was assessed by measuring carotid–femoral PWV. Based on patients' preoperative PWV measurement and age-matched European normal values for PWV [5], patients were divided into two groups:
PWV-norm: PWV measurement equal to or below the reference value for age group.
PWV-high: PWV measurement above the reference value for age group.
Cognitive function test was reassessed at the follow-up visit (409 ± 159 days) postoperatively.
Pulse wave velocity measurement protocol
Before measurement, all participants abstained from tobacco, alcohol and tea or coffee for at least 2 h. Blood pressure (BP) measurements were taken before and after PWV assessment and the mean used for analysis.
Aortic PWV (carotid–femoral PWV) was obtained with an automatic applanation tonometry system (SphygmoCor Vx, AtCor Medical, Australia). Briefly, with the patient resting in a supine position, electrocardiography (ECG-gated) pulse waveforms were obtained from the common carotid and then femoral arteries sequentially. Propagation time of the pulse wave was measured from the foot of the carotid waveform to that of the femoral waveform referenced to the R wave on the recorded ECG. The transit distance (mm) was measured over the body surface by subtracting the distance between the suprasternal notch and the carotid site from the distance between the suprasternal notch and the femoral site. PWV was subsequently calculated in m/s using the SphygmoCor device by dividing the travelled distance by the propagation time. Three to five readings were obtained per patient and PWV determined by averaging the measurements meeting quality control parameters outlined by SphygmoCor.
Cognitive function assessment
The methodology we followed in assessing cognitive function, including the assembling of the test battery, was based on the recommendations from ‘Statement of consensus on assessment of neuro-behavioural outcomes after cardiac surgery’ [13]. Cognitive function was assessed using the CANTAB; the tests and outcome measures included in our battery are described in Table 1. CANTAB is a laptop-based, computerized, non-linguistic, non-verbal and culturally independent cognitive test, which has to date formed the basis of detailed neurocognitive assessment (http://www.cantab.com/). In addition to its strong psychometric properties and non-verbal nature, CANTAB can be advantageous in detecting subtle or marginal cognitive deficits when compared with classical clinical or paper-based measures. The CANTAB system has 22 tests, two introductory and 20 neuropsychological, which can be categorized into: (i) visual memory; (ii) executive function; (iii) attention; (iv) semantic/verbal memory; and (v) decision-making and response control. Participants respond by simply touching the screen with their fingers and neither writing nor drawing is required. The battery was administered to all participants by a single investigator (E.K.). As in the early postoperative period, surgery-related factors, such as pain, fatigue, systemic inflammation, deep anaesthesia, opioids and sedative medications, can affect patient performance during cognitive screening; postoperative cognitive function and PWV were reassessed at the 1-year follow-up (409 ± 159 days).
Description of the cognitive battery components
| Test | Tested function | Description | Parts/levels | Reference | Important measures |
|---|---|---|---|---|---|
| Pattern Recognition Memory (PRM) | Memory | A test of visual memory function that involves recalling of 12 difficult visual patterns in the immediate memory part and another 12 difficult visual patterns in the delayed memory part | Immediate memory (tested immediately) Delayed memory (tested after 20 min delay) | Sahakian et al. [14] | Percentage of correct answersa (up) Latency (time needed) of subject's response (down) |
| Rapid Visual Information Processing (RVP) | Sustained attention | A test of sustained attention that involves detection of and responding to three sequences of numbers (3-digits each) among randomly changing digits from 2 to 9 at the rate of 100 digits per min | Sahakian et al. [15] | Total missed targetsa (down) Latency of subject's responsea (down) A' measure of sensitivity to the target stimulus (range 0.00–1.00; bad to good)a Probability of correct hita (up) Total correct rejectionsa (up) | |
| Information Sampling Task (IST) | Decision-making and impulsivity | A test of decision-making and impulsivity by playing a game for points by making a correct decision about which colour of two is in the majority under 25 grey boxes after the opening of some or all of the grey boxes by the patient | Decreasing-win condition: points a patient wins for a correct decision start at 250 and decrease by 10 points for every box opened Fixed-win condition: points a patient wins for a correct decision is fixed (100 point) regardless of the number of boxes opened | Clark et al. [16] | Total correct trialsa (up) Mean number of boxes opened per triala (down) Latency of subject's responsea (down) |
| One Touch Stockings of Cambridge (OTS) | Executive function | A spatial planning test that involves intellectual planning of a sequence of minimum number of moves to make an arrangement of coloured balls to achieve a goal arrangement without moving the balls on screen | 1-level (most easy) 2-level 3-level 4-level 5-level (most difficult) | Baker et al. [17] | Problems solved on the first choicea (up) Mean choices to correcta (down) Mean latency to correcta (down) |
aMeasures used in this study analysis; ‘up’ indicates higher is better; ‘down’ indicates smaller is better.
Operative technique
Operating surgeons and anaesthetists were blinded to recruited patients to ensure that the sample data collected were representative of our routine daily clinical practice. The surgical approach was through median sternotomy, and all procedures were carried out using CPB with moderate hypothermia (32–34°C). Full anticoagulation was achieved with a routine dose of heparin (300 IU/kg) to maintain an activated clotting time of 400–600 s. CPB was established using ascending aortic cannulation (distal to the external cross-clamp) and right atrial venous cannulation. Cardiotomy suction was used and myocardial protection was achieved with intermittent antegrade cold blood cardioplegia. CBP was continued with non-pulsatile flow with arterial pressure maintained in the range of 50–80 mmHg. Through a transverse aortotomy, 1–2 cm above the sinotubular junction, the diseased valve was excised, followed by careful removal of calcium deposits from the aortic annulus. Before the prosthetic valve was inserted, thorough irrigation and suction were performed to remove any calcium debris. The brand of prosthesis and the suturing technique were according to the surgeons' preference. No intra-aortic filtration system (embolic protection device) or specific cerebral monitoring technique was used.
To minimize air embolism, the patient was placed in the Trendelenburg position and, with transoesophageal echocardiogram support, the following techniques/manoeuvres were employed before discontinuation of CPB according to individual surgeon preference: (i) reperfusion of the beating heart; (ii) reduction in vent suction to allow cardiac filling; (iii) ejection of pulmonary air by intermittent lung ventilation; (iv) controlled free bleeding from a loose aortotomy suture to allow release of remaining air upon ejection; (v) needle aspiration of air through the cardiac apex; and (vi) continuous suction through a vent catheter placed in the aortic closure line.
Statistical analysis
Statistical analysis was performed using IBM SPSS Statistics software version 18.0 and Microsoft Excel 2010. Patient characteristics were expressed as mean ± standard deviation (continuous variables) and as frequencies (categorical variables). Statistical significance was considered where P <0.05. The distribution of all outcome variables was assessed for normality and all non-normally distributed variables were transformed before inclusion in the regression analysis. PWV and cognitive function were examined using both linear and categorical approaches.
PWV was analysed as a continuous variable to verify our hypothesis. In addition, comparative analysis between PWV-norm and PWV-high groups was carried out using an independent samples t-test or non-parametric equivalent (the Mann–Whitney U-test) for continuous variables, and Pearson's χ2 or Fisher's exact tests for categorical variables. Differences between preoperative and postoperative scores were analysed using a paired-samples t-test or non-parametric equivalent (Wilcoxon). The strength of association between cognitive function components, PWV and patients' characteristics was tested using bivariate correlation analysis (Spearman's rank-order correlation and Point/Rank biserial correlation in the case of dichotomous variables such as PWV cut-off) for both pre- and postoperative stages. All variables with significant correlation, in addition to age and gender, were then included in two multiple regression models (Enter method): (i) Model 1: using PWV as a continuous predictor; (ii) Model 2: using PWV cut-off as a dichotomous predictor. In addition to the paired-sample t-test, repeated-measure analysis was conducted using mixed analysis of variance (ANOVA) to check the main effect of time (follow-up period) and of group (PWV groups) on the repeated measure.
RESULTS
Descriptive results
Fifty-six patients (16 females), mean age 71 ± 8.4 years, were included in this study. No study participants had a history of chronic liver or kidney disease. No emergency cases were recruited. No patients developed shock, sepsis or required intra-aortic balloon pump or intensive care admission preoperatively. There were no major intraoperative complications, and no patients developed Type I neurocognitive adverse outcomes [stroke, transient ischaemic attack (TIA), coma or stupor]. Only one patient required more than 24 h of intubation postoperatively. Thirty-five patients (62%) had PWV measurements equal to or below the normal value for their age group (PWV-norm group) and 21 (38%) had PWV measurements above the normal value for their age group (PWV-high group). Fifty (89%) patients completed a late follow-up; none of the follow-up cases suffered major adverse events or needed major hospital readmission. There was no significant difference between the two groups in age, gender, classical haemodynamic measurements, estimated IQ level as measured by the National Adult Reading Test [18], operative characteristics and other clinical characteristics (Table 2). The mean PWV was 9.3 ± 2.2 m/s with a significant difference between different age groups (P = 0.001, ANOVA). AS severity, as determined by aortic valve mean gradient, aortic valve peak gradient and aortic valve area (AVA) was not statistically significant between PWV-norm and PWV-high groups (Table 2).
Demographic and clinical characteristics
| Parameter | Total (n = 56) | PWV-norm (n = 35) | PWV-high (n = 21) | P-value |
|---|---|---|---|---|
| Male, n (%) | 40 (71) | 27 (77) | 13 (62) | 0.36 |
| Age (years) | 71 ± 8.4 | 70.2 ± 9 | 72 ± 8 | 0.43 |
| Age range (years) | 53–90 | 53–90 | 56–85 | |
| White Caucasian, n (%) | 55 (98) | 35 (100) | 20 (95) | 0.37 |
| DM, n (%) | 8 (14) | 4 (11) | 4 (19) | 0.43 |
| Smoking, n (%) | 2 (4) | 2 (6) | 0 (0) | 0.21 |
| BMI (kg/m2) | 27.2 ± 4.2 | 26.5 ± 4.3 | 28.1 ± 4.1 | 0.18 |
| SBP (mmHg) | 136 ± 24 | 132 ± 27 | 142 ± 18 | 0.14 |
| DBP (mmHg) | 76 ± 11 | 75 ± 12 | 77 ± 11 | 0.58 |
| MAP (mmHg) | 97 ± 12 | 96 ± 13 | 98 ± 11 | 0.56 |
| Cholesterol (mmol/l) | 4.5 ± 1.2 | 4.6 ± 1.3 | 4.4 ± 0.8 | 0.60 |
| Hypertension, n (%) | 38 (68) | 22 (63) | 16 (76) | 0.38 |
| PVD, n (%) | 2 (4) | 0 (0) | 2 (10) | 0.13 |
| EuroSCORE (Logistic) | 5.5 ± 4.3 | 5.1 ± 4 | 6.1 ± 4.7 | 0.23 |
| AVA (cm2) | 0.73 ± 0.2 | 0.74 ± 0.2 | 0.71 ± 0.2 | 0.67 |
| AVMG (mmHg) | 48 ± 13 | 50 ± 13 | 46 ± 11 | 0.27 |
| AVPG (mmHg) | 82 ± 24 | 86 ± 27 | 76 ± 19 | 0.13 |
| EF | 59 ± 15 | 58 ± 15 | 61 ± 16 | 0.56 |
| Concomitant CABG, n (%) | 15 (27) | 10 (28) | 5 (24) | 0.76 |
| CPB time (min) | 87 ± 23 | 87 ± 20 | 87 ± 27 | 0.95 |
| Hospital stay (days) | 6.7 ± 1.7 | 6.6 ± 1.6 | 6.7 ± 1.8 | 0.84 |
| PWV (m/s) | 9.3 ± 2.2 | 8.1 ± 1.5 | 11.3 ± 1.6 | <0.001 |
| Estimated IQ | 111 ± 6 | 111 ± 6 | 112 ± 6 | 0.77 |
Values are shown as n (%) for categorical variables and the mean ± standard deviation for continuous variables.
AVA: aortic valve area; AVMG: aortic valve mean gradient; AVPG: aortic valve peak gradient; BMI: body mass index; CABG: coronary artery bypass graft surgery; CPB: cardiopulmonary bypass; DBP: diastolic blood pressure; DM: diabetes mellitus; EF: ejection fraction; MAP: mean arterial blood pressure; PVD: peripheral vascular disease; PWV: pulse wave velocity; SBP: systolic blood pressure.
Pulse wave velocity and cognitive function
Memory function
No significant difference was seen in the percentage of correct answers in the immediate Pattern Recognition Memory (PRM) between the two groups pre- or postoperatively (Fig. 1). Conversely, PWV-norm patients demonstrated significantly better-delayed PRM compared with PWV-high patients, answering a greater percentage of questions correctly both pre- (P <0.001) and postoperatively (P = 0.01). Interestingly, no deterioration in memory function was seen after AVR and, in fact, there was non-significant improvement in overall memory function in both groups (Fig. 1).
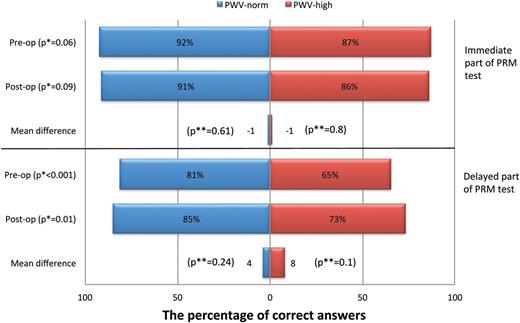
The differences between pulse wave velocity (PWV)-norm and PWV-high groups in the Pattern Recognition Memory (PRM) test at pre- and postoperative stages. *P-value denotes PWV-norm versus PWV-high (independent samples analysis). **P-value denotes preop versus postop value for same the group (paired-samples analysis).
Sustained attention
PWV-norm patients demonstrated a globally better performance in the Rapid Visual Information Processing (RVP) test compared with PWV-high patients both pre- and postoperatively. PWV-norm patients recognized and hit more targets (missed less targets), responded faster (latency) and avoided responding to incorrect targets (correct rejections) more compared with PWV-high patients. Although not statistically significant, there was a noticeable postoperative improvement in most components of this cognitive function, more in the PWV-high than in the PWV-norm group (Table 3).
The mean differences between pulse wave velocity (PWV)-norm and PWV-high groups in Rapid Visual Processing (RVP) scores at pre- and postoperative stages
| RVP measure | Preoperative | Postoperative | Mean difference | P-value** | |
|---|---|---|---|---|---|
| Total missed targets (smaller better) | PWV-norm | 11 ± 4 | 11 ± 5 | 0.3 ± 5.8 | 0.75 |
| PWV-high | 18 ± 4 | 14 ± 6 | 4 ± 7 | 0.06 | |
| P-value* | <0.001 | 0.04 | |||
| Latency of subject's response (ms) (faster better) | PWV-norm | 526 ± 162 | 511 ± 136 | 14 ± 182 | 0.70 |
| PWV-high | 652 ± 144 | 598 ± 211 | 54 ± 260 | 0.44 | |
| P-value* | 0.001 | 0.11 | |||
| A' (sensitivity to the target stimulus (higher better) | PWV-norm | 0.88 ± 0.04 | 0.89 ± 0.05 | −0.004 ± 0.05 | 0.67 |
| PWV-high | 0.82 ± 0.04 | 0.84 ± 0.05 | −0.02 ± 0.06 | 0.15 | |
| P-value* | <0.001 | 0.01 | |||
| Probability of correct hit (higher better) | PWV-norm | 0.56 ± 0.2 | 0.59 ± 0.2 | −0.03 ± 0.25 | 0.59 |
| PWV-high | 0.34 ± 0.13 | 0.43 ± 0.17 | −0.09 ± 0.21 | 0.11 | |
| P-value* | 0.001 | 0.01 | |||
| Total correct rejections (higher better) | PWV-norm | 246 ± 12 | 234 ± 30 | 12 ± 53 | 0.29 |
| PWV-high | 230 ± 10 | 221 ± 60 | 9 ± 58 | 0.56 | |
| P-value* | <0.001 | 0.42 |
P-value is for PWV-norm versus PWV-high (independent samples analysis).
P-value is for preop versus postop value for same the group (paired-samples analysis).
Decision-making and impulsivity
Decision-making and impulsivity was assessed using the Information Sampling Task test in which total correct trials, mean number of boxes opened per trial and latency of subject's response were measured. The groups performed similarly in both decreasing-win (requiring judgement between risk of losing and benefit of winning) and fixed-win conditions [where participants are not accountable for the number of tries (boxes opened) to make a decision]. P-values for preoperative total correct trials, mean number of boxes opened per trial and latency of subject's response were 0.21, 0.16 and 0.21, respectively (for Fixed-win condition) and 0.41, 0.95 and 0.93, respectively (for Decreasing-win condition). Furthermore, no significant difference was seen between pre- and postoperative assessments for either group.
The RVP A' (sensitivity to the target stimulus) and the RVP probability of correct hit components can also be used to determine decision-making processes. Notably, PWV-norm patients performed significantly better compared with PWV-high patients in both components pre- (P <0.001 and 0.001, respectively) and postoperatively (P = 0.01 for both).
Executive cognitive function
Executive cognitive function was assessed using the One Touch Stockings of Cambridge (OTS) test. PWV-norm patients solved significantly more problems on their first choice compared with PWV-high patients both pre- (16.6 ± 1.9 vs 14 ± 2.7, P <0.001) and postoperatively (17.7 ± 1.3 vs 14.1 ± 3.1, P <0.001). For simple problems, both groups required a similar number of choices to reach the correct answer. However, in more complex problems, the relation between PWV and number of trials diverged significantly in favour of the PWV-norm group. In addition, patients with normal PWV required less time to solve problems at almost all levels of difficulty (Fig. 2).
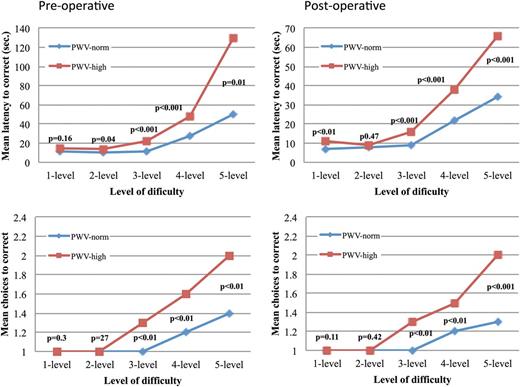
The executive function test (OTS) for pulse wave velocity (PWV)-norm and PWV-high groups showing mean latency and mean number of trials (choices) needed to solve the problems at different levels of difficulties pre- and postoperatively.
Interestingly, there was no deterioration in problem-solving function over time. In fact, latency (time required to solve the problem) of the most difficult problems (5-level) was significantly improved in both PWV-norm (P = 0.007) and PWV-high (P = 0.003) groups.
Correlation and regression
For the purposes of regression analysis, the following main components of cognitive function were considered: (i) PRM: delayed component; (ii) RVP: total missed and A′ components; and (iii) OTS test: problems solved on first choice, mean choices and mean latency to correct answer (5-level difficulty) components. Bivariate correlation demonstrated significant correlation between PWV and all main components of cognitive function both pre- and postoperatively (Fig. 3). These associations remained significant when PWV was categorized according to normal PWV reference values (PWV cut-off) (Fig. 3). Furthermore, age, gender, ejection fraction and AVA were significantly correlated with some but not all cognitive components, as demonstrated in Fig. 3. The correlation between main intra- and postoperative factors and postoperative cognitive function was also assessed (Fig. 3). Postoperative cognitive function did not correlate with cardiopulmonary bypass time, whereas executive function and sustained attention were correlated to prosthetic valve size and postoperative inotropes (more than 6 h), respectively. Remarkably, four of six postoperative cognitive components were associated with the presence of postoperative atrial fibrillation (AF).
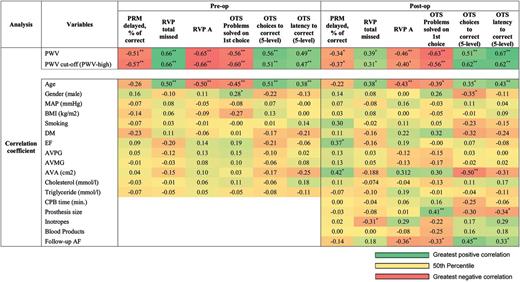
Bivariate correlation identifying variables independently associated with cognitive function. *P<0.05. **P<0.01. AF: atrial fibrillation; AVA: aortic valve area; AVMG: aortic valve mean gradient; AVPG: aortic valve peak gradient; BMI: body mass index; DM: diabetes mellitus; EF: ejection fraction; MAP: mean arterial blood pressure; PWV: pulse wave velocity.
All variables with significant correlation, along with age and gender, were included in two multiple linear regression models (Enter method) (Table 4). Model 1 (PWV as a continuous variable) revealed PWV to be an independent predictor of all preoperative cognitive components and the postoperative executive function component of cognitive function. Model 2 (PWV as a dichotomous variable) demonstrated PWV to be an independent predictor of all pre- and postoperative main cognitive function components, with age becoming another more prominent predictor of cognitive function. Postoperative AF was independently related to 50% of postoperative cognitive function in Model 1, but lost this significant relation in Model 2.
Multiple linear regression identifying variables independently related to cognitive function
| Analysis | Variables | Preop | Postop | ||||||||||
|---|---|---|---|---|---|---|---|---|---|---|---|---|---|
| PRM delayed, % of correcta | RVP total missed | RVP Ab | OTS problems solved on first choiceb | OTS choices to correct (5-level)c | OTS latency to correct (5-level)b | PRM delayed, % of correcta | RVP total missed | RVP A | OTS problems solved on first choiceb | OTS choices to correct (5-level)c | OTS latency to correct (5-level)b | ||
| Regression (beta) (Model 1) | PWV | −0.41** | 0.49** | −0.47** | −0.37** | 0.32* | 0.31* | −0.32 | 0.39* | −0.32 | −0.4* | 0.40* | 0.48** |
| Age | −0.03 | 0.26* | −0.27* | −0.29* | 0.36** | 0.26 | 0.05 | 0.31* | −0.17 | −0.06 | −0.00 | 0.02 | |
| Gender | 0.07 | −0.04 | 0.05 | 0.17 | −0.12 | −0.03 | −0.03 | −0.00 | −0.08 | −0.04 | −0.16 | 0.24 | |
| EF | 0.42* | ||||||||||||
| AVA (cm2) | 0.23 | −0.3* | |||||||||||
| Prosthesis size | 0.34 | −0.38* | |||||||||||
| Inotropes | −0.55** | ||||||||||||
| Follow-up AF | −0.32* | −0.27 | 0.26* | 0.31* | |||||||||
| Regression (beta) (Model 2) | PWV cut-off | −0.52** | 0.61** | −0.61** | −0.48** | 0.45** | 0.43** | −0.39* | 0.36** | −0.33* | −0.44** | 0.50** | 0.52** |
| Age | −0.17 | 0.43** | −0.43** | −0.42** | 0.47** | 0.36* | −0.07 | 0.45** | −0.31* | −0.28 | 0.18 | 0.25 | |
| Gender | 0.03 | 0.00 | 0.01 | 0.14 | −0.09 | −0.00 | −0.03 | 0.01 | −0.08 | −0.03 | −0.16 | 0.16 | |
| EF | 0.41* | ||||||||||||
| AVA (cm2) | 0.19 | −0.32* | |||||||||||
| Prosthesis size | 0.24 | −0.26 | |||||||||||
| Inotropes | −0.51** | ||||||||||||
| Follow-up AF | −0.24 | −0.13 | 0.16 | 0.15 | |||||||||
Only significant variables from the bivariate correlation, in addition to age and gender, were included in this multiple regression (Enter method) analysis. Model 1 includes PWV value as a continuous predictor; Model 2 includes PWV cut-off as a dichotomous predictor.
AF: atrial fibrillation; AVA: aortic valve area; EF: ejection fraction; OTS: One Touch Stockings of Cambridge; PRM: Pattern Recognition Memory; PWV: pulse wave velocity; RVP: Rapid Visual Information Processing.
aSquare root transformation.
bLog transformation.
cInverse transformation.
P <0.05.
P <0.01.
Mixed ANOVA was performed to assess the effect of time (follow-up period) and group (PWV groups) on the repeated measure (Table 5). The main effect of group (between-subjects effect) revealed a statistically significant difference in all cognitive components between PWV groups (F range 11.4–22.1, ηp2 range 0.23–0.37). The main effect of time (within-subjects effects) showed a statistically significant difference in memory and executive function only between different time points (F range 4.9–15.6, ηp2 range 0.11–0.29). There was no statistically significant interaction between the PWV groups and follow-up period on any component of cognitive function.
Mixed ANOVA for the main cognitive function components
| Cognitive function | Main effect | Degrees of freedom | Mean square | F-test | P-value | ηp2 |
|---|---|---|---|---|---|---|
| PRM delayed, % of correcta | Within-subjects effects | 1 | 5.43 | 4.9 | 0.03 | 0.11 |
| Between-subjects effect | 1 | 24.75 | 11.4 | 0.002 | 0.23 | |
| RVP total missed | Within-subjects effects | 1 | 76.8 | 3.8 | 0.06 | 0.09 |
| Between-subjects effect | 1 | 525.1 | 17.5 | <0.001 | 0.31 | |
| RVP Ab | Within-subjects effects | 1 | 0.001 | 2.1 | 0.16 | 0.05 |
| Between-subjects effect | 1 | 0.014 | 17.1 | <0.001 | 0.32 | |
| OTS problems solved on first choiceb | Within-subjects effects | 1 | 0.11 | 5.6 | 0.02 | 0.12 |
| Between-subjects effect | 1 | 1.23 | 17.2 | <0.001 | 0.31 | |
| OTS choices to correct (5-level)c | Within-subjects effects | 1 | 0.05 | 3.4 | 0.07 | 0.08 |
| Between-subjects effect | 1 | 0.74 | 17.6 | <0.001 | 0.32 | |
| OTS latency to correct (5-level)b | Within-subjects effects | 1 | 0.36 | 15.6 | <0.001 | 0.29 |
| Between-subjects effect | 1 | 1.54 | 22.1 | <0.001 | 0.37 |
Main effects are the effect of time, follow-up period (within-subjects effects); the effect of PWV group (between-subjects effect).
OTS: One Touch Stockings of Cambridge; RVP: Rapid Visual Information Processing; PRM: Pattern Recognition Memory.
aSquare root transformation.
bLog transformation.
cInverse transformation.
DISCUSSION
Long-term cognitive injury after cardiac surgery ranges 20–60% [2], and is associated with a 5-fold increase in mortality, longer hospital stay and a significant need for sociomedical care following discharge [19]. As such, identifying preoperative predictors of poor cognitive outcome is of paramount importance. The aetiology of neurocognitive decline after cardiac surgery is multifactorial, involving a complex interaction between systemic inflammation, hypoperfusion and microembolization, which produces difficulties in developing a selective biomarker or diagnostic test. However, the findings of this study suggest that aortic stiffness as determined by PWV predicts cognitive outcome as calculated by the CANTAB. Therefore, future application of this test might provide a novel adjunct in the preoperative assessment of cardiac surgical patients, allowing better prediction of postoperative cognitive dysfunction after aortic valve surgery.
Our results demonstrate that low aortic compliance (high PWV) is associated with significantly poorer delayed memory performance, poorer attention, slower response and worse problem solving both pre- and postoperatively in patients undergoing AVR. In the sustained attention test (RVP), which requires interactions between the parietal and frontal lobe areas of the brain, again there was a significant relation between abnormal PWV and poor attention and response pre- and postoperatively. The PWV-norm group significantly recognized and hit more targets, responded faster (latency) and avoided responding to incorrect targets (correct rejections) more than the PWV-high group.
The problem-solving test (OTS) assesses the executive function of the frontal lobe. Here, PWV was found to be significantly associated with the number of problems solved on first choice. In addition, the PWV-high group needed significantly more time and trials (choices) to solve these problems pre- and postoperatively. Interestingly, there was no deterioration in memory, sustained attention or problem-solving function between pre- and postoperative tests and, in fact, some postoperative improvements were observed in cognitive function and time to solve more difficult problems, particularly in the PWV-high group.
Bivariate correlation analysis revealed that only age and PWV significantly correlated with cognitive function components both pre- and postoperatively (Fig. 3). Notably, however, AF also correlated with postoperative cognitive function in four of the six cognitive components. Multivariate regression similarly demonstrated postoperative AF to be a significant predictor of executive function at follow-up when PWV was modelled as a continuous variable. These findings support work by Stanley et al. [20], who demonstrated significantly worse composite cognitive function in patients developing AF 6 weeks after CABG compared with those who did not. Beyond this, our results suggest that the effect to AF on cognitive function after AV surgery remains apparent at longer term follow-up. Although the exact mechanism for the observed relation between AF and cognitive function is not clearly defined, it seems that this is not limited to embolization, but also involves impaired cerebral perfusion, evidenced by the restoration of cognitive function with improvement in cerebral circulation through cardiac pacing [21].
The results presented here support several recent studies demonstrating an association between high PWV and poorer cognitive function or cognitive decline [10, 11]. However, this is the first study of its kind to confirm this association after aortic valve surgery utilizing the CANTAB computer-based cognitive battery. Although many such studies have reported deterioration in cognitive function after cardiac surgery [22], our results are among other studies that demonstrated similar or even improvements in postoperative cognitive function [23]. Although it has been argued that postoperative results might be affected by learning effects, considering the time interval between preoperative and follow-up assessments, it is unlikely that the results were disturbed by practice effects. Furthermore, these tests are devised with a fast, random presentation order and geometric patterns that cannot be given verbal labels, making it nearly impossible to remember a specific pattern, number stimulus or problem solution. As such, we believe that the results presented here reflect true cognitive status after AVR.
Whereas previous studies focused on cognitive decline after CABG or included a mixed population of patients, this study uniquely assessed patients undergoing AVR. As such, we believe that post-surgical improvements in systemic BP, cerebral and systemic circulation might account for the observed improvement in many aspects of cognitive function. Indeed, relief of presyncope and syncope was a symptomatic indication for AVR in many of our patients. Furthermore, by extending follow-up beyond 1 year after surgery, unquantifiable factors, such as the acute systemic inflammatory response, hypoperfusion and microembolization occurring in the early postoperative period, can be allowed to plateau, producing a more accurate long-term estimate [3]. The use of a computer-based battery rather than paper-based cognitive tests might also explain why this relation between aortic stiffness and cognitive function AVR has yet to be reported. Such novel techniques improve our ability to discriminate marginal differences in errors and timing, allowing us to detect previously unobserved subtle changes in cognition.
Preoperative cognitive dysfunction has been linked to factors such as age, cerebral infarctions, cerebrovascular disease, baseline cognitive index and metabolic syndrome. Similarly, these factors might have a combined effect on postoperative cognitive dysfunction [24, 25]. In this study, we hypothesize that aortic stiffness might act as a practical surrogate marker of these baseline patient-related predictors. Indeed, patients with a higher arterial stiffness demonstrated poorer cognitive function before and after surgery, and seemed to attain a greater cognitive benefit from AVR compared with matched patients with normal arterial stiffness. Furthermore, the absence of association between PWV and degree of valvular stenosis or other demographic/clinical characteristics also allows us to conclude that the cognitive function changes associated with PWV might not be attributed solely to these factors.
Further studies are now required to validate this relation on a larger patient cohort and determine the predictive value of this surrogate marker of cognitive dysfunction. Future application of this test could reform the preoperative assessment of cardiac surgical patients, not only allowing surgeons to better predict postoperative cognitive dysfunction, but also better informing patients as to their individualized risk.
STRENGTHS AND LIMITATIONS
This study is the first of its kind to investigate the relation between aortic stiffness and cognitive function in AVR patients. Use of the ‘gold standard’ PWV as a measure of aortic stiffness and the CANTAB computer-based battery as a measure of cognitive function produces an accurate, robust, and less operator-dependent methodology. To our knowledge, no previous studies into cognitive dysfunction after cardiac surgery have been conducted using this computer-based system. Our disease-specific and matched patient groups also remove potential variations in cognitive function due to extraneous factors, such as hypertension, ischaemic heart disease, diabetes mellitus and cerebrovascular disease.
The main limitation of this study is the absence of a brain-imaging component, which might quantify structural changes underlying functional cognitive dysfunction. Such an assessment would improve our understanding of the relation between aortic stiffness and cognitive function, and identify any macroscopic cerebral changes that could explain changes in cognition scores. Indeed, previous studies have identified pre-existing white matter lesions and cerebral infarctions in patients developing post-cardiac surgical cognitive dysfunction [25]. A second limitation is the lack of quantitative assessment of aortic leaflet or annular calcification through cardiac magnetic resonance imaging, computed tomography or fluoroscopy. Furthermore, to maintain both surgeon and anaesthetist blinding, no intraoperative Doppler measurement of high-intensity transient signals was made. As a result, we were unable to assess the relation between intraoperative embolization and postoperative cognitive function in more detail. Given these limitations, our results should be treated as preliminary and be utilized to design larger prospective studies to examine specific elements of this relation in more detail.
CONCLUSIONS
Arterial stiffness is a potential predictor of post-surgical morbidity and mortality. These findings suggest that AS patients with higher preoperative aortic stiffness have a significantly poorer pre- and post-surgical cognitive function. Furthermore, valve replacement surgery might not be associated with a decline in cognitive function. Bivariate correlations exhibited PWV to be significantly correlated with many components of cognitive function, and multiple regression confirmed PWV to be independently related to cognitive function both pre- and postoperatively. Thus, PWV might be useful as an additional indicator for cognitive dysfunction before and after AVR. Nevertheless, further larger studies must show whether PWV is really proficient of going beyond this to show effects of cardiac surgery on cognitive function. Application of PWV measures of aortic stiffness might in future reform the preoperative assessment of cardiac surgical patients, allowing surgeons to better predict postoperative cognitive dysfunction and improve both preoperative consent and risk stratification.
Conflict of interest: none declared.
