


Abstract
Is supraphysiologic estradiol (E2) an independent predictor of low birth weight (LBW) in singletons born after fresh IVF-embryo transfer (ET) cycles?
Our results suggest that E2 > 2500 pg/ml is an independent predictor for LBW in full-term singletons born to normal responder patients undergoing fresh IVF-ET cycles.
The pathogenesis of LBW in IVF singletons remains unknown. However, recent studies have suggested that the hyperestrogenic milieu generated during ovarian stimulation may create a sub-optimal peri-implantation environment, leading to placental dysfunction, and therefore, LBW.
Retrospective cohort study of normal responder patients, <40 years old, undergoing fresh IVF-ET cycles resulting in live singleton births between January 2005 and June 2014.
A total of 6419 patients had live births after fresh IVF-ET during the study period, of which 2348 (36.6%) patients were excluded due to multiple gestation, vanishing twins or incomplete records. Perinatal outcomes recorded for all patients included birth weight, gestational age (GA) at delivery, mode of delivery and gender. Term birth, preterm birth (PTB) and LBW incidence proportions were plotted against E2 level on the day of trigger. The term LBW incidence proportion (i.e. singletons born at GA ≥ 37 weeks with birth weight <2500 g) was considered the primary outcome of interest.
A total of 4071 patients with live singleton births were included. The median age, BMI, E2 level and birth weight for the study cohort was 36 (33–39) years, 22.3 (20.4–25.0) kg/m2, 1554 (1112.7–2179) pg/ml and 3289 (2920–3628) g, respectively. The incidence proportion of LBW rose from 6.4% (E2 2001–2500 pg/ml) to 20.7% (E2 3501–4000 pg/ml), without a corresponding rise in the incidence proportion of PTB. The odds of term LBW with E2 > 2500 pg/ml were 6.1–7.9 times higher compared to the referent E2 group. Multivariable logistic regression analysis revealed that E2 was an independent predictor for term LBW, even after adjusting for age, BMI, race, parity, infertility diagnosis, duration of ovarian stimulation, gonadotropin dosage and method of insemination (adjusted odds ratio 10.8, 95% CI 9.2–12.5). Receiver operating characteristic analysis generated an AUC estimate of 0.85 for E2 level as a predictor of LBW.
The current study did not include analyses of hypertensive disorders of pregnancy or placental abnormalities. Furthermore, all patients were normal responders and of normal BMI, possibly limiting the overall generalizability of the study. Finally, as with any retrospective study, prospective data are required to validate the role of E2 in predicting LBW.
Our results emphasize the importance of minimizing the supraphysiologic elevations of E2 levels during ovarian stimulation in fresh IVF-ET cycles. This, in turn, can optimize the early peri-implantation environment and mitigate adverse perinatal outcomes such as LBW.
Dr Paul J. Christos was partially supported by the following grant: Clinical and Translational Science Center at Weill Cornell Medical College (UL1-TR000457-06).
N/A.
Introduction
Frozen embryo transfer (FET) cycles have rapidly increased in number during the past decade (Pereira and Rosenwaks, 2016). The number of FET cycles has increased by 82.5% between 2006 and 2012 nationally (Shapiro et al., 2014; Center for Disease Control and Prevention, 2016a), and by 27.6% between 2008 and 2010 globally (Dyer et al., 2016). Although several factors such as improved culture media, efficient vitrification techniques and cryopreservation of blastocysts for pre-implantation genetic screening have contributed to the rise of FET cycles, its accelerated adoption also suggests that FET is perceived as a superior treatment modality by many fertility clinics (Maheshwari et al., 2013; Wong et al., 2014).
The theorized benefits of FET over fresh IVF-embryo transfer (ET) are driven by the idea that the former provides a better and physiologic uterine environment for ET (Barnhart, 2014; Weinerman and Mainigi, 2014). This perception has been corroborated further by key findings of investigations reporting improved perinatal outcomes with FET compared to fresh IVF-ET (Ishihara et al., 2014; Maheshwari et al., 2013, 2016; Wennerholm et al., 2013). In contrast, it is thought that the hyperestrogenic milieu due to ovarian stimulation during fresh IVF generates a sub-optimal uterine environment for implantation and placentation, ultimately leading to some adverse perinatal outcomes (Schieve et al., 2002; Kalra and Molinaro, 2008; Kalra et al., 2011; Imudia et al., 2012; Mainigi et al., 2016). For example, Imudia et al. reported that patients with an estradiol (E2) level of >3450 pg/ml during fresh IVF-ET had 9.4 and 4.8 times higher odds of delivering small for gestational age (GA) infants and developing pre-eclampsia, respectively. In a prior study of 2939 live singleton births conceived with fresh IVF-ET, we reported 2.3 times higher odds of term low birth weight (LBW) when the E2 level was >3069.2 pg/ml (Pereira et al., 2015). However, in a follow-up study that compared the perinatal outcomes of 918 fresh IVF-ET and 1273 FET cycles, we found no difference in the mean overall birth weight, or in the incidence of LBW, term LBW or preterm birth (PTB) between the groups (Pereira et al., 2016). Of note, the mean E2 level in this study was 2042.4 (±802.6) pg/ml. Many of the aforementioned studies have suggested that the hyperestrogenic milieu during fresh IVF may contribute to the pathogenesis of LBW, albeit with various confounders. Thus, the primary objective of the current study is to investigate whether supraphysiologic E2 is an independent predictor of LBW in singletons born after fresh IVF-ET cycles.
Materials and Methods
Inclusion and exclusion criteria
All patients undergoing fresh IVF-ET at the Ronald O. Perelman and Claudia Cohen Center for Reproductive Medicine between January 2005 and June 2014 were assessed for potential inclusion. For the purpose of this study, only normal responders undergoing fresh IVF-ET with live singleton births and known perinatal outcomes were included. A patient was considered a normal responder if the following criteria were met: <40 years of age, cycle Days-2/3 FSH level <12 mIU/ml, cycle Days-2/3 anti-müllerian hormone (AMH) level >1 ng/ml, and an antral follicle count (AFC) of 8–15 (Shapiro et al., 2011a). Patients with known polycystic ovarian syndrome (PCOS) as diagnosed by the Rotterdam criteria and those considered high responders based on AFC counts >15 were excluded from the analysis (Shapiro et al., 2011b). The decision to exclude high responders from the current study was to prevent any skewing of adverse perinatal outcomes associated with robust ovarian stimulation in high responders. Furthermore, patients utilizing donor oocytes, those with multiple births, vanishing twins or unknown perinatal outcomes due to incomplete record were excluded.
Ethical approval
The institutional review board at Weill Cornell Medical College approved our study protocol.
Clinical and laboratory protocols
Ovarian stimulation, hCG trigger, oocyte retrieval, and ET were performed based on previously described protocols (Huang and Rosenwaks, 2014). Gonadotropins doses were based on age, BMI (kg/m2), AFC and serum AMH levels. Patients requiring luteal pre-treatment received either oral contraceptive pills (ORTHO-NOVUM® Ortho-McNeil-Janssen Pharmaceuticals, Inc., Titusville, NJ, USA) or 0.1 mg E2 patches (Vivelle-Dot® Novartis Pharmaceuticals Corporation, East Hanover, NJ, USA) prior to ovarian stimulation. All patients underwent uterine cavity evaluation via saline infusion sonography, hysterosalpingography or hysteroscopy.
Ovarian stimulation was initiated with gonadotropins (Follistim, Merck, Kenilworth, NJ, USA; Gonal-F, EMD-Serono Inc., Rockland, MA, USA; and Menopur, Ferring Pharmaceuticals Inc, Parsippany, NJ, USA) (Pereira et al., 2017). Ovulation was suppressed with ganirelix acetate (Merck, Kenilworth, NJ, USA) or leuprolide acetate injections (Abbott Laboratories, Chicago, IL, USA) using previously described protocols (Huang and Rosenwaks, 2014). hCG (Novarel, Ferring Pharmaceuticals Inc, Parsippany, NJ, USA) was the ovulation trigger in all fresh IVF-ET cycles and was administered when two lead follicles attained a mean diameter ≥17 mm. A previously described sliding scale for hCG was used as follows: 10 000 IU for E2 <1500 pg/ml, 5000 IU for E2 1501–2500 pg/ml, 4000 IU for E2 2501–3000 pg/ml and 3300 IU for E2 > 3001 pg/ml (Pereira et al., 2015). All serum E2 measurements were performed in our laboratory using the IMMULITE 2000 Immunoassay System (Siemens, Berlin, Germany). The sensitivity of the E2 assay is 20 pg/ml, with both intra- and inter-assay variation coefficients <10%.
Oocyte retrieval was performed 34–35 h after the hCG trigger. All retrievals were performed under conscious sedation and transvaginal ultrasound guidance with a 30 cm 16 G oocyte aspiration needle (Cook® Medical, Bloomington, IN, USA). For luteal support, all patients received intramuscular progesterone (P) (50 mg daily) irrespective of the hCG trigger dose. The retrieved oocytes were fertilized with conventional insemination or ICSI based on the male partner's semen analysis or the couple's reproductive history (Palermo et al., 2015). Approximately 12–17 h after insemination or sperm injection, the oocytes were examined for fertilization. Embryos were cultured in sequential in-house culture media. The majority of patients underwent ET on Day 3. Patients with several good-quality cleavage-stage embryos on Day 3 were eligible for blastocyst-stage transfer on Day 5 (Pereira et al., 2015). All ETs were performed with Wallace catheters (Smiths Medical Inc., Norwell, MA, USA). There were no major changes in laboratory conditions, culture media or fresh ET technique during the study period.
Study variables
Baseline demographics recorded for each patient included age, gravidity, parity, BMI (kg/m2), race and infertility diagnosis. Baseline IVF characteristics recorded were cycle Days-2/3 FSH level (mIU/ml), cycle Days-2/3 AMH level (ng/ml) and AFC. Ovarian stimulation parameters noted for all patients included duration of ovarian stimulation (days), total gonadotropins administered (IU), E2 level (pg/ml) on the day of hCG trigger, peak endometrial thickness (mm), total number of oocytes retrieved and total number of mature oocytes. The percentage of ICSI cycles (%), fertilization rate (%) and blastocyst-stage ET (%) was also noted.
Any singleton birth >24 weeks of gestation was considered a live singleton birth. The birth weight, GA at delivery, mode of delivery and gender was recorded for all live singletons. PTB was defined as any live birth with GA < 37 weeks, while any live birth at ≥37 weeks GA was considered a term birth. A birth weight of <2500 g was classified as LBW and a birth weight <1500 g was classified as very LBW (VLBW) (Alexander et al., 1996). Any live singleton born ≥37 weeks GA, but with a birth weight of <2500 g and <1500 g was considered a term LBW singleton and term VLBW singleton, respectively (Alexander et al., 1996).
Statistical analysis
Categorical variables were expressed as number of cases (n) with percentage of occurrence (%) and continuous variables were expressed as median (interquartile range [IQR]) or mean ± SD, as appropriate. The Shapiro–Wilk normality test was used to check for normality in addition to visual inspection of the distributions. For the purpose of the study, E2 levels on the day of hCG trigger were taken into account. The incidence proportions of LBW, PTB, term LBW and term VLBW were plotted against E2 levels in increments of 500 pg/ml. Multivariable logistic regression analysis was used to assess whether the outcomes of LBW, PTB, term LBW or VLBW (i.e. separate models for each outcome of interest) could be explained by any of the following variables: age (<35 vs ≥35 years); parity (0 vs ≥1); BMI (<25 vs ≥25 kg/m2); race (white vs non-white); infertility diagnosis (male factor vs others); type of ovarian stimulation protocol (GnRH-agonist vs GnRH-antagonist based); duration of ovarian stimulation (<10 vs ≥10 days); total gonadotropins administered (<2000 vs ≥2000 IU); hCG trigger dose (10 000 IU vs 5000 IU/4000 IU/3330 IU); E2 level (<2500 vs ≥2500 pg/ml); peak endometrial thickness (<10 vs ≥10 mm); ICSI (yes vs no) and blastocyst-stage ET (yes vs no). Potential collinearity between predictors in the models were evaluated prior to the formulation of the final multivariable models. Unadjusted and adjusted odds ratios (ORs) with 95% CI for associations between E2 levels (compared to a referent category) and the aforementioned perinatal outcomes were calculated from the multivariable models. Receiver operating characteristic (ROC) curves were generated for outcome parameters (i.e. LBW, PTB, term LBW and term VLBW) observed to have statistically significant relationships with E2 level (continuous). An AUC estimate was calculated for each ROC curve. Statistical significance was set at P < 0.05 and all statistical analyses were performed using STATA version 14 (StataCorp, College Station, TX).
Results
A total of 6419 patients had live births after fresh IVF-ET during the study period. Of these, 2348 (36.6%) patients were excluded due to the following reasons: multiple gestation (1453 patients), vanishing twins (519 patients) and incomplete records (376 patients). The remaining 4071 patients had live singleton births and met the inclusion criteria. Overall demographics including baseline IVF characteristics, ovarian stimulation parameters and perinatal outcomes of the study cohort are displayed in Table I. Briefly, the median age and BMI of the study cohort was 36 (33–39) years and 22.3 (20.4–25.0) kg/m2, respectively. These patients, who had a mean AFC of 12.9 (±2.14), underwent ovarian stimulation with GnRH-antagonist-based protocols in 72.8% of cycles, with a mean duration of 9.9 (±2.6) days, and required a mean gonadotropin dosage of 2350.9 (±437.1) IU. The median E2 level on the day of hCG trigger was 1554 (1112.7–2179) pg/ml, with the mean number of total and mature oocytes being 11.8 (±2.9) and 10.3 (±2.0), respectively. Of note, the study cohort did not include patients who had declining E2 levels prior to hCG trigger due to coasting. Three thousand four hundred and forty-five (84.6%) patients underwent Day 3 ET; the remaining 626 (15.4%) patients underwent Day 5 ET. Of all live singleton births, 57.0% were born vaginally and 51.6% were male. The median birth weight for the study cohort was 3289 (2920–3628) g. The overall proportions of PTB and LBW were 378/4071 (9.3%) and 209/4071 (5.1%), respectively.
Overall demographics, baseline IVF characteristics, ovarian stimulation parameters and perinatal outcomes of the study cohort (n = 4071).
| Demographics | |
| Age (years) | 36 (33–39) |
| Gravidity | 1.3 (± 0.8) |
| Parity | 0.7 (± 0.2) |
| BMI (kg/m2) | 22.3 (20.4–25.0) |
| Race | |
| White | 2834 (69.6%) |
| Non-white | 1237 (30.4%) |
| Infertility diagnosis | |
| Male factor | 1443 (35.4%) |
| Tubal factor | 179 (4.4%) |
| Others | 2449 (60.2%) |
| Baseline IVF characteristics | |
| Cycle Days-2/3 FSH level (mIU/ml) | 4.12 (± 2.6) |
| Cycle Days-2/3 AMH level (ng/ml) | 1.8 (± 0.6) |
| Antral follicle count | 12.9 (± 2.1) |
| Ovarian stimulation parameters | |
| Ovarian stimulation protocol | |
| GnRH-agonist based | 1106 (27.2%) |
| GnRH-antagonist based | 2965 (72.8%) |
| Duration of ovarian stimulation (days) | 9.9 (± 2.6) |
| Dosage of gonadotropins (IU) | 2350.9 (± 437.1) |
| E2 level on the day of hCG trigger (pg/ml) | 1554 (1112.7–2179) |
| Peak endometrial thickness (mm) | 10.5 (8.80–12.1) |
| Total oocytes retrieved | 11.8 (± 2.9) |
| Mature oocytes retrieved | 10.3 (± 2.0) |
| Fertilization rate (%) | 79.4% |
| Blastocyst-stage ET (%) | 626 (15.4%) |
| Perinatal outcomes | |
| Mode of delivery | |
| Vaginal | 2319 (57.0%) |
| Cesarean | 1752 (43.0%) |
| Gender | |
| Male | 2102 (51.6%) |
| Female | 1969 (48.4%) |
| Birth weight (grams) | 3289 (2920–3628) |
| GA (weeks) | 38 (33–41) |
| Term birth (>37 weeks of gestation) | 3693 (90.7%) |
| PTB (<37 weeks of gestation) | 378/4071 (9.3%) |
| Overall LBW (<2500 g) | 209/4071 (5.1%) |
Data are presented as mean ± SD, median (IQR) and n (%).
LBW, low birth weight; IQR, interquartile range, AMH, anti-müllerian hormone; E2, estradiol; ET, embryo transfer; GA, gestational age; PTB, preterm birth.
Figure 1 highlights the incidence proportions of PTB and LBW plotted against E2 levels. The incidence proportion of LBW rose sharply from 6.43% (E2 range 2001–2500 pg/ml) to 20.7% (E2 range 3501–4000 pg/ml). However, there was no concurrent rise in the incidence proportion of PTB with increasing E2 levels. Of note, there were no differences in the demographics amongst patients with and without LBW singletons. All baseline IVF characteristics and ovarian stimulation parameters were similar with the exception of E2 levels. Given that the rise in LBW paralleled increasing E2 levels, and occurred independently of the PTB incidence proportion, we assessed LBW and VLBW in term live singleton births. The overall incidence proportions of term LBW and term VLBW were 143/4071 (3.5%) and 22/4071 (0.5%), respectively. Figure 2 shows that the incidence proportion of term LBW rose from 5.1% (E2 range 2001–2500 pg/ml) to 10.3% (E2 range 3501–4000 pg/ml), while the incidence proportion of term VLBW remained relatively constant between E2 levels of 2500–4000 pg/ml. As evident in Table II, the unadjusted and adjusted odds of term LBW were higher in the top E2 groups, suggesting an E2-dependent effect. In fact, the odds of term LBW with E2 levels >2500 pg/ml were 6.1–7.9 times higher compared to the referent E2 group.
Odds of term LBW with increasing E2 levels.
| Comparison | Unadjusted OR (95% CI) | P | Adjusted odds ratio (95% CI) | P |
|---|---|---|---|---|
| Referent group E2 <500–1500 pg/ml (n = 1929) | ||||
| E2 1501–2000 pg/ml (n = 858) vs referent | 1.7 (0.2–2.8) | 0.58 | 1.3 (0.3–2.6) | 0.64 |
| E2 2001–2500 pg/ml (n = 669) vs referent | 3.4 (0.55–4.80) | 0.17 | 3.2 (0.2–4.3) | 0.21 |
| E2 2501–3000 pg/ml (n = 385) vs referent | 6.1 (1.80–7.3) | 0.02 | 5.7 (1.6–7.6) | 0.03 |
| E2 3001–3500 pg/ml (n = 163) vs referent | 7.3 (1.9–9.4) | 0.001 | 6.7 (1.4–9.7) | 0.001 |
| E2 3501–4000 pg/ml (n = 58) vs referent | 7.3 (1.7–9.0) | <0.001 | 7.2 (1.9–9.8) | <0.001 |
| E2 > 4000 pg/ml (n = 9) vs referent | 7.9 (2.4–9.7) | <0.001 | 7.8 (2.1–9.9) | <0.001 |
ORs, odds ratios.
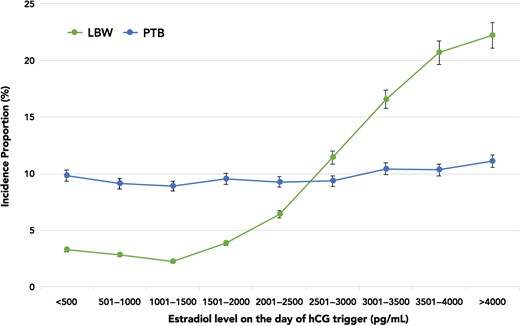
Incidence proportions of LBW and PTB plotted against E2 levels on the day of hCG trigger in increments of 500 pg/ml. LBW, low birth weight; PTB, preterm birth, E2, estradiol.
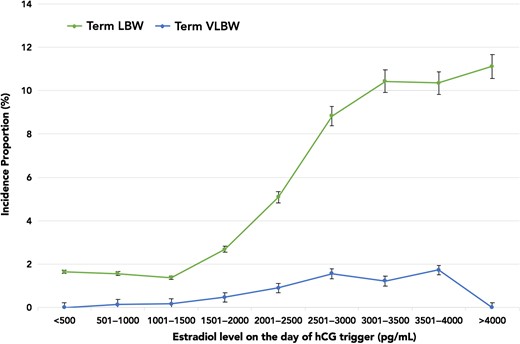
Incidence proportions of term LBW and term VLBW plotted against E2 levels on the day of hCG trigger in increments of 500 pg/ml. VLBW, very low birth weight.
Multivariable logistic regression analysis was performed to address the impact of any confounding variables that could account for the association between peak E2 levels and term LBW. As seen in Table III, E2 levels appeared to be an independent risk factor for term LBW, even after accounting for age, parity, BMI, race, infertility diagnosis, ovarian stimulation protocol, ovarian stimulation duration, hCG trigger dose, gonadotropin dose, endometrial thickness, ICSI and blastocyst-stage transfer (adjusted OR 10.8, 95% CI 9.2–12.5). Of note, while blastocyst-stage ET did not impact the odds of term LBW, the CIs were wide (0.1–6.1), most likely due to small proportion of blastocyst-stage ET (15.4%) in the study cohort. Supplementary data, Fig. S1 is a ROC curve illustrating the performance of E2 level as a predictor of term LBW, with an AUC of 0.85. In contrast to term LBW, an E2-dependant effect was not observed for PTB (adjusted OR 1.1, 95% CI 0.4–2.9) or VLBW (adjusted OR 1.9, 95% CI 0.2–25.1).
Multiple logistic regression analysis to account for confounding variables.
| Term LBW (n = 143) | Unadjusted OR (95% CI) | P | Adjusted OR (95% CI) | P |
|---|---|---|---|---|
| E2 level on the day of hCG trigger (<2500 vs ≥2500 pg/ml) | 12.1 (9.2–15.7) | <0.001 | 10.8 (9.2–12.5) | <0.001 |
| Age (<35 vs ≥35 years) | 0.97 (0.7–1.3) | 0.79 | 0.88 (0.7–1.9) | 0.68 |
| Parity (0 vs ≥1) | 1.08 (0.8–1.7) | 0.69 | 1.01 (0.8–1.4) | 0.45 |
| BMI(<25 vs ≥25 kg/m2) | 0.94 (0.7–1.3) | 0.63 | 1.06 (0.6–2.2) | 0.54 |
| Race (white vs non-white) | 0.82 (0.4–1.8) | 0.37 | 0.74 (0.5–1.9) | 0.16 |
| Infertility diagnosis (male factor vs others) | 1.13 (0.8–1.5) | 0.26 | 1.08 (0.8–1.8) | 0.14 |
| Ovarian stimulation protocol (GnRH-agonist vs GnRH-antagonist based) | 1.04 (0.8–1.8) | 0.21 | 0.94 (0.7–1.9) | 0.15 |
| Duration of ovarian stimulation (<10 vs ≥10 days) | 0.88 (0.7–1.2) | 0.49 | 0.98 (0.6–1.7) | 0.33 |
| Gonadotropin dose (<2000 vs ≥2000 IU) | 1.18 (0.5–2.7) | 0.71 | 1.44 (0.5–3.9) | 0.58 |
| hCG trigger dose (10 000 IU vs 5000 IU/4000 IU/3330 IU) | 0.93 (0.4–1.9) | 0.60 | 1.39 (0.5–2.6) | 0.39 |
| Peak endometrial thickness (<10 vs ≥10 mm) | 0.75 (0.6–1.3) | 0.11 | 0.70 (0.6–1.2) | 0.14 |
| ICSI (yes vs no) | 0.60 (0.2–1.9) | 0.38 | 0.69 (0.4–1.8) | 0.35 |
| Blastocyst-stage ET (yes vs no) | 0.47 (0.1–11.6) | 0.77 | 0.59 (0.1–6.1) | 0.64 |
Discussion
The current retrospective study analyzed 4071 normal responders with live singleton births conceived via fresh IVF-ET. Our findings indicate that E2 on the day of hCG trigger is an independent risk factor for term LBW and that the odds of term LBW are higher with E2 levels >2500 pg/ml. Furthermore, our ROC analysis further confirms the predictive ability of E2 levels for term LBW. It is worthwhile to note that the incidence proportions of PTB and term VLBW did not increase with increasing E2 levels, and that the overall incidence proportions of PTB (9.3%) and LBW (5.1%) in the current study are either comparable or below the 2014 USA national average (Center for Disease Control and Prevention, 2016b). It is also important to note that the statistically significant rise in the incidence proportion of term LBW with increasing E2 levels occurred independent of the PTB incidence proportion.
Several investigators have studied the impact of ovarian stimulation during fresh IVF on the early peri-implantation uterine environment using a variety of techniques. Notably, three-dimensional Doppler ultrasonography has revealed decreased endometrial and subendometrial blood flow in IVF cycles compared to natural cycles (Ng et al., 2004, 2006). Histopathologic evaluation of the endometrium in fresh IVF cycles has shown advancement of endometrial maturation (Kolibianakis et al., 2002), increased endometrial angiogenesis and blood vessel density (Lee et al., 2008), and premature formation of nucleolar channel systems (Zapantis et al., 2013). Gene expression profiles of the stimulated endometrium also reveal disruptions in the transcriptional activity of genes involved in endometrial receptivity (Mirkin et al., 2004; Horcajadas et al., 2005; Haouzi et al., 2009). The aforementioned changes are believed to occur cumulatively due to the hyperestrogenic milieu generated during fresh IVF, which can in turn impair early embryonic adhesion (Valbuena et al., 2001), and, therefore, the implantation potential of embryos. Thus, it is not surprising that the detrimental effects of ovarian stimulation on endometrial receptivity have been expounded in prospective, randomized studies reporting lower implantation and clinical pregnancy rates in fresh IVF cycles compared to rates in FET cycles (Shapiro et al., 2011a, 2011b).
This effect may extend beyond implantation, as adverse perinatal outcomes such as LBW and pre-eclampsia in term singletons have been associated with fresh IVF-ET (Ishihara et al., 2014; Maheshwari et al., 2013, 2016; Wennerholm et al., 2013). This suggests that the hyperestrogenic milieu can influence placentation and, therefore, fetal growth as well (Pereira and Rosenwaks, 2016). The evidence for E2-mediated effects on placental and fetal growth is predominately reported from mouse models. Some investigators (Ertzeid and Storeng, 1992; Ertzeid and Storeng, 2001) have demonstrated that blastocysts from superovulated mice have smaller trophoblastic outgrowths. More recently, Weinerman and Mainigi et al. (2014) reported that fetuses from superovulated mice weighed 25% less than controls. Other investigators have suggested that the impairment in placentation can occur via E2-induced differential expression of the Grb10 gene (Mainigi et al., 2016) and the GATA3 transcription factor (Lee et al., 2016). It is speculated that the aforementioned findings in mouse models could explain some of the clinical findings of LBW associated with fresh IVF-ET in population-based studies. One may also posit that vigorous ovarian stimulation, compared to milder ovarian stimulation, would have a greater detrimental effect on implantation, placentation and subsequent fetal growth (Pereira and Rosenwaks, 2016). For example, in an observational study of 65 868 live singletons, Sunkara et al. (2015) reported higher odds of LBW in patients with excessive ovarian response (>20 oocytes) compared to those with normal ovarian response (10–15 oocytes), and suggested that the supraphysiological E2 levels contributed to the unfavorable outcome of LBW. Furthermore, retrospective data has shown that E2 levels of >3450 pg/ml increases the odds of LBW (Imudia et al., 2012), while lower E2 levels of 2042.4 (±802.6) pg/ml do not seem to have the same impact (Pereira et al., 2016).
The main strength of the current study is its demonstration that E2 is an independent predictor of term LBW in fresh IVF-ET cycles. The formulation of this conclusion was based on the perinatal outcomes of a large sample size, and was reinforced with a ROC analysis and multivariable logistic regression analysis to account for potential confounding variables. Furthermore, our findings suggest that the hyperestrogenic milieu during fresh IVF can impact the perinatal outcomes of singletons in normal responders, independent of the PTB incidence proportion. Despite these strengths, we also acknowledge some limitations. First, our study was retrospective in design; thus, the predictive ability of E2 for term LBW needs prospective validation and calibration in an independent sample of similar patients. Second, given that a majority of our patients return to their home state or country after IVF-ET, our assessment of perinatal outcomes was curtailed by logistics, and, therefore, limited to LBW, VLBW, PTB and term birth incidence proportions. An evaluation of other perinatal outcomes such as hypertensive disorders of pregnancy (pre-eclampsia, gestational hypertension) or placental abnormalities would have certainly strengthened our analysis. Notably, a recent study of 383 live singletons has shed light on placental abnormalities (Royster et al., 2016). Specifically, increased adverse placental outcomes such as placenta accreta, previa, abruption was noted when the peak E2 was >3000 pg/ml, and this trend continued to increase linearly until the peak E2 was >5000 pg/ml. Third, the current study did not account for P levels on the day of hCG trigger. Previous studies have shown that vigorous stimulation without adequate LH-activity during fresh IVF can increase P levels during the late follicular phase (Fleming and Jenkins, 2010), resulting in endometrial asynchrony (Shapiro et al., 2011a, 2011b) that consequently decreases implantation rates (Xu et al., 2012; Venetis et al., 2013). Additionally, P may directly promote vascular proliferation during placentation (Walter et al., 2005). Although assessing a P threshold, in conjunction with E2, for adverse perinatal outcomes may be useful, it must be noted that a high E2 level has shown to be detrimental to uterine receptivity, irrespective of the number of oocytes or the P level on the day of hCG trigger (Simón et al., 1995). Finally, it is also possible that an as yet uncharacterized molecular marker may masquerade as elevated E2 or P levels in fresh IVF cycles (Barnhart, 2014; Cedars, 2016). Furthermore, E2 or P thresholds may be assay and laboratory specific, thereby limiting its generalizability to all IVF clinics.
In conclusion, our results suggest that serum E2 is an independent predictor of term LBW in normal responders undergoing fresh IVF-ET cycles. Thus, as a corollary, the increased odds for term LBW, as well as other perinatal outcomes such as PTB, VLBW, hypertensive disorders of pregnancy and placental outcomes may be amplified in high responders. While several investigators have suggested that the endometrial asynchrony and perinatal morbidity associated with the hyperestrogenic milieu of fresh IVF can be assuaged by FET, one must also take into consideration the adverse perinatal outcomes associated with FET. Recent studies have indicated that live singletons born after FET have a higher risk of macrosomia (Wennerholm et al., 2013; Pinborg et al., 2014) and perinatal mortality (Wennerholm et al., 2013) when compared to live singletons conceived via fresh IVF. Furthermore, in a recent randomized controlled trial of 1508 patients with PCOS who were assigned to either fresh or frozen ET (Chen et al., 2016), a trend toward higher neonatal death was observed in the FET group. Thus, it is evident that FET is not without significant risks. It is also important to note that a recent Cochrane review (Wong et al., 2017) of four randomized clinical trials including 1892 women reported no superiority of FET over fresh IVF-ET in terms of cumulative live birth rates, but did confirm a higher rate of pregnancy complications with FET. These results are juxtaposed to the ongoing global trend toward routine FET.
While maximizing follicular response during fresh IVF is important, it is paramount to minimize the supraphysiologic elevations of E2 during ovarian stimulation in normal and high responders. Conservative, step-down, and combined FSH and LH-activity ovarian stimulation protocols have been highlighted and advocated for this purpose (Pellicer et al., 1996; Pereira et al., 2016). Such an approach decreases the risk of ovarian hyperstimulation syndrome and late follicular rise in P levels, thereby optimizing the early peri-implantation environment (Pellicer et al., 1996). This, in turn, could mitigate the risks of adverse perinatal outcomes and adult-onset diseases associated with LBW (Nesterenko et al., 2009; Visentin et al., 2014 ).
Supplementary data
Supplementary data are available at Human Reproduction online.
Acknowledgements
The authors would like to thank Logan D. Stone for manuscript editing.
Authors’ roles
N.P., R.T.E., A.C.P., K.H., J.P.L. and Z.R.: conception and design of study; acquisition of data; analysis and interpretation of data; drafting the article; revising it critically for intellectual content; final approval of the version to be published. P.J.C.: analysis and interpretation of data; drafting the article; revising it critically for intellectual content; final approval of the version to be published.
Funding
Dr Paul J. Christos was partially supported by the following grant: Clinical and Translational Science Center at Weill Cornell Medical College (UL1-TR000457-06).
Conflict of interest
None declared.
References
Author notes
Oral presentation at the American Society of Reproductive Medicine 2016 Scientific Congress and Expo, Salt Lake City, UT, October 15th to 19th 2016 (NP was recipient of the ASRM Corporate Member Council In-training Travel Grant).
