


Abstract
Mutations in the WNK1 gene cause Gordon's syndrome, a rare Mendelian form of hypertension. We assessed whether common WNK1 variants might also contribute to essential hypertension (EH), a multifactorial disorder affecting >25% of the adult population worldwide. A panel of 19 single nucleotide polymorphisms (SNPs) spanning the gene was selected from public databases and was genotyped in 100 white European families to determine the pattern of linkage disequilibrium, haplotype structure and tagging SNPs for the WNK1 locus. Eight tagging SNPs were identified with 90% power to predict common WNK1 haplotypes and SNPs. Family-based association tests were used to test for association with EH and severity of hypertension in 712 severely hypertensive families from the MRC British Genetics of Hypertension study resource. No association was found between WNK1 polymorphisms or haplotypes with hypertension; however, one SNP rs1468326, located 3 kb from the WNK1 promoter, was found to be nominally associated with severity of hypertension, with both systolic blood pressure (BP) (Z=+2.24, P=0.025) and diastolic BP (Z=+1.99, P=0.046). We also found nominal support for association of one common WNK1 haplotype with increased systolic BP (Z=+1.91, P=0.053). This is the first study to perform haplotype association analysis of the WNK1 gene with EH. This finding of association between a SNP near the promoter region and the severity of hypertension suggests that increased expression of WNK1 might contribute to BP variability and susceptibility to EH similar to the mechanism of hypertension observed in Gordon's syndrome.
INTRODUCTION
Essential hypertension (EH) (MIM 145500) is a major public health problem, affecting >25% of the adult population worldwide, and it contributes to morbidity and mortality from stroke, myocardial infarction, end-stage renal disease and congestive heart failure (1,2). It is a complex disorder, where multiple genetic and environmental factors interact to produce the final phenotype and evidence from both family and epidemiological studies suggests that 30–50% of blood pressure (BP) variation within a population is genetic in origin (3). With the exception of rare Mendelian forms of hypertension, no single gene has been found to have a major affect on BP variation or hypertension as an outcome (4,5). The discovery of the genes responsible for these rare diseases has, however, highlighted new genes and pathways as candidates for EH.
Pseudohypoaldosteronism type II (PHAII) (MIM 145260), or Gordon's syndrome, is a rare Mendelian disorder featuring hypertension, hyperkalemia, hyperchloraemia and metabolic acidosis (6–8). The clinical features of PHAII are chloride dependent and can be corrected with thiazide diuretics, a family of drugs often used to treat patients with EH that act by inhibiting sodium chloride (Na+Cl−) re-absorption in the kidney (9).
Using positional cloning, mutations in two members of a novel family of serine–threonine kinases, WNK1 (MIM 605232, with no K=lysine, encoded by WNK1) and WNK4 (MIM 601844, encoded by WNK4), have been shown to independently cause PHAII (10–12). The WNK1 disease causing mutations are large deletions in the first intron (21 and 42 kb) that increase gene expression and correlate with BP levels (12). The exact mechanism by which these mutations increase WNK1 expression is unknown. In some PHAII patients carrying the WNK1 deletion mutations, hypertension develops following a time course that mimics the onset of EH, raising the possibility that mutations in WNK1 could also contribute to hypertension in the general population (13).
WNK1 is predominantly expressed in the distal nephron of the kidney at sites involved in regulating Na+Cl− re-absorption and studies suggest that increased WNK1 expression, as seen in PHAII patients, would have the net result of increasing Na+ re-absorption leading to volume expansion-induced hypertension (14–20). Indeed, a number of studies have implicated the kidney and disturbances in sodium homeostasis in the aetiology of EH (4,21,22). Thus, WNK1 is an obvious candidate for EH. One study has so far assessed the role of WNK1 in EH. In a population-based association analysis, Kokubo et al. (23) failed to detect association with EH or BP variation in a large Japanese population (771 subjects with hypertension and 1047 controls). To date, however, no study has investigated the association of common WNK1 variants or their haplotypes with EH and BP variations in a Caucasian population.
WNK1 maps to chromosome 12p13.3 and is encoded by 28 exons and spans over 150 kb of genomic DNA (12). Over 100 putative, WNK1 single nucleotide polymorphisms (SNPs) now exist in the public domain that can be used for association analysis (24). By exploiting the pattern of linkage disequilibrium (LD) within the gene, it is possible to identify disease susceptibility alleles via indirect association analysis using haplotype-based methods (25–27). We employed this strategy in the MRC British Genetics of HyperTension (BRIGHT) study to test for association between variants of WNK1 and EH. A secondary analysis tested for association with severity of hypertension as this correlates with increased cardiovascular risk (28,29). A panel of 19 SNPs, approximately one SNP every 10 kb, spanning the length of the WNK1 genomic region was selected from dbSNP and genotyped in 100 white British families to determine the pattern of LD, haplotype structure and ‘tagging SNPs’ (tSNPs) for the WNK1 locus (30–33). We then tested for association between WNK1 tSNPs and haplotypes with EH and severity of hypertension in 712 Caucasian families identified through severely hypertensive probands from the BRIGHT study.
RESULTS
The BRIGHT study TDT resource
As part of the MRC BRIGHT study, a large repository of 712 severely hypertensive families has been established that will allow transmission disequilibrium testing for fine mapping and candidate gene studies. As far as we are aware, this resource represents the largest white European hypertensive TDT population in the world. These families consist of 371 standard trios, with the remaining 341 comprising single parent families, with the proband and multiple siblings. The characteristics of the hypertensive probands are presented in Table 1.
WNK1 polymorphisms
Table 2 shows the 19 WNK1 polymorphisms selected for genotyping in this study. The genomic structure of WNK1 and the relative physical position of the SNPs are presented in Figure 1A. We selected SNPs spaced approximately one SNP every 10 kb from dbSNP, including all non-synonymous coding SNPs (cSNPs) and SNPs immediately 5′ and 3′ of the WNK1 locus. Only three cSNPs, located in exons 1 (rs3168640), 8 (rs2286007) and 13 (rs956868) were polymorphic in our population. The cSNPs lie outside of any functionally important domains (Fig. 1A); the kinase domain is encoded by exons 1–6, the autoinhibitory domain lies within a highly conserved stretch of residues encoded by exons 6 and 7 and the coiled–coiled domains are encoded by exons 7 and 8 and 24 and 25 (10–12,34). Two SNPs, one 5′ (rs1468326) and one 3′ (rs1051669) of WNK1 were validated as candidates for genotyping. No suitable promoter SNPs were identified at the time of the database search. However, the 5′-SNP rs1468326 lies ∼3 kb proximal to the WNK1 promoter region (35). We also selected a number of SNPs that span the region of the PHAII causing deletion mutations in intron 1.
Our goal was not to investigate all of the WNK1 sequence variation, but to generate a set of informative markers that were relatively evenly spaced throughout the gene. The average intermarker distance was ∼9 kb, with the smallest and largest gaps between SNPs being 1.6 and 18.4 kb, respectively. For all assayed SNPs, no significant departure from Hardy–Weinberg equilibrium was found.
WNK1 LD
The 19 polymorphisms were genotyped in 100 families from the BRIGHT TDT resource, and the parents' genotypes were used to determine the pattern of LD and haplotype structure for the WNK1 locus. The families consist of 181 unrelated parents, of whom 105 were hypertensive.
A graphical representation of the pairwise LD as measured by Lewontin's |D′| and r2 is shown in Figure 1B. The SNP rs3168640 (SNP 2) was extremely rare in our population (minor allele frequency, MAF=0.006%) and was therefore excluded from further analysis. The 5′-SNP, rs1468326, lies ∼5 kb from the start of WNK1 displaying little LD with most intragenic markers (max |D′|=0.25, r2=0.02). The average pairwise LD, |D′|, between intragenic WNK1 markers, excluding the 5′-SNP and SNP2, is 0.95 (range 0.33–1; mean r2=0.43, range 0.01–1). The minimum pairwise |D′| was observed between SNPs 11 (rs6489755) and 12 (rs2286007), which flank a 9.9 kb region extending from intron 4 to exon 8. There is little correlation between distance and LD over the WNK1 region. A plot of LD versus intermarker distance shows little relationship between the two (Fig. 1C; |D′| versus distance: ρ=0.069; r2 versus distance: ρ=−0.15); and complete LD as measured by |D′| was found between two of the most widely separated intragenic SNPs (Table 2; SNPs 3 and 18, intermarker distance ∼137 kb, |D′|=1, r2=0.07).
WNK1 haplotype structure
Figure 1D shows the structure of the 16 WNK1 haplotypes with frequencies >1%. Six common haplotypes with frequencies >5% were observed and account for 75% of all haplotypes in our population, with the most common haplotype being present in ∼20% of the population. In total, 37 unique haplotypes were identified (data not shown), 16 of which account for >90% of all chromosomes in the population (Fig. 1D).
WNK1 tagging SNPs
As there is significant LD operating over the entire genomic region of WNK1 and as there is currently no consensus on how to define haplotype blocks or their boundaries, we treated the WNK1 locus as a single block for tSNP selection. We found a subset of eight tSNPs that had >90% power to predict common WNK1 haplotypes and the remaining SNPs from the larger panel of markers (minimum Rh2=100%; Rs2=94%). The eight tSNPs are indicated in Table 2 along with the associated coefficients of determination Rs2 for the untyped SNPs.
TDT analysis
No statistically significant association was found between EH and any of the tSNPs individually. The strongest support for association, although not statistically significant, was found with the 5′-SNP rs1468326 (Z=+1.499, P=0.134) with allele ‘C’ being over-transmitted in our population (Table 3). The estimated genotype relative risk (GRR) for this SNP is 1.24 (95% CI 0.94–1.64).
Haplotype analysis revealed the tSNP haplotype ‘AGCCTCCG’, which exclusively tags the WNK1 haplotype h10, to be significantly under-transmitted in the hypertensive offspring [Table 4, Z=−2.457, P=0.014, GRR 0.25 (95% CI 0.01–0.65)]. This suggests that h10 could be protective, as we would expect BP lowering variants to be under-represented in a hypertensive population.
Suggestive data were also found for under-transmission of the tSNP haplotype ‘AACCCCCG’ [Z=−1.944, P=0.052, GRR 0.42 (95% CI 0.12–0.94)]. This tSNP haplotype predicts the WNK1 haplotype h15 (Fig. 1D). The strongest support for over-transmission in our population was obtained for the common tSNP haplotype ‘CACCCCCG’ [Table 4; Z=+1.288, P=0.198, GRR 1.21 (95% CI 0.91–1.62)]. This tSNP haplotype tags the WNK1 haplotype h4 (Fig. 1D).
Quantitative TDT analysis
Data in humans and animal models suggest that WNK1 expression may be directly correlated with BP levels (12,36). Therefore, if WNK1 modulates BP variation in the general population, we can postulate that analysis of BP as a quantitative trait, albeit in a hypertensive resource, might reveal variants that lower or increase BP by a few millimetres of mercury, and thus influence the severity of hypertension in our population. To test this hypothesis, we performed quantitative analysis between WNK1 tSNPs and their haplotypes with BP measurements at diagnosis using the phenotype-based extension of the family-based association test (FBAT). Age and sex were included as covariates, as both variables were significant predictors of these BP phenotypes in linear regression analysis; body mass index (BMI) was not a significant predictor of either systolic (SBP) or diastolic (DBP) in our population (data not shown).
Quantitative analysis revealed significant association between the 5′ tSNP rs1468326 and the severity of hypertension for both SBP and DBP (Table 3; SBP: Z=+2.241, P=0.025; DBP: Z=+1.992, P=0.046). Allele ‘C’ of rs1468326 is over-transmitted in our hypertensive population and is positively associated with both SBP and DBP.
Haplotype analysis found significant association of the apparently protective haplotype h10, ‘AGCCTCCG’, with SBP and DBP (Table 4; SBP: Z=−2.3, P=0.017; DBP: Z=−2.567, P=0.01). This haplotype is characterized by the presence of allele ‘A’ of the 5′ marker rs1468326, which was found to be negatively associated with SBP and DBP in single tSNP analysis. The association with haplotype h10 is greatly reduced when the 5′ marker is dropped from haplotype analysis (Z=−0.88, P=0.37) (data not shown). Recall haplotype h10 was also negatively associated with EH. When allele ‘A’ of rs1468326 is replaced by allele ‘C’ (haplotype h6: ‘CGCCTCCG’), there is no evidence of association with EH or BP variation (P>0.6).
Haplotype analysis also reveals nominal positive association between the SBP and the tSNP haplotype ‘CACCCCCG’ (Table 4; WNK1 haplotype h4). This common WNK1 haplotype achieves the highest positive score statistic in association tests with EH, SBP and DBP (EH: Z=+1.288, P=0.198; SBP: Z=+1.912, P=0.053; DBP: Z=+1.299, P=0.194). Although the results are not statistically significant at the 5% level, there is a trend towards haplotype h4 being positively associated with both EH and severity of hypertension. Substitution of allele ‘C’ of the 5′ marker rs1468326 for allele ‘A’, results in the tSNP haplotype h15 ‘AACCCCCG’, which shows nominal evidence for being negatively associated with SBP and DBP and was under-transmitted in our hypertensive resource (EH: Z=−1.944, P=0.052, SBP: Z=−1.507, P=0.131; DBP: Z=−1.732, P=0.078). Thus, the haplotypes h4 ‘CACCCCCG’ and h15 ‘AACCCCCG’ differ by only one allele at the 5′-SNP rs1468326 and show completely opposite trends towards association with EH and severity of hypertension (similar to the results seen in single SNP analysis with this marker). The same trends for association are seen in association tests with all three traits.
There are a relatively limited number of informative families in our TDT resource for any given haplotype. This, in combination with the small number individuals homozygous for the associated haplotypes (data not shown), prevents us from determining the true quantitative impact that these variants may have on BP variation. Interestingly, however, the mean SBP in few millimetres of mercury in individuals carrying zero, one or two copies of the associated haplotype h4 ‘CACCCCCG’ was 163.44 (±16.01, n=517), 166.66 (±15.16, n=131) and 169.08 (±14.45, n=13), respectively. Only a fraction of the affected probands were carriers of either haplotypes h10 (n=11) or h15 (n=10). No homozygous individuals were observed. Therefore, similar calculations would not be meaningful for these haplotypes.
DISCUSSION
We tested for association among eight WNK1 tSNPs and their haplotypes with EH and severity of hypertension in a large family-based Caucasian hypertensive resource from the UK. We postulated that in any large hypertensive population there will be variation in the severity of hypertension, therefore, quantitative analysis in such a selected population might also identify genetic variants that contribute to severity of hypertension. We found no association of WNK1 with EH, but observed suggestive evidence for association between variants of WNK1 and severity of hypertension. The estimated GRR of 1.24 (95% CI 0.94–1.64) for the associated 5′-SNP (rs1468326) and GRR of 1.21 (95% CI 0.91–1.62) for haplotype h4 suggest that WNK1 may not represent a major gene for EH. Our data are nominally significant and should therefore be treated with caution until replication; however, we believe that the data presented here warrant further investigation of WNK1 and its potential role in EH and BP regulation.
To date, only one other study has assessed the relationship between common variants in the WNK1 gene with EH. Kokubo et al. (23) tested for association among seven WNK1 SNPs and EH in 1818 Japanese individuals, 771 of whom were hypertensive. They found no association with any of the SNPs tested. These results are in contrast to our findings; however, it is difficult to directly compare studies, as both represent different study designs with different ascertainment criteria. The demographic characteristics of the hypertensive individuals in their population were not reported, and thus it is difficult to comment on any clinical differences that might exist between the two populations. In contrast to our study, however, Kokubo et al. (23) did not conduct any haplotype analysis or consider quantitative BP phenotypes in association tests with WNK1. In addition, no promoter or 5′-SNPs were included in their study. Our study found nominally significant association of a single SNP 5′ of the WNK1 gene (rs1468326, C/A) with severity of hypertension. Strikingly, all evidence for association of the WNK1 haplotypes with both EH and BP appears to depend on this 5′-SNP; replacement of allele ‘C’ in an associated haplotype by the alternative allele ‘A’ reversed the direction of the association. Moreover, when this SNP is dropped from haplotype analysis, all evidence for association with these WNK1 haplotypes is lost (data not shown). These results are suggestive of the 5′-SNP being associated with severity of hypertension.
The associated SNP lies ∼3 kb proximal to the WNK1 promoter region (35) and displays little LD with any of the intragenic markers that were studied. Given its position, however, it is feasible that this 5′-SNP could be in LD with functional promoter variants that could alter WNK1 expression and therefore affect BP. Although our haplotype tagging approach is likely to have captured most of the common WNK1 variation, it is possible that some variants were not represented by the tSNPs and haplotypes studied, especially within the WNK1 regulatory regions and functional domains. Currently, there are no validated WNK1 promoter SNPs in the public databases. The identification of promoter SNPs will greatly facilitate further investigation of WNK1 in EH and BP variations.
Increased WNK1 expression causes PHAII in humans and decreased levels of expression in heterozygous knockout mice lead to decreased BP (12,36). This suggests that any functional variant which alters WNK1 expression will have an effect on BP; although, we would expect the magnitude of variation to be less than that observed in mice lacking one copy of the gene (∼12 mmHg). It is likely that common functional WNK1 variants will not affect human BP levels by more than a few millimetres of mercury. However, there is evidence from epidemiological studies that an increase in BP by a few millimetres of mercury, for example as a result of particular genetic variant, could significantly enhance the risk of target-organ damage, especially when combined with the added affects from other genes and environmental factors (29,37). This is particularly relevant in the context of EH as a complex disease, where mounting evidence suggests that multiple genes with modest or minor influences on BP levels may contribute to disease susceptibility (38–40).
The results presented here have not been corrected for multiple testing. The common strategy of Bonferroni correction is overly conservative, even when the tests are independent (41) and can lead to a loss of power when considering multiple SNPs in LD. Stepwise alternatives (42,43) are more powerful, but still fail to account for any non-independence between tests (44)—an important issue when testing multiple SNPs in tight LD. Instead, we interpret our results under a Bayesian framework (45,46) which suggests that P-values should be interpreted with reference to the a priori probability of an association. Under this framework, a P-value of around 10−4 is appropriate for a candidate gene for which the prior odds of association are about 1000:1. We do not achieve this level of significance. However, in light of WNK1 function and data from animal models, we could argue for larger prior odds of association, and hence declare significance, but we resist this temptation. Similarly, if we use the approximation suggested by Nyholt (47), a solution to the problem of non-independence due to LD, our results are non-significant. Instead, we view these results as suggestive evidence for association and acknowledge that further work will be needed to confirm the results of this study.
In summary, we have conducted the first haplotype tagging analysis of the WNK1 gene with EH and BP phenotypes. We have found nominally significant association which appears to depend on a 5′-SNP proximal to the WNK1 promoter. The data presented here support the hypothesis that common WNK1 variants could contribute to BP variation and increase susceptibility to human EH. However, further analysis in other populations and functional studies will be required to elucidate the role of these variants in BP variation and susceptibility to EH.
MATERIAL AND METHODS
Study population
As part of the MRC BRIGHT study (http://www.brightstudy.ac.uk), over 800 hypertensive families of white European ancestry have been recruited to allow transmission disequilibrium testing (48). Family ascertainment and phenotyping were performed as described previously (38). Briefly, families were included if the hypertensive proband had BP readings ≥150/100 mmHg based on one reading or ≥145/95 mmHg based on the mean of three readings. BP was recorded with the Omron HEM-705CP portable semi-automated oscillometric device (Omron Healthcare, Mannheim, Germany). Patients receiving anti-hypertensive treatment were included only if hypertension was well documented before treatment. Hypertensive subjects were excluded if they self-reportedly consumed >21 U of alcohol per week; have diabetes; evidence of primary renal disease; a self-reported history of secondary hypertension that was corroborated by the family physician or had a co-existing confounding illness. We aimed to recruit probands with a BMI <30 kg/m2; individuals with BMI of >35 kg/m2 were excluded. All subjects participated as volunteers and were recruited via hypertension registers from the MRC General Practice Framework in the UK and Scottish hypertension clinics. We obtained Ethics Committee approval from the multi- and local-research committees of the partner institutes, and all participants gave informed written consent. DNA was extracted from whole blood using a modified salting-out method (49). After phenotyping and paternity checks, 88 families were excluded from the study. In total, 712 families were included in the present analysis. These families consist of one or more severely hypertensive offspring of white European ancestry up to the level of grandparents, in whom hypertension was diagnosed before the age of 60, and other family members usually both parents or a single parent and other siblings.
SNP identification
In order to identify a set of SNPs for haplotype association analysis, we searched public databases using the SNP search tool available at the Institute of Human Genetics, Technical University Munich and GSF National Research Centre's web site (http://ihg.gsf.de/ihg/snps.html). This database contains all entries of dbSNP which were mapped to the human genome assembly by the National Center for Biotechnology Information (NCBI). Data were based on NCBI build 34 (July 2003). The database was searched using WNK1 chromosomal coordinates, chr12:732 992–888 219, obtained from the UCSC Genome Bioinformatics Site (http://genome.ucsc.edu).
Genotyping
All genotyping was performed using the Taqman assay developed by Applied Biosystems, followed by allelic discrimination using the ABI PRISM 7900HT Sequence Detection System and software (SDSv2.0, Applied Biosystems) (50,51). Specific WNK1 SNP Taqman probes and primers were obtained from Applied Biosystems Assay-by-Design™ Service for SNP genotyping (available on request). The average rate of success for each genotyped SNP was 98%. We tested for any Mendelian inconsistencies/genotyping errors using the program PEDCHECK (52). All genotyping errors were manually resolved by checking raw genotype data, individuals were either blanked (zeroed) or corrected prior to analysis.
LD analysis, haplotype estimation and tSNP selection
To estimate the pattern of LD, haplotype structure and to determine the tagging SNPs, we genotyped 19 WNK1 SNPs in a subset of the TDT population (n=100 families). The parental haplotype data were used to explore the pattern of LD within the gene. The proband's genotypes were used to help resolve phase and identify major haplotype missassignments in the parents that are detected as Mendelian inconsistencies using PEDCHECK (52). Hardy–Weinberg equilibrium was assessed by the chi square test with one degree of freedom in all parents (n=181). LD between SNPs was estimated using the program ldmax (53) and visualized using displd (available at C. Wallace's web site, http://www.qmul.ac.uk/~hhw159/perlprogs/). Lewontin's |D′| and the correlation coefficient r2 were used as a measures of LD between SNPs (54–56). To assess the relationship between |D′| and r2 with distance, Spearman's correlation coefficient ρ was calculated using SPSS v12 software (SPSS, Chicago, IL, USA). WNK1 haplotypes and their estimated frequencies were defined using the program PHASE v2.1 (57). Haplotype structure and frequencies are reported for the parents only.
For tSNP selection, parental haplotypes were determined using the EM algorithm, implemented in SNPHAP v1.2 (D. Clayton's web site, http://www.gene.cimr.-cam.ac.uk/clayton), and all possible haplotypes weighted by their posterior probabilities were used to determine a tSNP set using the STATA utility htSNP2 [D. Clayton's web site; (58); StataCorp. 2003. Stata Statistical Software: Release 8. College Station, TX, USA: StataCorp. LP.]. Two cSNPs, rs2286007 in exon 8 and rs956868 in exon 13, were forced in as part of the tSNP set prior to the search. Using criteria suggested by Stram et al. and others (31,32,58,59), we used a combination of stepwise selection and exhaustive searches of all possible subsets of SNPs to determine the smallest set of tSNPs which tagged the remainder with a minimum allelic Rs2 of 80% and also predicted common haplotypes with a minimum haplotype Rh2 of 80%. The haptag function in htSNP2 was used to assess the power of the tSNPs based on the coefficients of determination Rs2 and Rh2 (31,32,58,59). These measures relate directly to the power to predict allele frequencies at untyped loci and WNK1 haplotypes.
Statistical analysis
The TDT proposed by Spielman et al. (48) is a test for association and linkage or linkage in the presence of association; the test procedure compares how many times a heterozygous parent transmits a variant of a genetic marker to an affected offspring with the number of times that they transmit the alternate allele. For simplicity, we use the word ‘association’ to describe the combined alternative hypothesis. The TDT has been extended by Rabinowitz and Laird (60) and Laird et al. (61). Their class of FBATs are based around the calculation of a score for the genotype of the affected offspring. The observed score is compared with its expectation conditional on the sufficient statistics for any nuisance parameters under the null (60,61). The statistic used for the comparison is S=ΣijT [xij−E(xij)], where Tij and Xij are some functions of the trait value and genotype, respectively, for the jth offspring of the ith family. A further extension (HBAT) has been developed which will deal with the transmission of multilocus haplotypes even in the presence of missing parental genotypes and unknown phase (62). These methods are robust against population stratification. We used the software FBAT v1.5.1 and its haplotype extension (HBAT) (63,64) to test for association between individual WNK1 tSNPs and their haplotypes with EH and the quantitative phenotypes of SBP and DBP at the time of diagnosis. We were able to obtain BP readings from all families included in the study from GP records at the time of their diagnosis, individuals receiving any anti-hypertensive medication were excluded from this analysis. The majority of the probands (n=661) had three BP readings taken, the remaining 51 probands had only one BP measurement. We only included the mean BP levels for the 661 probands with three readings in the quantitative analysis. Age and sex were included as covariates for the analyses of quantitative traits and an additive genetic model was assumed throughout, as this model performs well across a range of possible genetic models (65,66). P-values were computed using 100 000 Monte-Carlo permutations and are presented together with the normalized statistic Z=S/Var(S). We use the term ‘positive association’ to describe the situation where the Z statistic is positive and statistically significant, and use the term ‘negative association’ when Z is negative and statistically significant (this is different from ‘no association’). We have used a threshold of P<0.05 to infer statistical significance. GRRs were estimated from the TDT analysis using the methods proposed by Kazeem and Farrall (67).
ACKNOWLEDGEMENTS
We are extremely grateful to The British Heart Foundation for funding the research, the BRIGHT nursing team and the British Public for their generous cooperation. S.J.N. is funded by a Medical Research Council PhD Studentship, grant number G78/7210 and by the William Harvey Research Foundation. This work was also supported by a programme grant from the Medical Research Council, G9521010D. C.W. is supported by the Research Advisory Board of the St Bartholomew's and The Royal London Charitable Foundation; grant number RAB03/PJ/01.
Conflict of Interest statement. None declared.
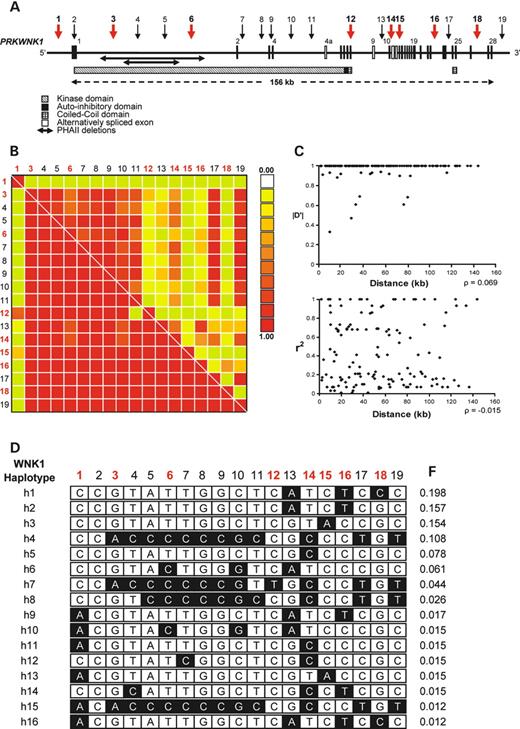
Figure 1. All SNPs are denoted numerically with reference to Table 2 and tSNPs are indicated in red. (A) Genomic structure of the human WNK1 gene showing the relative physical position of the 19 genotyped SNPs. Exons are indicated by the vertical black bars and alternatively spliced exons by the white boxes. The functional domains of the WNK1 protein are also indicated along with the position of the 21 and 42 kb PHAII causing deletions in intron 1. (B) A graphical overview of the pairwise LD operating over the WNK1 region in 181 parents. LD as measured by |D′| is shown below the diagonal, with the correlation coefficient r2 above the diagonal. SNP 2 was excluded from LD analysis because of its low MAF. (C) Plots of LD versus intermarker distance for both |D′|, top panel, and r2, bottom panel. Spearman's correlation coefficient ρ was calculated to assess the relationship between LD and distance for both |D′| and r2. (D) Estimated WNK1 haplotypes and frequencies (F) that account for ∼90% of all chromosomes in 181 parents; minor alleles are indicated in black.
Demographics of the hypertensive probands
| Characteristics | |
|---|---|
| No. of pedigrees | 712 |
| No. of hypertensive offspring | 728 |
| Gender male/female | 329/399 |
| Mean age at diagnosis | 39 (9.8) |
| Blood pressure | |
| Mean diagnosis systolic (mmHg) | 164.2 (15.8) |
| Mean diagnosis diastolic (mmHg) | 103.3 (8.7) |
| Mean systolic at phenotyping (mmHg) | 146.7 (17.7) |
| Mean diastolic at phenotyping (mmHg) | 94 (10.4) |
| Median BMI (kg/m2) | 25 (25–30)a |
Demographics of the hypertensive offspring are expressed as mean and standard deviation ( ).
aInterquartile range.
WNK 1 single nucleotide polymorphisms
| WNK1 SNP | dbSNP accession no. | Allelic Rs2 | WNK1 region | Chr12 nt position (bp)a | Intermarker distance (bp) | Allelesb | Minor allele frequencyc |
|---|---|---|---|---|---|---|---|
| 1 | rs1468326 | tSNP 1 | 5′ | 727 762 | 5 488 | C/A | 0.114 |
| 2 | rs3168640 | — | Ex1 | 733 250 | 15 675 | C/T | 0.006 |
| 3 | rs2369402 | tSNP 2 | In1 | 748 925 | 9 764 | G/A | 0.181 |
| 4 | rs2107613 | 93.309 | In1 | 758 689 | 9 972 | T/C | 0.204 |
| 5 | rs724709 | 93.079 | In1 | 768 661 | 9 883 | A/C | 0.208 |
| 6 | rs765250 | tSNP 3 | In1 | 778 544 | 18 419 | T/C | 0.280 |
| 7 | rs4388955 | 93.079 | In2 | 796 963 | 8 143 | T/C | 0.249 |
| 8 | rs1159744 | 93.079 | In2 | 805 106 | 1 623 | G/C | 0.204 |
| 9 | rs2158502 | 93.079 | In3 | 806 729 | 15 307 | G/C | 0.205 |
| 10 | rs1990021 | 100 | In4 | 822 036 | 9 561 | C/G | 0.286 |
| 11 | rs6489755 | 91.387 | In4 | 831 597 | 9 955 | T/C | 0.172 |
| 12 | rs2286007 | tSNP 4 | Ex8 | 841 552 | 13 737 | C/T | 0.054 |
| 13 | rs4980974 | 100 | In9 | 855 289 | 3 530 | G/A | 0.463 |
| 14 | rs880054 | tSNP 5 | In10 | 858 819 | 2 354 | T/C | 0.372 |
| 15 | rs956868 | tSNP 6 | Ex13 | 861 173 | 10 895 | C/A | 0.177 |
| 16 | rs953361 | tSNP 7 | In22 | 872 068 | 2 030 | C/T | 0.401 |
| 17 | rs2301880 | 93.079 | In23 | 874 098 | 11 632 | C/T | 0.212 |
| 18 | rs2286028 | tSNP 8 | In26 | 885 730 | 6 983 | G/C | 0.201 |
| 19 | rs1051669 | 93.079 | 3′ | 892 713 | — | C/T | 0.226 |
Shown here are the 19 WNK1 SNPs genotyped in 181 founders to determine LD, haplotype structure and tagging SNPs (tSNPs, indicated in bold). SNPs are presented in chromosomal order and their location within the gene indicated. Rs2 was not calculated for SNPs with MAFs <1%.
aPosition in base pair derived from UCSC July 2003 Chromosome 12 assembly (UCSC genome bioinformatics site; http://genome.ucsc.edu).
bMajor/minor allele.
cMinor allele frequency in 181 founders. 5′, 5 prime; 3′, 3 prime; Ex, exon; In, intron.
WNK1 tagging SNP analysis
| tSNP | Allelea | F | Fam | EH | SBP | DBP | ||||
|---|---|---|---|---|---|---|---|---|---|---|
| Z | P-value | Z | P-value | Z | P-value | |||||
| 1 | rs1468326 | C/A | 0.895 | 188 | 1.499 | 0.134 | 2.241 | 0.025 | 1.992 | 0.046 |
| 2 | rs2369402 | G/A | 0.785 | 282 | 0.307 | 0.758 | 0.368 | 0.712 | 0.916 | 0.359 |
| 3 | rs765250 | T/C | 0.696 | 327 | 0.710 | 0.478 | 0.680 | 0.497 | 1.298 | 0.194 |
| 4 | rs2286007 | C/T | 0.926 | 124 | 0.317 | 0.751 | −0.024 | 0.980 | 0.513 | 0.607 |
| 5 | rs880054 | T/C | 0.565 | 378 | −0.122 | 0.903 | −0.250 | 0.802 | −0.285 | 0.775 |
| 6 | rs956868 | C/A | 0.848 | 235 | −0.118 | 0.906 | −0.413 | 0.679 | 0.500 | 0.617 |
| 7 | rs953361 | C/T | 0.603 | 358 | 0.389 | 0.697 | −1.067 | 0.286 | −1.392 | 0.164 |
| 8 | rs2286028 | G/C | 0.809 | 268 | −0.453 | 0.651 | −1.244 | 0.213 | −0.626 | 0.531 |
Tagging SNPs are presented in physical order. F, major allele frequency; Fam, number of informative families; EH, essential hypertension; SBP, systolic blood pressure; DBP, diastolic blood pressure. The Z statistics shown relate to the major allele (the Z statistic for the minor alleles being the negative of those shown).
aThe alleles are listed as major/minor allele.
WNK1 tSNP Haplotype analysis
| tSNP haplotypea | WNK1 haplotypeb | F | Fam | EH | SBP | DBP | |||
|---|---|---|---|---|---|---|---|---|---|
| Z | P-value | Z | P-value | Z | P-value | ||||
| CGTCTCTC | h1 | 0.172 | 204 | 0.194 | 0.846 | 0.639 | 0.530 | 0.664 | 0.511 |
| CGTCTCTG | h2 | 0.154 | 202 | −0.338 | 0.735 | −0.615 | 0.542 | 0.222 | 0.820 |
| CGTCCCCG | h5 | 0.143 | 170 | 0.643 | 0.520 | 0.787 | 0.445 | 0.423 | 0.673 |
| CGTCTACG | h3 | 0.122 | 173 | 0.885 | 0.376 | 0.458 | 0.651 | 0.370 | 0.705 |
| CACCCCCG | h4 | 0.118 | 147 | 1.288 | 0.198 | 1.912 | 0.053 | 1.299 | 0.194 |
| CACTCCCG | h7 | 0.055 | 87 | −0.947 | 0.343 | −0.362 | 0.724 | −1.135 | 0.259 |
| CGCCTCCG | h6 | 0.047 | 77 | −0.086 | 0.932 | −0.812 | 0.417 | −0.102 | 0.918 |
| CGCCCCCG | h8 | 0.035 | 49 | 0.046 | 0.963 | 0.009 | 0.996 | 0.102 | 0.904 |
| CGTCCCTG | h14 | 0.022 | 36 | −0.274 | 0.784 | −0.211 | 0.822 | 0.376 | 0.713 |
| AGTCCCCG | h11 | 0.018 | 33 | −0.406 | 0.685 | −0.977 | 0.324 | −0.192 | 0.856 |
| AGTCTCTC | h16 | 0.013 | 21 | 1.189 | 0.234 | 0.668 | 0.516 | 0.256 | 0.805 |
| AACCCCCG | h15 | 0.012 | 22 | −1.944 | 0.052 | −1.507 | 0.131 | −1.732 | 0.078 |
| AGTCTCTG | h9 | 0.012 | 23 | −0.520 | 0.603 | −1.031 | 0.309 | −0.499 | 0.631 |
| AGCCTCCG | h10 | 0.010 | 17 | −2.457 | 0.014 | −2.300 | 0.017 | −2.567 | 0.010 |
| AGTCTACG | h13 | 0.010 | 17 | 0.036 | 0.971 | −1.003 | 0.331 | −1.093 | 0.285 |
F, frequency; Fam, number of informative families; EH, essential hypertension; SBP, systolic blood pressure; DBP, diastolic blood pressure; Z, raw score statistic; all P-values are based on 100 000 Monte-Carlo permutations. Significant and nominal results are presented in bold.
aIndividual tSNP alleles are presented in physical order tSNP1–tSNP8.
bThis indicates the 19 SNP WNK1 haplotypes as predicted by the adjacent tSNP haplotype, haplotypes are numbered with reference to Figure 1D and presented in order of frequency.
References
Mosterd, A., D'Agostino, R.B., Silbershatz, H., Sytkowski, P.A., Kannel, W.B., Grobbee, D.E. and Levy, D. (
Rodgers, A., Ezzati, M., Vander Hoorn, S., Lopez, A.D., Lin, R.B. and Murray, C.J. (
Ward, R. (
Lifton, R.P., Gharavi, A.G. and Geller, D.S. (
Luft, F.C. (
Paver, W.K. and Pauline, G.J. (
Schambelan, M., Sebastian, A. and Rector, F.C., Jr (
Gordon, R.D. (
Mayan, H., Vered, I., Mouallem, M., Tzadok-Witkon, M., Pauzner, R. and Farfel, Z. (
Xu, B., English, J.M., Wilsbacher, J.L., Stippec, S., Goldsmith, E.J. and Cobb, M.H. (
Verissimo, F. and Jordan, P. (
Wilson, F.H., Disse-Nicodeme, S., Choate, K.A., Ishikawa, K., Nelson-Williams, C., Desitter, I., Gunel, M., Milford, D.V., Lipkin, G.W., Achard, J.M. et al. (
Achard, J.M., Warnock, D.G., Disse-Nicodeme, S., Fiquet-Kempf, B., Corvol, P., Fournier, A. and Jeunemaitre, X. (
Choate, K.A., Kahle, K.T., Wilson, F.H., Nelson-Williams, C. and Lifton, R.P. (
Kahle, K.T., Wilson, F.H., Leng, Q., Lalioti, M.D., O'Connell, A.D., Dong, K., Rapson, A.K., MacGregor, G.G., Giebisch, G., Hebert, S.C. et al. (
Wilson, F.H., Kahle, K.T., Sabath, E., Lalioti, M.D., Rapson, A.K., Hoover, R.S., Hebert, S.C., Gamba, G. and Lifton, R.P. (
Yang, C.L., Angell, J., Mitchell, R. and Ellison, D.H. (
Kahle, K.T., Gimenez, I., Hassan, H., Wilson, F.H., Wong, R.D., Forbush, B., Aronson, P.S. and Lifton, R.P. (
Kahle, K.T., Macgregor, G.G., Wilson, F.H., Van Hoek, A.N., Brown, D., Ardito, T., Kashgarian, M., Giebisch, G., Hebert, S.C., Boulpaep, E.L. et al. (
Kahle, K.T., Wilson, F.H., Lalioti, M., Toka, H., Qin, H. and Lifton, R.P. (
Guyton, A.C., Coleman, T.G., Young, D.B., Lohmeier, T.E. and DeClue, J.W. (
Guyton, A.C. (
Kokubo, Y., Kamide, K., Inamoto, N., Tanaka, C., Banno, M., Takiuchi, S., Kawano, Y., Tomoike, H. and Miyata, T. (
Sherry, S.T., Ward, M.H., Kholodov, M., Baker, J., Phan, L., Smigielski, E.M. and Sirotkin, K. (
Slatkin, M. and Excoffier, L. (
Rioux, J.D., Daly, M.J., Silverberg, M.S., Lindblad, K., Steinhart, H., Cohen, Z., Delmonte, T., Kocher, K., Miller, K., Guschwan, S. et al. (
Clark, A.G. (
Tiago, A.D., Nkeh, B., Candy, G.P., Badenhorst, D., Defterios, D., Brooksbank, R., Nejthardt, M., Luker, F., Milne, J., Woodiwiss, A.J. et al. (
Pastor-Barriuso, R., Banegas, J.R., Damian, J., Appel, L.J. and Guallar, E. (
Johnson, G.C., Esposito, L., Barratt, B.J., Smith, A.N., Heward, J., Di Genova, G., Ueda, H., Cordell, H.J., Eaves, I.A., Dudbridge, F. et al. (
Chapman, J.M., Cooper, J.D., Todd, J.A. and Clayton, D.G. (
Stram, D.O., Haiman, C.A., Hirschhorn, J.N., Altshuler, D., Kolonel, L.N., Henderson, B.E. and Pike, M.C. (
Xu, B.E., Min, X., Stippec, S., Lee, B.H., Goldsmith, E.J. and Cobb, M.H. (
Delaloy, C., Lu, J., Houot, A.M., Disse-Nicodeme, S., Gasc, J.M., Corvol, P. and Jeunemaitre, X. (
Zambrowicz, B.P., Abuin, A., Ramirez-Solis, R., Richter, L.J., Piggott, J., BeltrandelRio, H., Buxton, E.C., Edwards, J., Finch, R.A., Friddle, C.J. et al. (
Lewington, S., Clarke, R., Qizilbash, N., Peto, R. and Collins, R. (
Caulfield, M., Munroe, P., Pembroke, J., Samani, N., Dominiczak, A., Brown, M., Benjamin, N., Webster, J., Ratcliffe, P., O'Shea, S. et al. (
Province, M.A., Kardia, S.L., Ranade, K., Rao, D.C., Thiel, B.A., Cooper, R.S., Risch, N., Turner, S.T., Cox, D.R., Hunt, S.C. et al. (
de Lange, M., Spector, T.D. and Andrew, T. (
Holm, S. (
Hochberg, Y. (
Westfall, P.H. and Young, S.S. (
Thomas, D.C. and Clayton, D.G. (
Wacholder, S., Chanock, S., Garcia-Closas, M., El Ghormli, L. and Rothman, N. (
Nyholt, D.R. (
Spielman, R.S., McGinnis, R.E. and Ewens, W.J. (
Miller, S.A., Dykes, D.D. and Polesky, H.F. (
Holland, P.M., Abramson, R.D., Watson, R. and Gelfand, D.H. (
Livak, K.J. (
O'Connell, J.R. and Weeks, D.E. (
Abecasis, G.R. and Cookson, W.O. (
Lewontin, R.C. (
Hedrick, P.W. (
Devlin, B. and Risch, N. (
Stephens, M., Smith, N.J. and Donnelly, P. (
Clayton, D. (
Weale, M.E., Depondt, C., Macdonald, S.J., Smith, A., Lai, P.S., Shorvon, S.D., Wood, N.W. and Goldstein, D.B. (
Rabinowitz, D. and Laird, N. (
Laird, N.M., Horvath, S. and Xu, X. (
Horvath, S., Xu, X., Lake, S.L., Silverman, E.K., Weiss, S.T. and Laird, N.M. (
Horvath, S., Xu, X. and Laird, N.M. (
Lange, C., DeMeo, D., Silverman, E.K., Weiss, S.T. and Laird, N.M. (
Knapp, M. (
Tu, I.P., Balise, R.R. and Whittemore, A.S. (
