


Abstract
Elastic and mechanical weakening from water saturation are widely known to occur in sedimentary rocks, and particularly in carbonate rocks. To improve our understanding of the physics underlying this phenomenon, ultrasonic (f ∼ 0.5 MHz) elastic properties are measured on a large suite of clean limestones and sandstones at very low saturations from relative humidity (RH) variations at ambient conditions. Measurements clearly highlight an elastic weakening (i.e. decrease in elastic wave velocity) from moisture adsorption. P- and S-wave velocities are similarly affected by adsorption, but in a different way for limestones and sandstone samples. While the elastic properties of limestone samples show almost no RH dependence, a large weakening is observed for samples of Fontainebleau sandstone that increases with the samples’ porosity. The main elastic weakening effect is likely to result from adsorption of fluid at grain contacts. It thus affects particularly granular rocks such as sandstones while well-cemented limestones are not affected. The granular model from Murphy et al., accounting for surface energy effects, proves to be appropriate. Applying this model, it is shown that (i) P- and S-wave velocities have the same dependence on surface energy, which is consistent with the measurements and (ii) surface energy values obtained from the ultrasonic data using this model correlate with RH, and are consistent with the expected value for quartz crystals at vapour pressure. Yet, porosity, which relates to degree of cementation in the particular case of Fontainebleau sandstone, appears to be an additional parameter. A modified model is thus derived using the cementation model from Digby, accounting for a bonding radius at grain contact. It proves to apply well to the measured data. The fundamental difference between limestones’ and sandstones’ dependence to RH appears to be related to a microstructural difference. Saturation variations from RH increase depend on specific surface area, which is particularly low in Fontainebleau sandstones and large in microporous limestones. However elastic weakening from RH is more important in sandstones owing to their granular microstructure.
1 INTRODUCTION
Sedimentary rocks are porous media that present, under fluid saturation, a large surface area where mineral and fluid are in contact. Depending on the pores’ content and shape, rock–fluid interaction may be important enough to directly affect the rock physical properties. This effect has often been evasively referred to as ‘shear weakening’ or ‘Rebhinder effect’. While this effect has been observed for sandstones’ mechanical strength (e.g. Kirby 1984; Baud et al.2000; Klein et al.2001; Fortin et al.2007), a few measurements of elastic properties (e.g. Winkler & Murphy 1995) also reported it. In recent years, more emphasis was given to the micro-structurally complex carbonates (e.g. Verwer et al.2008). These rocks have been shown to be very sensitive to the saturating fluid, and elastic properties, such as the shear modulus, appear to decrease upon water saturation (e.g. Assefa et al.2003; Baechle et al.2005; Adam et al.2006; Verwer et al.2008; Fabricius et al.2010). Such behaviour is not consistent with established theories that consider the shear modulus as unaffected by fluid (Gassmann 1951). This elastic weakening phenomenon is reversible and disappears under drying (Baechle et al.2005), and thus seems related to adsorption. This weakening from adsorption appears to be more important in limestone than in sandstone samples (e.g. Baechle et al.2005).
In order to understand the elastic weakening linked to adsorption, low saturations (i.e. corresponding to adsorbed volumes) are investigated. Low saturation is attained through varying the partial pressure of the atmosphere surrounding the sample (e.g. Clark et al.1980; Tittmann et al.1980). Effects of moisture and adsorption were in particular experimentally investigated to understand the fundamental difference between attenuations of lunar and terrestrial rocks (e.g. Tittmann & Housley 1973; Tittmann 1977, 1978), and to study the induced elastic weakening (e.g. Clark et al.1980) and attenuation (e.g. Pandit & King 1979; Clark et al.1980; Murphy 1982, 1984) at seismic frequencies. Theories have been proposed to explain these observations (e.g. Johnson et al.1971; Murphy et al.1984; Tutuncu & Sharma 1992; Chelidze et al.1996). In particular, based on the analysis of Johnson et al. (1971), Murphy et al. (1984) and Tutuncu & Sharma (1992) developed models to predict elasticity and/or attenuation variations as a function of moisture adsorption. Yet, velocities (Clark et al.1980) and attenuations (e.g. Tittmann et al.1980) were measured at seismic (f ∼ 1 kHz) frequencies only and very few clean sandstone and limestone samples were studied.
In this study, sensitivity of sandstones’ and carbonates’ elastic properties to adsorption are compared at room T–P. Water saturations and ultrasonic (f ∼ 0.5 MHz) wave velocities are measured under controlled relative humidity (RH). To understand the underlying physics, the micromechanical model of Murphy et al. (1984) is introduced that links effective elasticity to surface energy (Johnson et al.1971). Finally, cementation is accounted for using the model of Digby (1981) to understand the less porous sandstones.
2 EXPERIMENTAL APPROACH AND SAMPLES STUDIED
2.1 Samples studied
This study investigates the role of adsorption on elastic properties of clean (i.e. calcite- and quartz-pure, respectively) limestones and sandstones of varying porosity. A suite of 11 limestone and nine sandstone samples, covering a wide range in porosity for both sedimentary rocks, were selected. The samples’ main petrophysical features are presented in Table 1, that reports measured porosities (ϕ), along with permeabilities (κ) and pore entry diameters (d) found in the literature. The total pore volume Vpore (leading to ϕ) is obtained from the dry density of the rock samples and the quartz/calcite crystal densities. As the samples are clean (i.e. quartz- or calcite-pure) rocks, this approach is preferred over any other porosity measuring method.
Properties of the tested samples. Porosities (ϕ) as measured in this work. Approximate permeability (κ) and pore entry diameter (d) are reported from previous studies on the different samples.
| Samples | Classification | ϕ (per cent) | κ (m2) | d (μm) | References |
|---|---|---|---|---|---|
| Massangis | Oolite | 6.1 | 1 × 10⁻¹⁶ | 0.1–0.8 and 100 | Casteleyn et al. (2010) |
| Indiana | Oolite | 12.4 | 2 × 10⁻¹⁵ | 0.04–1 and 100 | Vajdova et al. (2004, 2010) |
| Euville | Oolite | 15.9 | 4 × 10⁻¹⁵ | 0.1 and 1–80 | Eslami et al. (2010) |
| Chauvigny oolite | Oolite | 16.3 | – | 0.1–2 and 10–50 | Vincent et al. (2011) |
| Tavel | Micrite | 17.2 | 1 × 10⁻¹⁷ | 0.02–0.3 and 100 | Vajdova et al. (2004) |
| Anstrude | Oolite | 19.5 | 4 × 10⁻¹⁶ | 0.3 and 100 | Casteleyn et al. (2010) |
| Raviere | Oolite | 19.7 | 2 × 10⁻¹⁶ | 0.4 and 100 | Casteleyn et al. (2010) |
| Lavoux | Oolite | 22.4 | 1 × 10⁻¹⁴ | 0.84 and 20 | Le Guen et al. (2007) |
| Fontvieille | Micrite | 23.6 | – | – | – |
| Estaillades | Micrite | 28.4 | 2 × 10⁻¹³ | 0.39 and 19 | Le Guen et al. (2007) |
| Chauvigny micrite | Micrite | 34.4 | – | 0.2–3 and 200 | This work |
| Fontainebleau (FoSp2a) | Granular | 2.6 | 1 × 10⁻¹⁷ | 1–10 | Bourbie & Zinszner (1985) |
| Fontainebleau (FoSp2b) | Granular | 2.2 | 1 × 10⁻¹⁷ | 1–10 | Bourbie & Zinszner (1985) |
| Fontainebleau (FoSp4) | Granular | 4.7 | 1 × 10⁻¹⁵ | 1–10 | Bourbie & Zinszner (1985) |
| Fontainebleau (FoSp7) | Granular | 7.2 | 1 × 10⁻¹⁴ | 1–10 | Bourbie & Zinszner (1985) |
| Fontainebleau (FoSp9) | Granular | 9.0 | 1 × 10⁻¹³ | 10 | Bourbie & Zinszner (1985) |
| Fontainebleau (FoSp16a) | Granular | 16.0 | 1 × 10⁻¹² | 10–20 | Bourbie & Zinszner (1985) |
| Fontainebleau (FoSp16b) | Granular | 16.7 | 1 × 10⁻¹² | 10–20 | Bourbie & Zinszner (1985) |
| Fontainebleau (FoSp18a) | Granular | 18.2 | 5 × 10⁻¹² | 10–20 | Bourbie & Zinszner (1985) |
| Fontainebleau (FoSp18b) | Granular | 18.9 | 5 × 10⁻¹² | 10–20 | Bourbie & Zinszner (1985) |
2.1.1 Fontainebleau sandstone samples
Fontainebleau sandstone is a well-known reference rock. Many experimental investigations have been carried out on this rock (e.g. Song & Renner 2008; Gomez et al.2010; Duda & Renner 2013). It exhibits homogeneous and isotropic properties at the sample scale (e.g. Sulem & Ouffroukh 2006). Both framework grains and cement are pure quartz, making up a clean sandstone of about 99.9 per cent qtz (e.g. Bourbie & Zinszner 1985). This aeolian rock is well sorted, with a relatively constant grain radius (r) of about r ∼ 100 μm.
Depending on the amount of quartz cementing, its porosity ranges from about ϕ ∼ 2 per cent for highly cemented samples to about ϕ ∼ 25 per cent for less cemented samples (Bourbie & Zinszner 1985). The variable amount of quartz cement originates from a variation in the silica super-saturated water-table (e.g. Sulem & Ouffroukh 2006). As a consequence, pore-entry diameters (d) decrease with porosity (e.g. Song & Renner 2008) from d ∼ 20 μm to about d ∼ 5 μm, leading to variations in permeability of about 4–5 orders of magnitude (Bourbie & Zinszner 1985). In this study, Fontainebleau samples with a porosity ranging from about ϕ ∼ 2 per cent up to about ϕ ∼ 20 per cent are investigated.
2.1.2 Limestones
Apart from Indiana limestone, the limestone samples chosen come from french quarries (e.g. Vincent et al.2011). They vary in porosity, morphology (e.g. grains and pores size) and sedimentary history (e.g. micritic versus oolitic limestones). All samples are considered as clean limestones, and all of them exhibit a double porosity.
Tavel limestone is a relatively homogeneous micritic limestone (Vajdova et al.2004) made up of a microcrystalline matrix relatively well cemented with an average grain diameter of ∼ 5 μm. Its porosity is ϕ ∼ 17 per cent. It is characterized by a bimodal pore-size distribution of few macropores (i.e. d ∼ 100 μm), and mainly submicron (i.e. d ∼ 0.1 μm) pores (Vajdova et al.2010). Indiana limestone is an oolitic limestone with fossils of about ∼ 300 μm diameter cemented by fine-grained calcite (Vajdova et al.2004). Estaillade and Fontvieille limestones originate from Gard quarries from southeast France. Both are calcite-pure bioclastic micritic rocks of large porosities (i.e. ϕ ∼ 28.4 per cent and ϕ ∼ 23.6 per cent, respectively). Estaillade limestone exhibits a bimodal pore size distribution made up of intergranular macro-pores of about d ∼ 19 μm and intra-granular micropores of d ∼ 0.39 μm (Youssef et al.2008).
The other limestones are from the Oolite Blanche carbonate formation of Paris Basin. Euville limestone is an oolitic limestone with a bimodal porosity (ϕ ∼ 22 per cent) mainly composed of inter- (d < 80 μm) and intra- (d < 1.5 μm) oolite pores (Eslami et al.2010). Lavoux and Chauvigny limestones originate from the Dogger formation. Lavoux is an oolitic limestone (Le Guen et al.2007; Vincent et al.2011) as for one of the Chauvigny samples (Fortin et al.2009; Vincent et al.2011). The other Chauvigny sample is a fine-grained loosely cemented micritic rock. Lavoux sample has a porosity of about ϕ ∼ 22 per cent, and the oolitic and micritic Chauvigny samples have porosities are of about ϕ ∼ 16 and ∼34 per cent, respectively. All three samples show microporosity in the range of d ∼ 0.1–1 μm, and a macroporosity of about d ∼ 10–100 μm (Youssef et al.2008). Anstrude , Raviere and Massangis limestones are characterized as oolitic limestones, and have a double porosity with very similar pore entry diameters of about d ∼ 0.1–0.6 μm for the microporosity (Casteleyn et al.2010). While Anstrude and Raviere samples have similar total porosity of about ϕ ∼ 19 per cent, Massangis limestone has a lower porosity (ϕ ∼ 6 per cent) that probably originates from differing degrees of cementing during burial.
The 20 samples in Table 1 are ranked from low porosity to high porosity values. The values of permeability and pore-entry diameter correlate to porosity for the Fontainebleau sandstone samples only.
2.2 Experimental set-up
In order to measure small quantities of water saturation (|$S_{\text{w}} < 2 \,$| per cent), we impose varying RH in the atmosphere surrounding the rock sample. This experiment aims at investigating (i) the amount of water adsorbed; and (ii) the effects of adsorption on elastic properties. An experimental protocol is thus devised to study the evolution of rocks’ elastic properties with adsorption.
2.2.1 RH control
The atmosphere's RH is defined as the ratio between the water pressure |$P_{\text{H}_{2}\text{O}}$| and the pressure of saturating vapour P. Saturating vapour pressure depends on different factors such as temperature, which is continuously monitored during experiment and is about T = 20 ± 2 °C. For a given RH, equilibrium between vapour and liquid water leads to adsorption of small amounts of water on the rock pores surfaces. Adsorption equilibrium on a mineral surface from RH is usually reached within a few minutes. Weight measurements showed that final saturation of the rock (i.e. mineral aggregate) is reached in less than 1 hr after RH stabilization.
The prepared sample is introduced in the hermetically closed glass chamber using a system allowing for direct measurement of elastic wave velocities under controlled atmosphere (Fig. 1). In this study, RH is controlled by the presence of different salts in a closed chamber (e.g. Greenspan 1977). For a given temperature, each salt (or salt solution) is chosen as leading to a calibrated RH (Fig. 1). To measure precisely the RH, a Thermo-Hygrometer ‘Testo 610’, accurate to the 1st decimal, is introduced in the volume. It also allows for a constrained tracking of the RH equilibrium and stabilization, with an accuracy of ∼0.1 per cent.
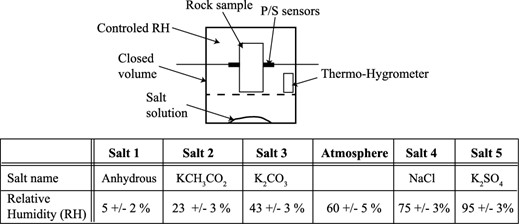
Schematic view of the experimental set-up. The prepared sample is placed in the closed volume along with a salt solution that will affect RH. Elastic wave velocities are measured directly on the sample at ambient conditions after RH stabilization. Five different salts are used to change RH, each corresponding to a different RH value. For a given temperature, each salt (or salt solution) is chosen as leading to a calibrated RH (e.g. Greenspan 1977).
In this study, the sought properties were measured after 2 hr of RH stabilization, and after 4 hr in the extreme case of maximum RH (i.e. ∼95 per cent). RH and elastic wave velocities are measured simultaneously directly in the chamber, and mass is measured directly when opening the chamber.
2.2.2 P- and S-waves velocities
Cylindrical rock samples of 80 mm length and 40 mm diameter are used in the study. Before experiments, samples are dried in an oven filled with anhydrous salts at T ∼ 70 °C, and then weighted to obtain the total pore volume Vpore. Two couples of P- and S-wave piezoelectric transducers of f ∼ 0.5 MHz central frequency are directly glued on the sample (Fig. 1). P- and S-sensors are opposed as to measure ultrasonic wave propagation across the samples’ diameter. In this set-up, the transducers are glued to the samples ‘once and for all’, that is they remain on the samples throughout the RH variations, giving constant travel paths and contact conditions. The sensors’ weight is considered to be independent of the RH so that the sample's water saturation can be traced from the weight difference. The piezoelectric sensors are directly related to a standard generator sending a square pulse of f ∼ 0.5 MHz central frequency, and an analogical oscilloscope linked to the Insite ASC Ltd data acquisition software (e.g. Ougier-Simonin et al.2011).
Absolute P- and S-wave velocities under dry conditions (i.e. lowest RH of about ∼5 per cent) are hand-picked. The evolution of the elastic velocities with RH is then obtained by a cross-correlation with this reference state at lowest RH. Measurements of absolute elastic wave velocities may have a low accuracy, owing to (i) the uncertainty in wave arrival and (ii) the sensors’ position and the sensors-to-sample contact quality that vary from one sample to the other. As a consequence, uncertainty on P- and S-wave velocities’ absolute measurement may be as high as about ∼2 and ∼5 per cent, respectively. However, P- and S-wave velocities’ relative measurements, obtained from waveforms’ cross-correlation, allow to discard these sources of uncertainty, leading to an accuracy of about ∼0.1 per cent.
2.2.3 Water saturation
3 EXPERIMENTAL RESULTS
The first aim is to study the differences between limestones and sandstones. Thus different symbols are used for both rock types in the various figures.
3.1 Elastic properties (Vp − Vs) at low RH
The samples’ absolute P- and S-wave velocities measured under dry condition are reported (Fig. 2) as a function of their porosity. Overall, P waves (Fig. 2a) and S waves (Fig. 2b) show similar trends. Velocities decrease with increasing porosity. Yet, these trends appear to differ between rock types (i.e. Limestones versus Fontainebleau sandstone samples). While Fontainebleau samples exhibit large velocity variations with porosity, limestones samples show smaller variations.
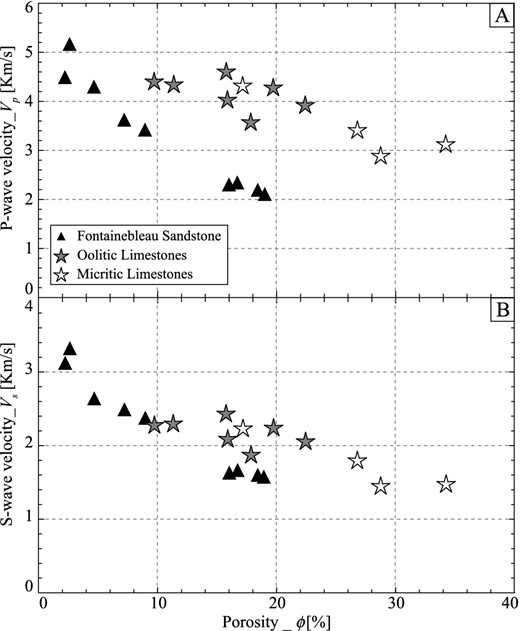
Measured dry P- and S-wave velocities at ambient conditions on the Limestones (stars) and Fontainebleau sandstone (triangles) samples. Limestones samples are grouped into oolitic (grey stars) and micritic (white stars).
Clear differences between oolite and micrite limestones dry elastic properties are not found. As a consequence, elastic properties of these two limestones families are undifferentiated in the following, and we focus only on the difference between limestones and sandstone samples.
3.2 Evolution of properties with RH
To fully investigate the effect of adsorption on elasticity, two main properties are measured: (i) water saturation; and (ii) normalized P- and S-wave velocities.
3.2.1 Water saturation
The evolution of the sample saturation is measured (Fig. 3) as a consequence of an increase in RH. Two important differences appear between rocks type. While limestones exhibit large variations in water saturation with RH, only very small increases are observed for the Fontainebleau samples. Limestones exhibit a large scattering from sample to sample, with values ranging from |$S_{\text{w}} \sim 0.5 \,$| per cent up to |$S_{\text{w}} \sim 2.5 \,$| per cent at maximum RH. On the reverse, Fontainebleau samples show a small scattering and a water saturation |$S_{\text{w}}$| remaining lower than ∼0.5 per cent at highest RH. Saturation from adsorption thus proves to be larger in limestones than in Fontainebleau samples.
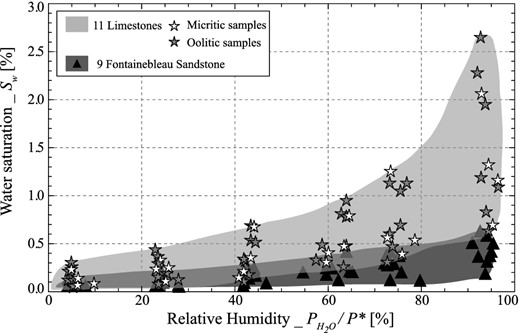
Measured water saturation variations with relative humidity on 11 limestones samples (grey surface and stars) and on nine Fontainebleau sandstones (triangles).
Again no clear difference is observed between oolites and micrites. Also, as the selected Fontainebleau samples have porosities ranging from ϕ ∼ 2 per cent to ϕ ∼ 19 per cent, it is clear that |$S_{\text{w}}$| depends very weakly on porosity in that case.
3.2.2 Normalized elastic wave velocities
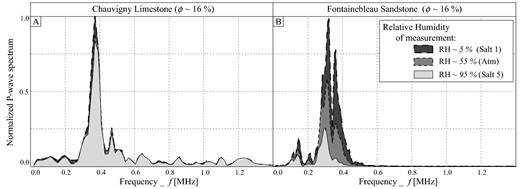
An example of RH effect on P and S waveforms is introduced (Fig. 4) for the oolitic Chauvigny limestone and a Fontainebleau sandstone (FoSp16a). These samples have been selected for comparison because of their very similar porosity (ϕ ∼ 16 per cent). A clear difference between limestone and sandstone samples is observed for both P (Figs 4a and 4b) and S (Figs 4c and 4d) waveforms. While waveforms measured on ChLo show no change with RH, large decrease in both arrival times and amplitudes is observed for FoSp16 with increasing RH. P- and S-wave velocities are directly inferred from the arrival times.
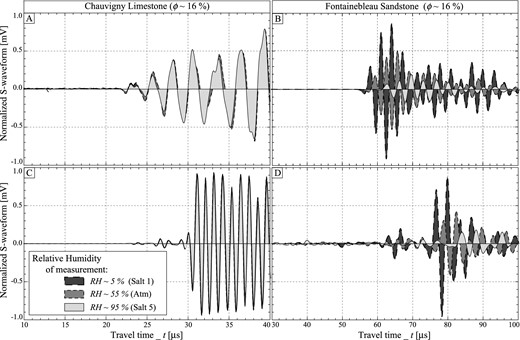
Normalized P- and S-waveforms measured at ambient conditions on a Chauvigny limestone sample (A and C) and a Fontainebleau sandstone sample (B and D) for three different Relative Humidities.
Variations of normalized P- and S-wave velocities for all samples are finally reported (Fig. 5) as a function of RH. While limestones velocities vary very slightly with RH (up to about ∼0.5 per cent at maximum RH), some sandstone samples exhibit a large decrease (up to about ∼25 per cent at maximum RH) with increasing RH.
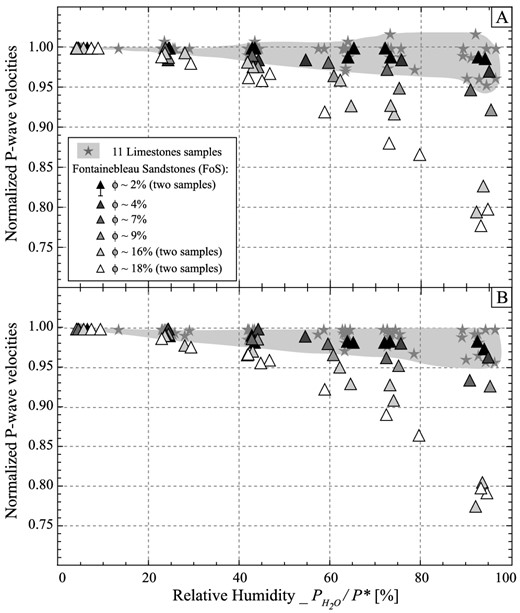
Normalized P- and S-wave velocity variations with relative humidity measured at ambient conditions on 11 limestones samples (grey surface and stars) and on nine Fontainebleau sandstone samples (triangles) of increasing porosities (filling in grey levels from black to white).
Given that the variations for limestones are very small (i.e. ≤0.5 per cent), it is difficult to evidence any porosity or facies dependence. On the reverse, Fontainebleau sandstone samples show large variations as a function of RH. This dependence to RH correlates well to their porosities. Note that P wave (i.e. Fig. 5a) and S wave (i.e. Fig. 5b) have very similar dependencies on RH, and show the same order of magnitude of decrease at maximum RH.
An anticorrelation appears between saturation (Fig. 3) and elastic properties (Fig. 5) variations with RH. The limestones exhibit large saturation variations but almost no change in P and S waves with RH. On the reverse, the Fontainebleau samples exhibit lower saturation changes but show large P- and S-waves velocity variations.
4 INTERPRETATION OF ELASTIC WEAKENING USING EFFECTIVE MEDIUM THEORIES
As shown in Section 3, elastic velocities in Fontainebleau samples (Fig. 5) appear to depend on the moisture content, while such relation is not observed for limestones. Furthermore, weakening in this quartz-pure sandstone increases with porosity. These measurements thus confirm that weakening from moisture does not originate from the presence of clay minerals (Clark et al.1980), but from the rock microstructure (Murphy et al.1984).
Effective medium models are relevant to analyse the reported results. Depending on the rock microstructure, two distinct approaches can be used. The first one consists in describing the pores as inclusions in a matrix. This approach holds particularly well in the case of rocks bearing isolated pores, or in the case of connected pores in a rock with strong grain boundaries. The second approach is more appropriate for a granular medium where stiffnesses at grain contact are the key element (e.g. Digby 1981). Following Murphy et al. (1984), this second approach is used below to investigate the measurements on the sandstone samples.
In particular, Murphy et al. (1984) developed an effective medium model that allows for adsorption at grain contacts. Adsorption modifies the frame moduli of a granular rock. This is consistent with the observations that RH effect appears mainly in the more porous and probably less cemented Fontainebleau sandstone samples.
4.1 Model from Murphy et al. (1984) applied to velocity data
The modelling approach from Murphy et al. (1984) relies on (i) the assumption that the rock frame moduli depend on the stiffness at the grain contact (e.g. Digby 1981), which in turn is a function of the surface energy at the contact between grains (Johnson et al.1971) and (ii) a thermodynamic approach that relates surface energy to RH.
4.1.1 Model derivation
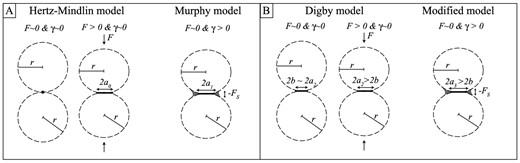
Schematic views of grain contact theories for (a) uncemented (i.e. no bonding radius b) and (b) cemented (i.e. existing bonding radius b) cases. The uncemented Hertz-Mindlin theory (a) is complemented by models from Johnson et al. (1971) and Murphy et al. (1984) for existing surface forces. The cemented theory from Digby (1981) is complemented by the present approach in case of surface forces.
This final result is consistent with the present measurements of normalized Vp and Vs variations with RH that show the exact same trends (Fig. 5). Interestingly, compressional and shear modulus appear affected similarly by adsorption. By comparing (Fig. 7) the variations of RVp relative to RVs and eq. (5), the measurements clearly fall on the linear trend predicted using the model of Murphy et al. (1984).
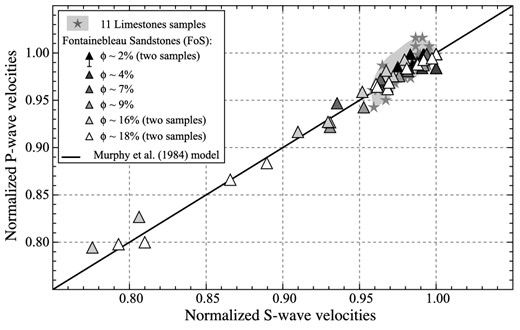
Relative variation of P-wave velocities as compared to S waves for varying relative humidities and values of surface energy. Measurements (symbols) are compared to the model prediction (black line) from Murphy et al. (1984).
4.1.2 Estimation of the surface energy
In the following, we focus on the data obtained on Fontainebleau samples as they show a large weakening with RH, and, according to eq. (5), the results should not depend on porosity. Furthermore, all Fontainebleau samples are quartz-pure (i.e. |$G_{\text{quartz}} \sim 45$| GPa, |$\nu _{\text{quartz}} \sim 0.06$|, and γ0 ∼ 0.45 J/m2) and have a constant grain radius (of about r ∼ 100 μm), whichever the porosity.
As shown by eq. (6), γ values are extracted from either P- or S-wave velocity. The dependence to RH of the inverted γ values (Fig. 8) can thus be directly inferred from the normalized P- and S-wave velocities (Fig. 5). The initial vacuum (i.e. γ0) and vapour saturating pressure (i.e. γf) surface energies from the literature (e.g. Murphy et al.1984) are reported for comparison.
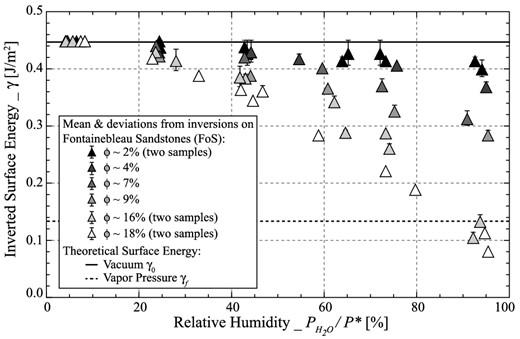
Inverted surface energy using LS minimization between measurements and the model of Murphy et al. (1984). Symbols and error bar are, respectively mean and standard deviation obtained from surface energies inverted separately from P- and S-wave measurements and models. Surface energies measured by Parks (1984) on a quartz surface under dry and vapour saturating pressure (P*) conditions.
The small error-bars in Fig. 8 emphasize the good fit between P- and S-wave data for all samples, which is consistent with eq. (5). Comparing the inverted γ to the prediction related to Gibb's theory (Adamson 1976; Murphy et al.1984; Parks 1984; Chelidze et al.1996), the overall variation appears to be respected and γ decreases with adsorption. Finally, the most important result here is that γ for higher porosity Fontainebleau samples (i.e. FoSp16 and FoSp18) decreases down to about γf ∼ 0.12 J m−2. This value corresponds to the measured surface energy at vapour pressure (i.e. γf ∼ 0.13 J m−2) on a quartz crystal (e.g. Murphy et al.1984). This implies that the model of Murphy et al. (1984) describes particularly well the phenomenon for the high porosity (i.e. ϕ ≥ 16 per cent) sandstone samples studied. Yet, for the low porosity samples, changes in γ are smaller. This lower dependence of γ points to the fact that the model is less appropriate for these samples.
4.2 Low-porosity sandstone samples: modified model
The above observations suggest that the nature of grain contacts, and their degree of bonding play a role. This is precisely what the model of Digby (1981) takes into account through an additional parameter, namely the bonding radius b.
4.2.1 Model derivation: bonding at a grain contact
The new grain contact radius a3 is then obtained by solving the polynomial equation (eq. 9). The predictions of a3 = f (γ) for differing values of b are compared to the JKR model (eq. 2) in Fig. 9(a). It appears that (i) a3 falls in the asymptotic values of a1 (eq. 2) at elevated surface energies and (ii) for γ ∈ [0.1; 0.5] J m−2, the dependence of a3 on γ decreases with increasing b and becomes apparently constant for b ∼ 2 μm.
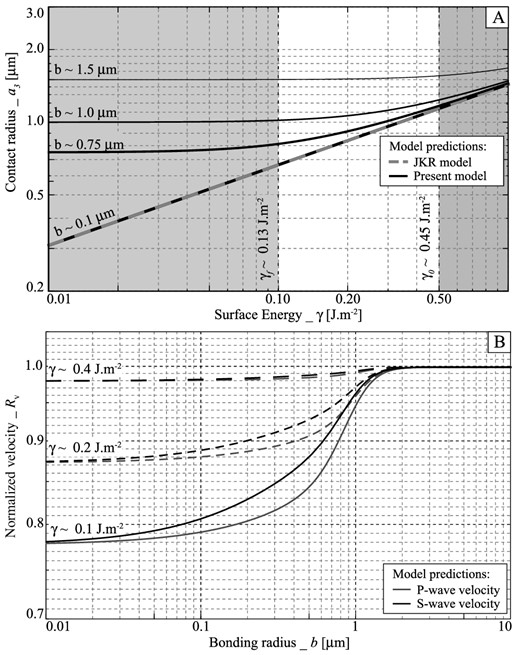
Predictions using the modified model: (a) contact radius a3 as a function of surface energy γ for different values of bonding radius b (i.e. black lines); (b) normalizsed P-wave (i.e. black curve) and S-wave (i.e. grey curve) velocities as a function of the bounding radius b for different values of surface energy γ.
4.2.2 Estimation of the surface energy
Using the modified model, surface energy is again inverted using a similar least-square minimization as detailed in eq. (6). Again, the parameters relate to a quartz-pure rock (i.e. |$G_{\text{quartz}} \sim 45$| GPa, |$\nu _{\text{quartz}} \sim 0.06$|, and γ0 ∼ 0.45 J m−2) with a given grain radius (i.e. |$r \sim 100 \, \mu {\text{m}}$|) under atmospheric conditions (i.e. F ∼ 0 N). The modified model (eq. 11) introduces the bonding radius b as an additional parameter. For the inversion, the parameter b is fixed so that γ ∼ 0.13 J m−2 is obtained for the highest value of RH.
The resulting surface energies, along with the values of b (and related ratio b/a3) used, are reported (Fig. 10) as a function of the samples’ porosity. Such procedure leads to inverted surface energy values for all samples falling in the same overall trend (Fig. 10a) that was found using the model of Murphy et al. (1984) on the most porous samples (Fig. 8).
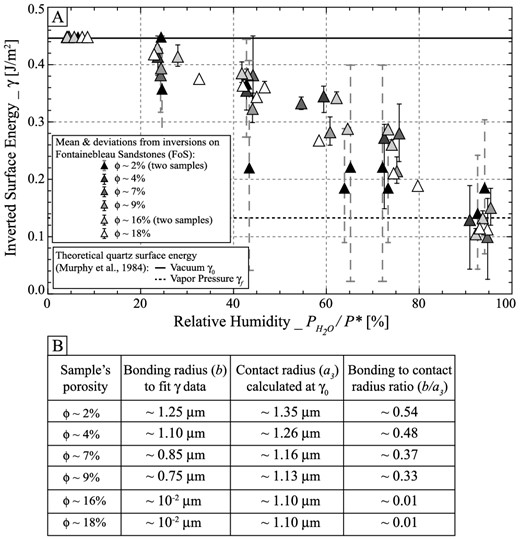
Data obtained using the modified model: (a) inverted surface energy using LS minimization between measurements and the modified model. Symbols and error bar are respectively mean and standard deviation obtained from surface energies inverted separately from P- and S-wave measurements and models; (b) values of bonding radius allowing for consistent surface energy values at higher RH, and grain contact radius calculated (eq. 9) under dry conditions (γ0).
Note that a scattering appears between P and S waves inverted γ values for low porosity samples (Fig. 10a). This effect probably results from the small variations measured in low porosity samples. From the reported table (Fig. 10b), it appears that one can find realistic values of b. Yet, values found for all samples with porosities lower than about ∼9 per cent fall in a very narrow range of about b ∼ 0.5–1.5 μm.
5 DISCUSSION
The presented results and interpretations raise several questions on three issues: (i) the relation between bonding radius b and porosity; (ii) the relation between elastic weakening and saturation and (iii) the effect of RH on attenuation.
5.1 Relation between bonding radius and porosity
To complement the present data set on Fontainebleau samples, another data set from Gomez et al. (2010) is useful. It corresponds to measurements of elastic wave velocities at higher confining pressures (i.e. Pc ∼ 40 MPa). The porosity dependence of the Fontainebleau samples’ elastic properties measured at room P conditions and at 40 MPa are compared (Fig. 11). As shown by the P- and S-wave velocities zones, the pressure effect increases with porosity.
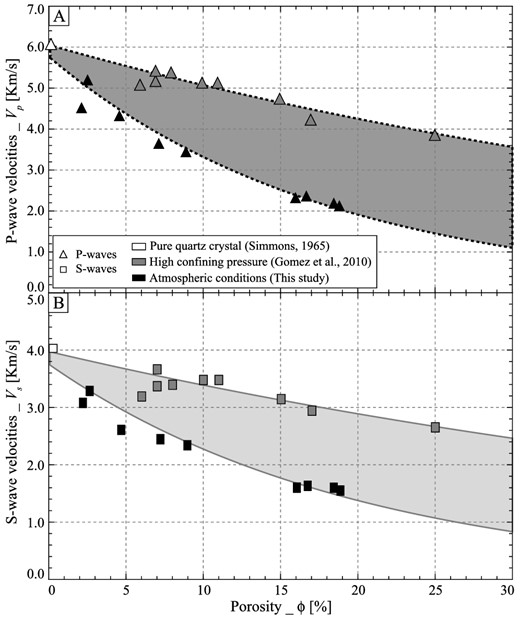
Dependence of elastic wave velocities to porosity for Fontainebleau sandstones between measurements at lowest relative humidity and ambient conditions (black symbols), and data set from Gomez et al. (2010) measured at elevated (i.e. Pc ∼ 40 MPa) confining pressure (grey symbols). The grey areas (i.e. dark-grey for P waves and light-grey for S waves) between the best-fitting trend-lines represent the effect of pressure on load bearing grain contacts.
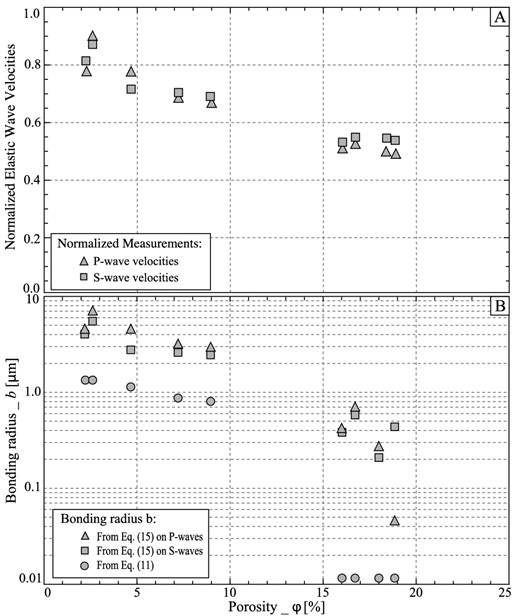
(a) P- and S-wave velocities (i.e. grey triangles and squares, respectively) measured at ambient conditions normalized as a function of high confining measurements from Gomez et al. (2010) plotted against porosity. b) Comparison of the bonding radius b obtained using either results from the adsorption study (i.e. light-grey dots) or the confining study for P-wave (i.e. light-grey triangles) and S-wave (i.e. light-grey squares) measurements.
Noting that F ∼ Pr2, |$F_{\text{max}}$| and |$F_{\text{atm}}$| are expected to differ by about two orders of magnitude. We choose |$F_{\text{max}} \sim 1$| N for the measurements at high confining pressure (i.e. Pc ∼ 40 MPa) and |$F_{\text{atm}} \sim 10^{-2}$| N for the ones at atmospheric conditions. Finally, the other parameters being fixed, the ratio defined from eq. (14) are a sole function of the bonding radius b. To invert for b, as in eq. (6), a least-square minimization is then applied to the difference between the normalized model (eq. 10) and data (Fig. 12a).
The values of bonding radius b obtained with this method are compared (Fig. 12b) to the ones obtained in Section 4 (Fig. 10b). It appears from Fig. 12(b) that both methods lead to relatively similar values of bonding radius b. While the values found from eq. (14) overestimate the ones from eq. (10), the overall trend seems to be respected and the b values decrease with increasing porosity. The deviation found could originate from the different hypothesis made, but the modified model introduced in Section 4.2 (eq. 9) seems to qualitatively account for adsorption on cemented granular rocks.
5.2 Relation between saturation and elastic weakening
While adsorption (and thus |$S_{\text{w}}$|) remains the limiting factor without which no elastic weakening would be observed, it was shown in Section 3 that elastic weakening (Fig. 5) and |$S_{\text{w}}$| (Fig. 3) from adsorption do not correlate. In particular, the absence of weakening in any of the 11 limestones rises a question. Is the absence of weakening in limestones related to its non-granular microstructure or to an intrinsic difference between calcite and quartz?
Saturation from RH relies on physisorption of water molecules on the mineral surfaces, which relates to (i) affinity of a mineral to water (e.g. Maghsoudy-Louyeh & Tittmann 2008) and (ii) the amount of surface allowing for adsorption (e.g. Goertz & Knight 1998). Quartz crystals are known to bear a large affinity to water, leading to large quantities (up to several monolayers) of adsorption on the mineral surface (e.g. Goertz & Knight 1998). Measurements by Maghsoudy-Louyeh & Tittmann (2008) showed that adhesion forces on quartz, mica and calcite minerals (i) are of the same magnitude and (ii) increase similarly with RH. It may indicate that affinity of both minerals to adsorbed water is of the same order of magnitude, and implies that the measured differences in saturation between limestones and sandstones do not relate here to a difference in mineral affinity.
Note that the largest |$S_{\text{w}}$| (at high RH) are obtained for the Anstrude, Raviere, Massangis and Tavel limestones. A standard procedure of mercury injection (i.e. MICP) was used to study these rocks’ pore entry diameters (e.g. Casteleyn et al.2010). On the contrary to other limestones, MICP measurements (Fig. 13) on three of these four rocks show a narrow peak for very small pore entry diameters of sub-microns size. MICP measurements may thus confirm that adsorption relates to pores size, and thus to specific surface area.
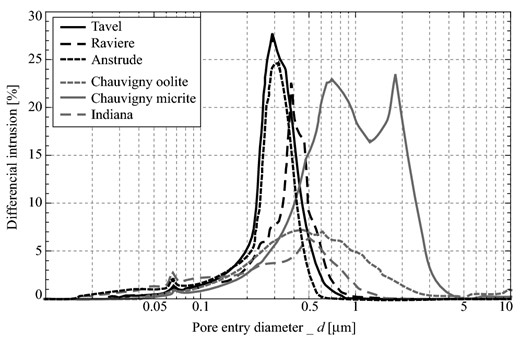
Normalized intruded volume as a function of pore entry diameter measured using a typical MICP technique. Example of measurements for six representative limestone samples.
5.3 Waves amplitudes variations and attenuation
As observed from Fig. 4, the waveform's amplitude is also affected by RH. As for elastic waves velocities, P- and S-waves amplitudes show large decrease with increasing RH in the Fontainebleau sample studied (Fig. 4b). To characterize this effect, the Fourier spectra of the full waveforms can be directly computed, as shown for the example of P-amplitude spectra (Fig. 14) of the two samples chosen (Fig. 4). Again, a clear difference is observed between the limestone (Fig. 14a) and FoSp16a (Fig. 14b) P-amplitudes spectra. While the limestone spectra show no change with RH, large decrease in P amplitude is observed for FoSp16a with increasing RH. In particular, the normalized amplitude obtained for FoSp16 between measurements under dry (i.e. A0) and maximum RH conditions (i.e. Ai) is as low as about Ai/A0 ∼ 0.2.
Normalized P-wave Fourier spectra measured at ambient conditions on a Chauvigny limestone and a Fontainebleau sandstone sample for three different Relative Humidities.
Waves attenuations, in terms of quality factors, could be obtained using the spectrum ratio principle (Toksöz et al.1976; Bourbie & Zinszner 1985) from these amplitude variations. Assuming that attenuation relates to amplitude variations would lead to the conclusion that elastic weakening and attenuation correlate in their RH dependence. Such result, of elastic weakening and attenuation variations with RH, was observed by Clark et al. (1980). As assumed by different authors (e.g. Murphy et al.1986; Chelidze et al.1996), dispersion and attenuation from moisture are thought to originate from fluid movements at the grain contacts, and could be expected to occur in granular rocks. Yet, reporting such measurement would imply (i) using as a reference the amplitude of a non-attenuating standard such as an aluminium (e.g. Bourbie & Zinszner 1985) and (ii) compare the amplitudes of the different samples, which is obtained with different contact positions and quality. As a consequence, attenuation was not investigated here to concentrate on elastic weakening.
Note that, previously, elastic weakening (Clark et al.1980) and attenuation (e.g. Tittmann 1977, 1978; Clark et al.1980; Tittmann et al.1980) from adsorption have only been measured at lower frequencies (i.e. f ∼ 1 kHz). In the particular case of measurements by Clark et al. (1980), elastic properties are obtained using the Resonant Bar Technique (e.g. Tittmann et al.1980). This widely used apparatus allows for measurements of shear and extensional elastic moduli and seismic attenuation at intermediate frequencies (i.e. f ∈ [1; 20] kHz). On the reverse, the present data set was obtained using a typical ultrasonic apparatus leading to waves frequency of about f ∼ 0.3 MHz. This experiment thus complements existing data sets and shows that, at a given RH, attenuation and elastic weakening also appear at frequencies as high as f ∼ 0.3 MHz.
5.4 Surface energy variations from adsorption
As shown above, a variation in surface energy (γ) with increasing RH (Figs 8 and 10) is inferred. In particular, the values obtained (at high RH) using the model of Murphy et al. (1984) in the case of the most porous sandstones (Fig. 8) fit particularly well the value of γf ∼ 0.13 J m−2 directly measured at vapour saturating pressure on a quartz surface by Parks (1984). Furthermore, using the newly developed model, the same γ value can be reached for all Fontainebleau samples for realistic values of bonding radii b.
Using BET theory (Adamson 1976), Murphy et al. (1984) predicted the RH dependence of γ. As schematized by Parks (1984), the prediction is that γ variations are much larger at the lowest RH. The first adsorbed monolayer is expected to develop at very low RH values (i.e. ∼10 per cent), and to strongly affect γ. This strong effect at low RH values is not supported by the estimates for surface energy values inferred from the measurements on Fontainebleau sandstone's samples (Figs 8 and 10). While investigating the cause for such deviation may be of interest, it would imply modelling the thermodynamics of adsorption variations at an interface and its effect on surface energy. Such investigation is out of the scope of this study.
6 CONCLUSIONS
An experimental set-up has been designed to investigate the effect of adsorption on limestones and sandstone samples’ elastic properties. From varying RH, saturation and elasticity measurements at ultrasonic frequencies (i.e. f ∼ 0.5 MHz) on limestones and sandstones have been obtained. The results show that RH affects the sample properties. Both rock types show varying degrees of adsorption with RH, and varying effects on elasticity. Limestones show large adsorption effects, but no elastic weakening is observed. On the reverse, large elastic weakening is observed on Fontainebleau sandstone samples. The weakening effects measured are similar for P- and S-wave velocities.
As elastic weakening affects preferentially the granular sandstones, grain contact theories have been used to interpret the present measurements. Using the model of Murphy et al. (1984), the rock-fluid adsorption effect is explained in terms of surface energy variations (Johnson et al.1971; Murphy et al.1984). It appears that this model predicts the same weakening for both P- and S-wave velocities, which is consistent with the data. An effective surface energy is obtained for the Fontainebleau samples. For the highest porosity samples, this surface energy proves to be consistent with quartz mineral surface energy at vapour saturating pressure. The model of Murphy et al. (1984) describes well high porosity loosely cemented sandstones.
Yet, the amount of variation in surface energy with RH decreases with decreasing the sample porosity and a very small variation is found for the lowest porosity sandstones. Fontainebleau sandstone is a typical granular rock in which cementation increases with decreasing porosity. In order to account for this, the approach of Murphy et al. (1984) has been modified using the cemented granular model of Digby (1981). An additional parameter is the bonding radius b. For the problem's parameters at hand, it was found that surface effects are important only for values of b lower than about b ∼ 2 μm.
In addition, a comparison between limestones and sandstones shows that the fundamental difference between their respective elastic weakening from adsorption originate from a microstructural difference. Fontainebleau sandstone is a typical grain aggregate where the contact between grains is a key parameter. On the reverse, limestones may be considered as bearing porosity embedded in a very fine cemented matrix.
The authors would like to thank Prof Christian David from the University of Cergy and Dr Elizabeth Bemer from IFPen for providing us with limestones samples. Prof Christian David and Jean-Christian Coulombier are thanked for their help on MICP measurements on some of the samples.
