


Abstract
Species diverge eco-morphologically through the continuous action of natural selection on functionally important structures, producing alternative adaptive morphologies. In cichlid fishes, the oral and pharyngeal jaws are such key structures. Adaptive variation in jaw morphology contributes to trophic specialization, which is hypothesized to fuel their rapid speciation in the East African Great Lakes. Much is known about the genes involved in cichlid jaw and craniofacial development. However, it is still unclear what salient sources of variation gave rise to trophic-niche specialization, facilitating adaptive radiation. Here, we explore two sources of transcriptional variation that may underlie species-specific disparities in jaw morphology. Using whole transcriptome RNA-sequencing, we analyze differences in gene expression and alternative splicing, at the end of postlarval development, in fully functional jaws of six species of cichlids from the Lake Tanganyika tribe Tropheini. Our data reveal a surprisingly high degree of alternative splicing events compared with gene expression differences among species and trophic types. This suggests that differential trophic adaptation of the jaw apparatus may have been shaped by transcriptional rewiring of splicing as well as gene expression variation during the rapid radiation of the Tropheini. Specifically, genes undergoing splicing across most species were found to be enriched for pharyngeal jaw gene ontology terms. Overall, jaw transcriptional patterns at postlarval developmental stage were highly dynamic and species-specific. In conclusion, this work indicates that shifts in alternative splicing could have played a more important role in cichlid adaptive radiation, and possibly adaptive radiation in general, than currently recognized.
Introduction
Connecting genetic variation and morphological evolution is of fundamental importance for the understanding of organismal diversity (Carroll 2000; Hoekstra and Coyne 2007; Wray 2007; Stern and Orgogozo 2008). Coding mutations, affecting the genome architecture are in general assumed to be involved in morphological change (reviewed in Martin and Orgogozo 2013; Powder etal. 2014; Küpper etal. 2016; Lamichhaney etal. 2016) and regulatory variation, for example via transcription, is another major source of phenotypic variation that can enhance the adaptive potential of protein-coding genes through a variety of mechanisms (Wray 2007; Romero etal. 2012; Santos etal. 2014; Indjeian etal. 2016). The connection of genotype, gene regulation, and environmental input in shaping adaptive morphological structures is not fully understood (Schlichting and Pigliucci 1998; Pfennig etal. 2010), but it has become clear that adaptive morphologies are not only shaped in a complex developmental pathway but during the entire life span of an individual (Fujimura and Okada 2007, 2008) and in continuous feedback with the environment (Pfennig etal. 2010). Aside from the important insights from developmental model organisms, evolutionary model systems (e.g., species flocks of cichlid fishes in the East African lakes and Darwin’s finches) where adaptation and rapid speciation co-occurs, contributed significantly to the ecological and evolutionary aspects of development.
Since the importance of regulatory variation was first proposed by King and Wilson (1975), the role of differential gene expression in evolution has been extensively studied in model and nonmodel organisms (Carroll 2008). The two major forms of heritable transcriptional regulation that enhance proteomic diversity, and thus potentially phenotypic diversity, are cis-regulatory modulation of gene expression and alternative mRNA splicing. With the availability of whole transcriptome sequencing, intriguing broad patterns have emerged regarding the aforementioned mechanisms. It was shown that differences at the transcriptome level are associated with species- and organ-specific modifications over large evolutionary timescales (Blekhman etal. 2010; Brawand etal. 2011; Barbosa-Morais etal. 2012; Merkin etal. 2012) and also with the rapid evolution of adaptive traits over short evolutionary time (Terai etal. 2003; Wittkopp etal. 2008; Parsons etal. 2014; Powder etal. 2014; Santos etal. 2014; Mallarino etal. 2016). However, the global patterns of alternative splicing are less well understood outside the arena of humans and model species. Since its discovery four decades ago, it has gone from being an exciting novelty to a ubiquitous mechanism in multicellular eukaryotes (Berget etal. 1977; Chow etal. 1977). Due to the substantial expansion of coding capacity it provides, the high frequency of alternative splicing in vertebrates is assumed to be correlated with their higher phenotypic complexity (Xing and Lee 2006; Kim etal. 2007; Kornblihtt etal. 2013). Recently, splicing was shown to diverge more rapidly than gene expression differences between vertebrate lineages, thereby orchestrating species-specific disparities, whereas gene expression was more conserved at the organ-specific level (Barbosa-Morais etal. 2012; Merkin etal. 2012; Reyes etal. 2013). These findings brought to light the fascinating evolutionary dynamics of transcriptional rewiring by alternative splicing in comparison to gene expression regulation. Additionally, intron retention, a form of splicing which was initially considered to be a consequence of mis-splicing, is now thought to play a nontrivial role in organismal development via transcriptional fine tuning (Braunschweig etal. 2014) and production of new RNA and proteins isoforms (reviewed in Wong etal. 2016). To date, the importance of both alternative splicing and intron retention in adaptive radiations, which are prime case studies of rapid evolutionary divergence, has not been evaluated in detail.
Cichlid fishes in the Great East African Lakes are one of the most spectacular cases of adaptive radiation in vertebrates, exhibiting extensive morphological and ecological diversity (Kocher 2004). Lake Tanganyika in particular, with ∼250 species, hosts the most genetically and ecologically diverse cichlid species flock with lineages highly specialized to feed on various food sources (Liem 1973; Takahashi and Koblmüller 2011). It is postulated that the decoupling of the oral and the pharyngeal jaws, together with their efficient brood care, were “key-innovations,” giving cichlids a decisive advantage to outcompete other lineages (Liem 1973). A recent paper by Brawand etal. (2014) explored the genome sequences of five cichlid species to reveal that gene expression divergence associated with microRNAs, along with other factors, may have given rise to such innovative potential and spectacular phenotypic diversity. However, it is still unclear what genomic substrate permitted cichlids to diversify over and above other lineages (Berner and Salzburger 2015). Overall, the first wave of genomic studies in other radiating and nonradiating lineages have shed light on the genomic architecture underlying rapid diversification and identified some loci underlying speciation traits or “key innovations” (Alföldi etal. 2011; Dasmahapatra etal. 2012; Jones etal. 2012; McGaugh etal. 2014; Zhang etal. 2014; O’Brown etal. 2015; Almen etal. 2016; Feiner 2016; Küpper etal. 2016; Tuttle etal. 2016). Yet, we are still some way from clarifying the salient sources of variation that give rise to adaptive radiation, and if these determinants are a general pattern or not.
It has been argued that the two sets of jaws in cichlids are functionally decoupled and evolve as separate modules (Liem 1978), so that natural selection can act on the distinct anatomical features in an independent manner (Hulsey etal. 2006; Powder etal. 2015; Le Pabic etal. 2016). The molecular mechanisms underlying jaw development in cichlids are intensely studied and have established the involvement of a series of key developmental genes implicated in this process (Albertson etal. 2005; Parsons and Albertson 2009; Roberts etal. 2011; Hu and Albertson 2014; Parsons etal. 2014; Powder etal. 2014; reviewed in Ahi 2016). Several significant quantitative trait loci (QTLs) controlled by hedgehog signaling pathway, and specifically the regulatory locus ptch1 have also been mapped (Cooper etal. 2011; Roberts etal. 2011; Hu and Albertson 2014; Parsons etal. 2015, 2016). Concerning the evolution of the genetic and regulatory pathways resulting in species-specific disparities, it is important to note that adaptive morphologies are not only shaped in embryonic and postembryonic development, but during the entire life span of an individual (Fujimura and Okada 2008; Powder etal. 2015). Species-specific structures are first shaped during embryonic, postembryonic, and larval development, to subsequently follow a species-specific trajectory of change toward adulthood that is independent from embryonic patterning at the molecular level (Powder etal. 2015). In addition to the aforementioned, an adaptive morphology is continuously fine-tuned by environmental stimuli in the context of phenotypic plasticity (Meyer 1987). Two major life-history phases exist: 1) species-specific adaptive morphologies are formed through a series of complex gene regulatory processes during embryonic and postembryonic and often larval development; and 2) postlarval development and growth, where the structures continue to change independently from embryonic patterning through dynamic gene activity patterns, also allowing for environmentally induced modification in the context of phenotypic plasticity. For cichlid fishes, the first phase was shown to pass 32 stages (Fujimura and Okada 2007) and the second being subdivided into two distinct transition phases termed “Early juvenile to Late Juvenile” and “Late Juvenile to Adult” (Fujimura and Okada 2008).
In addition to the studies of embryonic and postembryonic development cited earlier, other studies have focused on the genetics of jaw modification through phenotypic plasticity (Meyer 1987; Muschick etal. 2011; Gunter etal. 2013; Gunter and Meyer 2014; Schneider etal. 2014; van Rijssel etal. 2015; Parsons etal. 2016). Efforts have been made using RNA-seq to identify the genes (Gunter etal. 2013) and gene regulatory networks (Schneider etal. 2014) underlying postdevelopmental phenotypic plasticity of the cichlid lower pharyngeal jaw. It is yet to be seen if the same regulatory genes and pathways that evoke plastic responses, are also responsible for more rigid and permanent species-specific disparities. Additionally, evidence for genetic assimilation of a plastic response to different diets at the ptch1 locus has also been reported by Parsons etal. (2016) in Lake Malawi cichlids. With regards to alternative splicing, only one study has looked into its role in the East African cichlid adaptive radiations so far (Terai etal. 2003). Specifically, the authors found that the hagoromo gene, which is involved in body colouration, evolved nine alternatively spliced isoforms in the East African cichlid radiations and that younger radiations had more isoforms than older radiations. Whether this phenomenon is widespread in the evolution of other key traits, such as jaws, is yet to be determined.
Here, we use whole transcriptome sequencing data to investigate species-specific differences in gene expression and alternative splicing regulation among six cichlid species from Lake Tanganyika adapted to distinct trophic niches. Our study attempts to complement ongoing studies on embryonic and postembryonic development, by specifically focusing on gene regulation of fully developed jaws during postlarval development and growth. Thus, we intended to test the relative significance of the two above-mentioned mechanisms in maintaining and further modifying divergent jaw morphologies that evolved from a single common ancestor. This study provides the first broad overview of species-specific disparities in transcriptional trajectories between cichlid species adapted to different diet regimes and also surveys the role of alternative splicing in cichlid adaptive radiation.
Materials and Methods
Species Description, Fish Husbandry, and Sampling
Six species of cichlid fish from Lake Tanganyika (Simochromis diagramma, Tropheus moorii, Tropheus duboisi, Limnotilapia dardennii, Ctenochromis horei, and Gnathochromis pfefferi) with three broadly defined trophic niches (i.e., herbivore, omnivore, carnivore) were used in this study (fig. 1;Konings 1998; Wanek and Sturmbauer 2015). In terms of foraging mode, the species span previously defined groups of benthic (herbivore) to limnetic (carnivore), with intermediates (omnivore) (Cooper et al. 2010). We note that there clearly are species-specific distinctive features subdividing our gross categorization. This is particularly true for the two intermediates classified as omnivores, in that T. duboisi shows a tendency toward algae browsing and L. dardennii toward carnivory. Fish were bred under standardized rearing and food conditions at the fish breeding facility at the University of Graz. Postspawning, the eggs of each species were taken from mouth-brooding females and raised separately in gently shaking beakers under constant conditions (24.5 ± 1 °C, 12 light/12 dark hour cycles). Once the eggs hatched, the larvae were monitored until the yolk-sac was completely absorbed into the body cavity. According to the classification of Fujimura and Okada (2007, 2008) established for Oreochromis niloticus, the stage of completion of postembryonic development was defined as the time point at which an individual has completely resorbed its yolk sac and starts to swim freely to forage for food. This was classified as the onset of the juvenile phase, as stage 26 (yolk sac absorption). The fish were sacrificed according to the Austrian animal husbandry ethical codes, the standard length was measured, and the “lower suspensorium” (oral jaws and lower pharyngeal jaw) was dissected in a standardized way and preserved in RNAlater (Qiagen) (supplementary fig. S1, Supplementary Material online).
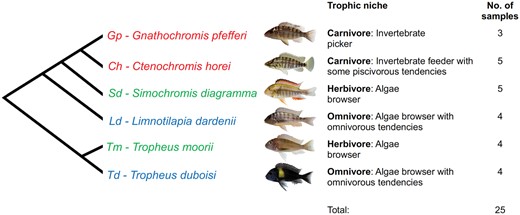
—Phylogenetic relationship, trophic niche description, and number of RNA-seq samples per species of the Lake Tanganyika cichlid fishes analyzed in this study. Trophic niches were divided into broad “herbivore,” “carnivore,” and “omnivore” categories.
RNA Library Preparation and Sequencing
The preserved samples were homogenized by using Lysing Matrix A tubes (MP Bio) in a FastPrep-24 (MP Bio) homogenizer, further extraction was done using RNeasy Mini Kit (Qiagen). Total RNA qualities and quantities were measured first with NanoPhotometer (Implen) and later with 2200 TapeStation (Agilent) either using High Sensitivity RNA ScreenTapes or RNA SreenTapes. Individuals with a RIN value <7 in one of their extracts were excluded from this study. TruSeq RNA Sample Prep Kit V2 (Illumina) was used to individually indexed paired-end libraries for each sample with unique adapters. Library qualities were checked using D1000 ScreenTapes, diluted, and libraries were multiplexed to peak molarities and sequenced on an Illumina HiSeq machine at the Biomedical Sequencing Facility in Vienna (Austria).
Read Filtering and Mapping
Approximately ten million paired-end 101-bp sequences were obtained for each sample. The FastX toolkit (http://hannon-lab.cshl.edu/fastx_toolkit/) was used to trim the reads to a length of 92 bp, and reads containing 20% or more bases with a Phred Quality score of <30 were discarded. The filtered, high-quality reads from each sample were mapped separately to the O. niloticus reference genome (Brawand etal. 2014) using TopHat2 (Kim 2013). This program operates by splitting reads over breakpoints. Each read is split into multiple segments and mapped to exon–exon boundaries, so splice-junctions can be found, and splice variation can be captured. After mapping, only concordantly mapped reads were retained in the final BAM alignment. Duplicate reads were marked using Picard (http://picard.sourceforge.net/) to avoid any expression biases mediated by PCR duplicates.
Differential Gene Expression Analysis
Gene expression counts of the O. niloticus gene annotation (Brawand etal. 2014) were quantified for each sample transcriptome using HTSeq-count (Anders etal. 2015). Differential gene expression was analyzed using the Bioconductor DESeq2 package (vesion 1.10.1; Love etal. 2014) implemented in R statistical software (version 3.2.4; R Development Core Team 2014). DESeq2 (Love etal. 2014) and edgeR (Robinson etal. 2010) are the two of the most popular tools for differential gene expression analysis but there is no consensus on the optimal method. Negative binomial based methods such as DESeq2 are reported to be more appropriate for experiments with five or less biological replicates per sample (Schurch etal. 2016) like in this study. Prefiltering was done to remove genes with low (< 5) read counts across all samples in order to speed up analysis and avoid biases in fold change due to weakly expressed genes as recommended by Love et al. (2014). All libraries were simultaneously normalized using the default settings in DESeq2. A size factor was calculated for each sample as the median across genes of the ratio of each gene’s read count per sample compared with the mean read count of that gene across all samples (method described in Anders and Huber 2010). Shared information across all genes was used to estimate the dispersion parameter, that is, within group variability. Gene-wise dispersions were rescaled using empirical Bayesian shrinkage toward the fitted relationship between mean expression and dispersion, based on the number of replicates and the closeness of the fit to the true dispersions. This accounted for gene-specific variation in the data.
Differential gene expression was tested by grouping samples according to species, and each sample within a species represented a “biological replicate.” Pairwise comparisons between all species were conducted to identify species-specific differences in gene expression using a generalized linear model, described in Love etal. (2014), based on the negative binomial distribution of the estimated size factors and dispersions. The species were not grouped according to the broad trophic niches described in figure 1 as we did not want to compromise species-specific signals in the data. Comparisons were evaluated using Wald’s test to determine the log2-fold change difference (see Love etal. 2014 for details). False discovery rate (FDR) (Benjamini and Hochberg 1995) correction was used to account for multiple testing (p.adjust value cut-off of <0.05). We also conducted hierarchical clustering of Pearson correlation values of gene expression for genes that were differentially expressed in the pairwise comparisons using R statistical software (version 3.2.4; R Development Core Team 2014) to evaluate the similarities across samples.
Alternative Splicing Analysis
In addition to differential gene expression, mRNA-seq data can be used to study alternative splicing by evaluating isoform/exon expression. Two major approaches have been developed to do this that either involve 1) transcript assembly and quantification (Trapnell etal. 2010) or 2) bypass the assembly step and quantify exon usage, thus circumventing the need for a robust isoform annotation (Katz etal. 2010; Anders etal. 2012). The first approach is challenging due the accrual of uncertainties from the assembly step that reduce inferential power, thus making the second approach more tractable. We chose state-of-the-art software DEXSeq (version 1.16.10; Anders etal. 2012) to analyze differential exon usage as it accounts for biological variation across replicates. Another advantage of using DEXSeq is that it based on a similar generalized linear model as DESeq2 (Love etal. 2014), which we used for differential gene expression. And this makes the results from the two software more comparable.
A modified HTSeq-count script provided in the DEXSeq package (Anders etal. 2012) was used to quantify exon expression counts for each transcriptome based on the O. niloticus gene annotation (Brawand etal. 2014). If the exon boundary was not the same in all transcripts, then the exon was split in two or more parts (“bins”) and a read that overlapped multiple bins was counted for each of those bins. Differential exon usage (DEU) was calculated as evidence for alternative splicing as it identifies changes in the expression of exons that are not solely the outcome of overall up- or down-regulation of the gene (Anders etal. 2012).To test for DEU, a similar generalized linear model based on the negative binomial distribution of the estimated size factors and dispersions as in DESeq2 was employed, with the additional parameter of bin counts (Anders etal. 2012). Default normalization of libraries was conducted and the variability in the data was estimated using per-exon (bin) dispersions calculated using a Cox-Reid adjusted profile likelihood estimation, then a dispersion-mean relation was fitted to the dispersion values individually. The fitted values were taken as a prior in order to shrink the per-exon estimates toward the fitted values. Pairwise comparisons between species were conducted to test for DEU for each exon in each gene across all the samples using an interaction model (∼ sample + exon + species: exon) and a likelihood ratio test. The P values were corrected using FDR (Benjamini and Hochberg 1995) and a p.adjust cut-off of <0.05 was applied. Hierarchical clustering of Pearson correlation values of exon expression the same way as for gene expression (described earlier).
Open Reading Frame Annotation and CDS Validation
Gene isoforms in the six species of cichlids were extracted from the assembled transcriptomes using ANGSD (Korneliussen etal. 2014) and BEDTools (Quinlan and Hall 2010). TransDecoder (http://transdecoder.github.io) was used to de novo annotate open reading frames ORFs in the expressed transcripts to ensure that they contained viable coding sequences (CDS). NCBI BLAST (Altschul etal. 1990) was used to align these CDS sequences to two related species of fish, Danio rerio and Gasterosteus aculeatus.
Gene Ontology Analysis
Out of the 26,993 O. niloticus genes, 13,964 are annotated with gene ontology (GO) terms. GO analysis of significantly differentially expressed genes and alternatively spliced genes was conducted using the GOseq Bioconductor package (Young etal. 2010) that accounts for gene length bias using the probability weight function (PWF), which is the probability that a gene will be differentially expressed based on its length alone. The PWF weighs the chance of selecting each gene when forming a null distribution (approximated using the Wallenius distribution) for GO category membership. Correction for multiple testing was performed using FDR correction (Benjamini and Hochberg 1995). Significantly overrepresented GO terms (p.adjust value <0.05) were visualized using REVIGO (http://revigo.irb.hr) and GO networks were made using Cytoscape (Smoot etal. 2011).
Variant Calling, Splice-Site Prediction, and Intron Quantification
Single nucleotide polymorphisms (SNPs) and indels were called in each BAM file using SAMtools (Li etal. 2009). SNPs and indels with Phred quality score < 30 and coverage < 8 were discarded. Splice-site disrupting variants were predicted using SnpEff v4.2 (Cingolani etal. 2012) configured for the O. niloticus gene annotation. The SnpEff algorithm annotates splice-site disruptors in the following categories: 1) splice donor variant (SS-D): the variant hits a splice donor site which is two bases after the end of coding exon, except the last exon); 2) splice acceptor variant (SS-A): the variant hits a splice acceptor site which is two bases before exon start, except for the first exon); 3) splice region variation (SS-R): a sequence variant in which a change has occurred within the region of the splice-site, either within 1–3 bases of the exon or 3–8 bases of the intron. SS-D and SS-A variants are categorized as “high impact” and SS-R as “low impact.” The expression of 216,761 introns in the O. niloticus annotation was quantified in each mRNA sample using a modified HTSeq-count python script provided in the DEXSeq package (Anders etal. 2012) for each transcriptome. Introns with coverage of less than four reads were discarded.
2D Geometric Morphometrics
To investigate of the differences in jaw morphology between our species, we performed 2D geometric morphometric analysis of the oral and pharyngeal jaws in three individuals from each species, at the same life stage as we used for the mRNA-seq analysis (stage 26; Fujimura and Okada 2007). We euthanized each fish with an overdose of tricaine mesylate (MS-222), and fixed it in 4% formalin in phosphate buffered saline for at least 6 days. A Scanco µCT 40 (SCANCO Medical AG, Brüttisellen Switzerland) collected microcomputed tomography (micro-CT) images of the head of each individual; the TINA Geometric Morphometrics Toolkit combined these into 3D reconstructions (Schunke etal. 2012). Landmarks and semilandmarks (supplementary table S1 and fig. S2, Supplementary Material online) were placed on a 2D projection of each reconstruction using tpsDig2 (ver. 2.30; Rohlf 2017a); tpsrelw32 (ver 1.60; Rohlf 2017b) aligned the landmark sets. We used MorphoJ (ver. 1.06d; Klingenberg 2011) to perform a principal component analysis (PCA) on allometrically adjusted data to determine the shape changes responsible for variability in our specimens. More details on the method can be found in the supplementary file S1 in Supplementary Material online.
Results
Differential Gene Expression Analysis
For each of the 25 transcriptome libraries, after filtering, ∼60–75% of the reads mapped to the reference O. niloticus genome and gene expression was quantified for 23,300 genes in each sample. We conducted a PCA of the gene expression counts for each sample (fig. 2). The samples clustered according to species and PC1 separated the species between the carnivorous and the more herbivorous ones. In total, we detected 56,538 differential gene expression events across the 15 pairwise comparisons (fig. 3) in 16,394 genes (70.4% of all O. niloticus genes) (table 1 and supplementary file S2, Supplementary Material online). Only 166 of these genes were consistently differentially expressed in majority of the comparisons (50% or more) and 2,318 genes (14.1%) were only differentially expressed in only 1 of the 15 comparisons made (table 1). The number of differentially expressed genes between comparisons ranged from ∼1,600 to ∼5,600 genes (fig. 3). The highest differences (>4,000 differentially expressed genes) were in comparisons involving G. pfefferi and S. diagramma. The lowest differences were observed in C. horei versus L. dardennii (1,655) and C. horei versus T. moorii (1,844). Of the 16,394 differentially expressed genes, 90 are candidates previously implicated in jaw and craniofacial development (supplementary file S3, Supplementary Material online). Hierarchical clustering of the samples based on Pearson correlation values of expression of the genes differentially expressed in the 15 pairwise comparisons (n = 16,394) revealed conflicts in some species (fig. 4A). Simochromisdiagramma, T. moorii, G. pfefferi, and four of the five C. horei samples produced species-level clustering, however the T. duboisi and L. dardennii samples gave inconsistent signals, with some samples appearing in multiples clusters. There was no clustering of species based on similar trophic niches as defined in figure 1, nor did we find any phylogenetic signal in the clustering.
Summary of Results from the Differential Expression (DE) Analysis of Genes and Exons
| Differentially Expressed Genes | |
|---|---|
| Total genes tested | 23,300 |
| Genes DE in at least one comparison | 16,394 |
| Genes DE in only one comparison | 2,318 |
| Genes DE in 50% or more comparisons | 166 |
| Differentially Expressed Exons (DEU) | |
| Total exons tested | 265,520 |
| Exons DE in at least one comparison | 58,310 |
| Exons DE in only one comparison | 21,634 |
| Exons DE in 50% or more comparisons | 58 |
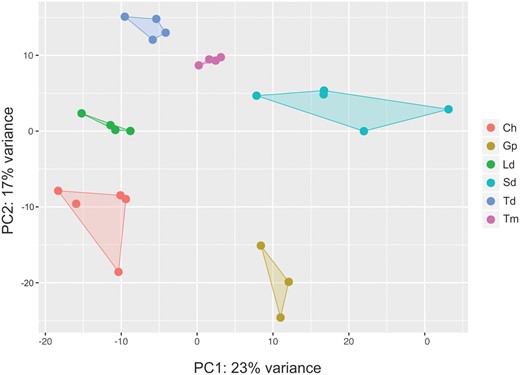
—Principal component analysis (PCA) of the normalized expression counts of 23,300 O. niloticus annotated genes in 25 RNA-seq samples.
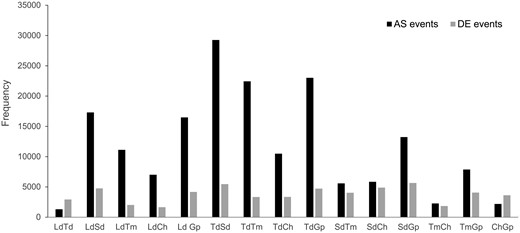
—Number of differential gene expression (DE) events and alternative splicing (AS) events in 15 pairwise comparisons across all six species. Differential exon usage (DEU) was calculated as an indicator of alternative splicing.
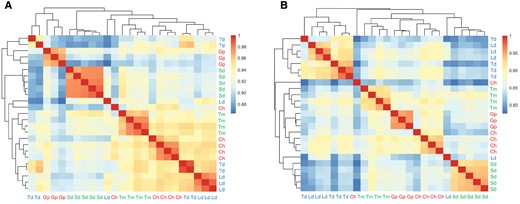
—Conservation of gene and exon expression signatures. (A) Clustering of samples based on Pearson correlation values of 16,394 genes expression counts of genes differentially expressed in at least one pairwise comparison (B) Clustering of samples based on Pearson correlation values of 58,310 exon expression counts of exons differentially expression in at least one pairwise comparison. Samples were colour coded based on the broad trophic niche categories: green = herbivores; red = carnivores; blue = omnivores.
Alternative Splicing Analysis
Alternative splicing was investigated by testing differential exon usage (DEU) of 265,520 exons annotated in the O. niloticus genome across all samples. We detected 175,438 DEU events in total across all 15 comparisons (fig. 3) in 58,310 exons of 11,689 genes (50.2% of all O. niloticus genes) (table 1). Only 58 of these exons always showed differential expression across 50% or more comparisons and 21,634 exons (37.1%) were differentially expressed in only 1 of the 15 comparisons made (table 1). The highest differences (>20,000) were observed in comparisons involving T. duboisi. The lowest differences were between T. duboisi versus L. dardennii (1,314), C. horei versus G. pfefferi (2,192), and C. horei versus T. moorii (2,270). Hierarchical clustering of the samples based on Pearson correlation values of expression of significant DEU exons in the 15 pairwise comparisons (n = 58,310) gave some signal of trophic niche clustering for the carnivorous (C. horei and G. pfefferi) and omnivorous (T. duboisi vs. L. dardennii) cichlid species samples (fig. 4B). The herbivorous S. diagramma and T. moorii formed distinct but distant clusters.
Alternative Splicing Patterns of Candidate Genes Involved in Craniofacial Development
Of the 11,689 genes with significant DEU in our data set, 66 are candidate genes previously implicated in jaw and craniofacial development (supplementary file S3, Supplementary Material online). We examined the exon usage of these genes to elucidate splicing patterns in Lake Tanganyika cichlids and found many of these exons to exhibit species-specific and even diet-specific patterns of exon usage, whereas other exons were conserved in usage across all species (fig. 5 and supplementary file S2, Supplementary Material online). The annexin A6 (ANXA6) is a calcium pathway gene that has 28 exons of which 18 show significant DEU between at least two species, whereas the other 10 exons have conserved usage across all species (fig. 5A). The exon (E) usage of E11–E13 and E17–E19 of these genes distinguish the omnivores (L. dardennii and T. duboisi) from the herbivores and carnivorous cichlids (C. horei, G. pfefferi, S. diagramma, and T. moorii). The exon usage of Thrombospondin 3 (THBS3), a matrix-related gene, has 30 exons of which 13 show significant DEU (fig. 5B) and 17 are conserved. E2–E4 exhibit trophic-niche-specific exon usage, with the herbivorous species (S. diagramma and T. moorii) having the lowest expression. Collagen type VI alpha 3 chain (COL6A3) has 36 of its 42 exons showing DEU in at least one pairwise species comparison (fig. 5C). Only six of the exons in this gene are consistently conserved in exon usage across all species. E12–E15 show distinct trophic-niche exon usage with the omnivorous species having twice expression than the herbivores, whereas E27–E29 show distinct species-specific exon usage. The usage of E1–E29 is highest in omnivores, intermediate in carnivores, and lowest in herbivores. However, this trend is reversed in E29–E42 with the herbivores consistently having higher expression than the omnivores.
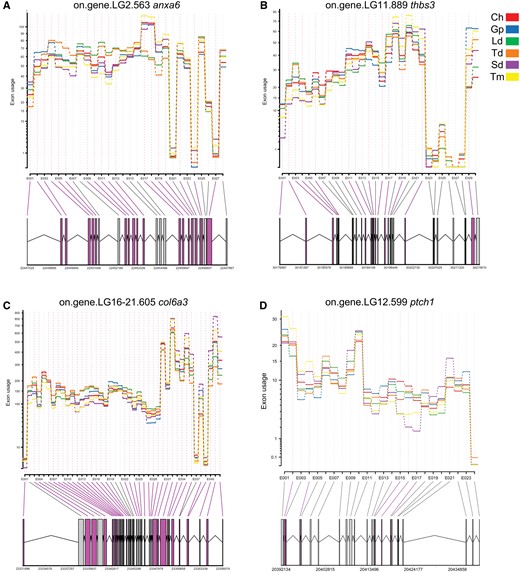
—Gene models depicting alternative splicing patterns of genes. Exon usage was used to measure exon expression after normalizing for total gene expression biases. Significant differentially expressed exons are coloured in magenta (p.adjust < 0.05).
Additionally, we also inspected splicing patterns of genes which have not been previously implicated in cichlid craniofacial development, but have been associated with morphogenesis in other model organisms. For example, Myosin Heavy Chain 9 (MYH9) is highly spliced across the six cichlid species. MYH9 has 45 exons of which only 7 show conserved exon usage. The exons of this gene consistently have distinct species-specific trajectories but species from similar trophic niches have more similar exon usage patterns. Similar to the COL6A3 gene, the omnivores have the highest exon usage in some exons (E1–E16) of the MYH9 gene, whereas the herbivores have the highest exon usage in other exons (E29–E45).
Validating Gene Isoforms
Gene isoforms were validated by de novo annotating the ORF and CDS in the transcripts in the jaws of each species. Supplementary file S4 in Supplementary Material online contains the de novo annotated transcript IDs and the corresponding O. niloticus transcript ID, as well as the BLAST best hits to the D. rerio and G. aculeatus genomes.
GO Functional Analysis
Genes and genes with exons that were significantly differentially expressed were tested for functional overrepresentation of GO terms. The most overrepresented GO terms (p.adjust value <0.05) in all of the differentially expressed genes were associated with fundamental biological processes such as “translation,” “embryo development,” “protein transport,” “oxidation–reduction,” and “cellular component organization” (supplementary file S5, Supplementary Material online). All genes with differential exon usage had overrepresented terms related to housekeeping functions such as “translation,” “vesicle-mediated transported,” along with the notable exception of terms potentially associated with jaw development such as “regulation of Rho protein signal transduction,” “cytoskeleton,” “septin complex,” and “embryonic cranial skeleton morphogenesis” (supplementary file S5, Supplementary Material online). “RNA-splicing” and “mRNA-processing” terms were also overrepresented in genes with differential exon usage. We further limited the GO analysis to genes and exons only differentially expressed in 50% or more pairwise comparisons in order to hone in on genes whose transcriptional signatures vary broadly among the six species and their respective trophic groups. As before, we found differentially expressed genes to be associated with essential developmental processes and “calcium channel activity” (supplementary file S5, Supplementary Material online). Genes that had differential exon usage in 50% or more pairwise comparisons were associated with biological processes such as “pharyngeal system development,” “regulation of muscle contraction,” “microtubule assembly,” and “neuron differentiation” (fig. 6). The candidate genes with the “pharyngeal system development” annotation are listed in supplementary table S2 in Supplementary Material online.
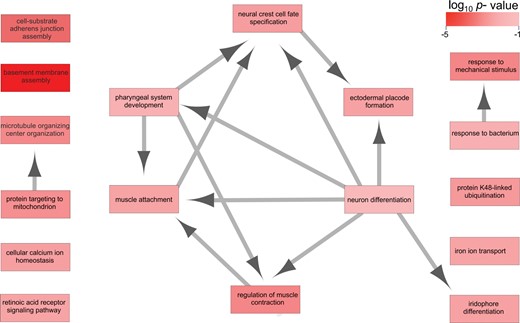
—Overrepresented gene ontology (GO) terms (p.adjust < 0.05) for biological processes of genes that show high differential exon usage in 50% or more pairwise species comparisons. The arrows represent the relationship between the “source” and “target” categories.
Intron Retention and Splice-Site Disrupting Mutations
In order to investigate the previously documented association of intron retention and splice-sites (Sakabe and de Souza 2007), we quantified the number of introns retained in the mRNA of each cichlid species and found large variation in intron retention among the six species (fig. 7A). Limnotilapiadardennii and T. duboisi had low number of introns retained (675 and 1,068, respectively) which was significantly lower (P < 0.05, Welch’s t test) than other four species. The number of introns retained were not significantly different between L. dardennii and T. duboisi. The maximum number of introns retained were in G. pfefferi (6,451) with 18.2% of the 23,300 genes containing introns. SNPs and indels in splice-sites (SS) predicted to have low-impact effects on genes were far more numerous in each species than high impact ones (fig. 7B). The maximum number of low-impact SS variants per gene was nine but we found only a maximum of two high-impact SS variants was tolerated per gene. The expression of introns in genes with two high-impact SS variants was significantly lower than that of genes with one high-impact SS variant (p.adjust = 0.0001635 Tukey’s HSD ANOVA test). The expression of introns in genes with low-impact SS variants was not significantly different using Tukey’s HSD test. We conducted a regression analysis to see the relationship of the propensity of genes with many SS disrupting variants to retain more introns but we did not identify any significant relationship (data not shown).
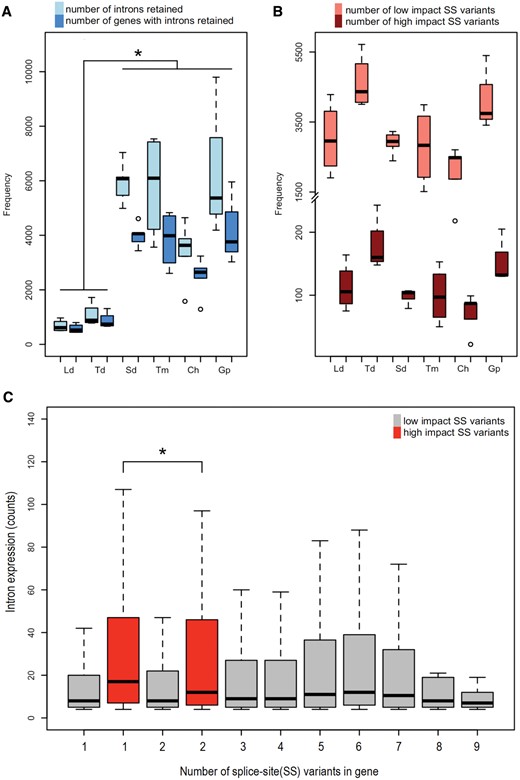
—Intron retention in cichlid transcriptomes. (A) Number of introns retained and number of genes with introns retained per species (*) P value < 0.05 (pairwise comparisons using Welch’s t test). (B) Number of high-impact and low-impact splice-site disrupting variants per species. (C) Expression of introns in genes with high- and low-splice-site disrupting variants (*) p.adjust = 0.0001635 (Tukey’s HSD ANOVA test).
Geometric Morphometric Analysis of Jaw Shape
Due to the limited number of samples in our geometric morphometric analysis, our results are best treated as preliminary findings. Our PCA of size-corrected shape data indicated that the first three principal components (PC) together accounted for 73.1% of the shape variability in our specimens—PC1 accounted for 50.6%, PC2 accounted for 12.1%, and PC3 accounted for 10.4%. Conspecifics clustered closely together in PC-space (supplementary fig. S3a, Supplementary Material online). PC1 separated herbivores and carnivores, whereas PC2 mainly separated the invertebrate picking carnivore G. pfefferi from the somewhat larger prey sucking carnivore C. horei and omnivorous L. dardenii (supplementary fig. S3a; see supplementary file S1, Supplementary Material online for shape changes described by each PC). The omnivorous species did not cluster together, but instead were located close to groups reflecting their main feeding tendencies—T. duboisi near the two algae browsing species, and L. dardenii near the carnivorous C. horei. Of our study species, G. pfefferi had the most unique morphology—it did not cluster closely with any other species in shape space.
Discussion
Adaptive radiations are special events in evolution during which novel species evolve at a rapid pace in tight connection with ecological diversification (Schluter 2000). Previous evidence has indicated that rapid adaptive change in closely related lineages may be brought about by transcriptional rewiring (Terai etal. 2003; Wittkopp etal. 2008; Mallarino etal. 2016) but there is still a dearth of studies exploring regulatory variation in adaptive radiations. Here, we show that gene expression and alternative splicing patterns in cichlid jaws are highly dynamic, species-specific, and to some extent trophic-niche specific in the youngest cichlid radiation in Lake Tanganyika. We also find evidence suggesting that transcriptional variation generated via splicing may have contributed to pharyngeal jaw diversification. Furthermore, our mRNA-seq data indicates that the transcriptional machinery required for the maintenance and modification of specialized jaw shape is already distinct and fully functioning at the key life stage that marks the onset of independent life of the fry.
Alternative Splicing Exceeds Gene Expression Differences in the Lake Tanganyika Cichlid Adaptive Radiation
Our comparative mRNA-seq analysis revealed an excess of alternative splicing events compared with gene expression differences in the jaws of these cichlid species (fig. 3). There were ∼3 times more alternative splicing events than differentially expressed genes in the whole data set and there were also more unique splicing events than gene expression events (table 1). This suggests that species-specific patterns of alternative splicing are diverging faster than differential gene expression patterns in the Lake Tanganyika Tropheini adaptive radiation and thus may have contributed more significantly to jaw diversity and complexity. Two previous studies on model vertebrates also showed that splicing patterns may contribute more to species-specific differences than differential gene expression (Barbosa-Morais etal. 2012; Merkin etal. 2012). However, these findings concerned a greater evolutionary distance of ∼300 Ma. We find that this trend also holds true for the much younger radiation of tribe Tropheini that diverged over a substantially shorter evolutionary time span of ∼2.8 to ∼0.7 Ma (Koblmüller etal. 2010). Our study emphasizes the importance of alternative splicing as a mechanism for (at least) the evolution of distinct morphologies in adaptive radiation, and especially in cichlid adaptive radiation where RNA-seq studies up until now have solely focused on differential in gene expression (Gunter etal. 2013; Henning etal. 2013; Bohne etal. 2014; Kavembe, Franchini, etal. 2015; Santos etal. 2016). These studies have therefore missed an important and potentially powerful source of genetic variation. As we concentrated on the postlarval development of jaw transcriptional patterns, it remains to be shown if the same genetic factors that maintain a morphology, also play a role during embryonic and postembryonic morphological development. Because this is a complex time series of gene regulatory network activity, it will be interesting to find parallels between different developmental stages toward a better understanding of the link between genotype and phenotype. We indeed identified a number of genes that were previously found in evo-devo studies to be involved in the networks triggering embryonic and postembryonic development and also plastic responses, as discussed in detail below.
In all but two pairwise species comparisons, alternative splicing events outnumbered the differentially expressed genes (fig. 3). The only pairwise comparison where alternative splicing events did not exceed DE genes were L. dardennii versus T. duboisi (two omnivores) and C. horei versus G. pfefferi (two carnivores). Notably, both cases concern intratrophic comparisons within the broad trophic categorization described in figure 1. Nonetheless, a caveat to this interpretation might be that the cichlid trophic niches differentiating the species may actually be more fine-scale, so that assigning species into such gross categories may not necessarily be accurate enough. Therefore, our analysis was also conducted at the species-level with additional assignment to the relatively gross trophic niche framework—herbivores, carnivores, and omnivores. Even though the overall frequency of alternative splicing events exceeded the instances of differentially expressed genes in our species comparisons, we acknowledge that it is difficult to ascertain the relative contribution of gene expression and alternative splicing to cichlid jaw evolution from our methodology. It must be noted that over half of the genes tested in this study (54.1%) were regulated by both the aforementioned mechanisms (supplementary fig. S4, Supplementary Material online). However, our analysis cannot establish which of these two mechanisms was more important during cichlid jaw evolution or if they acted synergistically. A smaller percentage (10.0%) of genes were regulated only through splicing compared with differential gene expression (35.9%) (supplementary fig. S4, Supplementary Material online). These results suggest that a greater proportion of genes are regulated transcriptionally by differential gene expression than splicing, but the amount of protein-coding variation generated by the latter is more extensive overall. The functional implications of our findings will have to be evaluated in the future but the results presented here reinforce the role of gene expression in adaptive evolution, and illuminate the potential role of alternative splicing in adaptive radiation. As our analysis relies on the O. niloticus reference genome, better resolution of cichlid alternative splicing may be achieved with improved gene and isoform annotation. A combined effort to discover, verify, and functionally characterize alternative splice forms are important directions for future research.
Transcriptomic and Morphometric Consolidation of Trophic Niches
The trophic categories we used in this study were relatively broad, and based on the available ecological information (fig. 1). The whole transcriptome PC clustering of species in our study separated the two herbivores on PC1 and also the two carnivores (fig. 2). The clustering of the omnivores was interesting as T. duboisi was closer to the herbivores and L. dardenii was closer to the carnivore C. horei. Even though T. duboisi is a sister species of the algae browser T. moorii, it lives in deeper waters where algae is sparse (Konings 1998). Despite this deep-water habitat, its patterns of clustering in both the whole transcriptome analysis (fig. 2) and especially in the geometric morphometric analysis (supplementary fig. S3, Supplementary Material online) suggest that it maintains an adaptation to algae browsing. Overall, the segregation of species based on morphometrics is similar to that based on whole transcriptomic features, however our limited number of species and individuals precludes an in-depth correlation analysis. Patterns with respect to trophic specialization are similar in both analyses, with the omnivorous species having morphologies reflecting their main dietary tendencies and the carnivorous species having divergent morphologies due to their different prey items. This is consistent with our previous findings for overall adult morphology (Wanek and Sturmbauer 2015). One notable contrast between our morphometric and transcriptomic analyses is the much tighter clustering of the herbivores in morphospace compared with transcriptome PC, possibly indicating the ability of disparate regulatory pathways to produce very similar morphologies (Wittkopp etal. 2003; Berens etal. 2015; Oke etal. 2017). We anticipate that the insights from our transcriptomic and morphological findings will prove useful for refining these trophic groupings, particularly in the case of omnivorous species.
Some Trophic Niches Have Conserved Splicing Patterns
Clustering of gene (fig. 4A) and exon (fig. 4B) expression correlation values invariably placed conspecific individuals together into distinct clusters, with the exception of the two omnivores L. dardennii and T. duboisi, which were overlapping. Contrary to our expectation, there was no gene expression clustering of species from similar trophic niches. However, the exon expression dendogram clustered the two carnivores and the two omnivores together indicating conservation of splicing patterns during the evolution of these two trophic niches. Although the two carnivores may have clustered together due to recent common ancestry, as they are sister species, this is not the case for the two omnivores. If common ancestry would generally correlate to gene expression, one would expect to observe a similar trend in the gene expression clustering, which we did not observe. The splicing patterns of the two herbivores were disparate, suggesting that parallelism in terms of similar trophic morphologies was brought about, at least in part, by different molecular mechanisms. The overall absence of phylogenetic signal in both gene and exon expression clustering of all six species suggests that for lineages undergoing adaptive radiation, transcriptomic data might not be appropriate for phylogenetic inference of species relationships, contrary to the observations for comparatively more slowly evolving and more distantly related mammals (Brawand etal. 2011). This is most likely a result of rapid radiation, where insufficient time has not allowed for complete lineage sorting of most loci during speciation and thus transcriptome data may include lots of homoplastic information.
Candidate Genes for Cichlid Species-Specific Jaw Divergence
Research into the genetic and regulatory basis of cichlid craniofacial development and trophic adaptation has shed light on many crucial genes and pathways. At the forefront of this investigation have been the Bmp, Hedgehog, and Wnt pathways, which are also evolutionarily conserved in other teleosts and vertebrates. We found evidence of many genes in the aforementioned pathways to be differentially expressed and alternatively spliced between the species in our study (supplementary file S3, Supplementary Material online). For example, the BMP (bone morphogenetic protein) expression has been implicated in cichlid jaw morphologies (Albertson etal. 2003; Parsons and Albertson 2009) and this gene was both differentially expressed and alternative spliced in our data set. Other components of the BMP pathway such as bmp2, bmpr1b, and nog genes also showed variation in gene expression between species, whereas bmp1 and igf1 genes only varied in splicing between species. This shows that within key pathways, different genetic mechanisms could be in play to facilitate pathway divergence, and thus phenotypic divergence. This makes it difficult of disentangle the functional effects and importance of one mechanism over another, especially in complex quantitative traits such as jaw development.
The Wnt pathway plays an important role in skeletogenesis, and thus has been a prime focus of studies dealing with trophic morphology (Mallarino etal. 2011; Parsons etal. 2014; Bhullar etal. 2015; Powder etal. 2015). For instance, expansion of this pathway and increased expression of LEF1 gene in the early stages of development in Lake Malawi cichlids leads to differences in levels of bone mineralization and a more rounded craniofacial profile and shorter preorbital skull region in the benthic (algae browsing) Labeotropheus fuellerborni (Parsons etal. 2014). Interestingly, this gene was not differentially expressed in our data set, but it was differentially spliced between the carnivorous C. horei (“limnetic species” with a longer preorbital region, forward-pushed craniofacial morphology) and S. diagramma and T. duboisi (“benthic species” with a shorter-preorbital region and rounded craniofacial morphology). Furthermore, the LBH gene, a downstream member of the Wnt pathway that has been show to underlie continuous variation in lower jaws of cichlids (Parsons etal. 2014) was also differentially spliced between C. horei and S. diagramma. This suggests that such genes may be playing a similar role in morphological evolution in the Lake Tanganyika Tropheini radiation as they are in Lake Malawi radiation, possibly supporting the case of evolutionary parallelism via gene reuse.
Hedgehog is a fundamental developmental pathway in vertebrates and the shh gene plays a key role in morphogenesis (Ingham and Mcmahon 2001). It has also been shown to be important for pharyngeal arc derivatives in cichlids (Cho etal. 2015). Moreover, alleles of Ptch1, a receptor of hedgehog proteins, were found to be alternatively fixed in benthic scraping versus limnetic sucking Lake Malawi cichlid species (Roberts etal. 2011; Hu and Albertson 2014). In our data set, the shh gene was neither differentially expressed nor alternatively spliced but its downstream genes, ptch1 and glis1, showed extensive transcriptional variation (supplementary files S2 and S3, Supplementary Material online). Ptch1 was differentially expressed between species, but only in comparisons involving S. diagramma, which is an algae browser, similar to what would be a benthic/scraper phenotype as described by Roberts etal. (2011). Ptch1 also showed evidence of splicing between herbivorous algae browsers (benthic/scraping) and the intermediate omnivores and carnivores (limnetic/sucking) (fig. 5D). Thus, like the Wnt pathway genes mentioned earlier, the ptch1 gene also might exhibit functional evolutionary parallelism across the African cichlid radiations. This would be in accordance with the “Out of Tanganyika” hypothesis whereby the modern haplochromines (consisting of Tropheini, Lake Malawi, and Lake Victoria cichlids) arose rapidly from a generalist “plastic” riverine ancestor. Thus the same cache of standing genetic variation was revealed repeatedly in response to similar selection pressures (Salzburger etal. 2002,, 2005; Pfennig etal. 2010; Paaby and Rockman 2014). Remarkably, evidence for evolution of plasticity via genetic assimilation at a ptch1 locus has been reported in Lake Malawi cichlids (Parsons etal. 2016).
Recent research has also revealed a transcriptional regulatory network underlying jaw phenotype plasticity in cichlids (Gunter and Meyer 2014; Schneider etal. 2014). Interestingly, many of the genes in this network are also differentially expressed and alternatively splicing in our species comparisons (supplementary file S3, Supplementary Material online). Anxa6, a calcium-dependent membrane protein, was found to be differentially expressed in the lower pharyngeal jaws of cichlids after 3–8 months on a soft versus hard diet and the thbs3, which mediates cell-matrix interactions, gene was differentially expressed after 8 months. Anxa6 was also one of the early response gene in mice bone remodeling after mechanical loading (Mantila Roosa etal. 2011). Both these genes demonstrated trophic-niche-specific splicing signatures for some exons (fig. 5A and B). Moreover, thbs3 (tsp3) has also been implicated in sex-specific jaw divergence in Lake Malawi cichlids (Parsons etal. 2015).
It also needs to be mentioned that in addition to the shh gene, other genes such as eve1, dlx22, wnt7b, which have previously shown to be key in craniofacial development in cichlids and other model organisms, were not differentially expressed or alternatively spliced in our data set (supplementary file S3, Supplementary Material online). This could mean that their activity is not key for morphological differences at the end of postlarval development. In addition, we identified many genes that have not been implicated thus far in cichlid jaw development to be extensively spliced in our study species (supplementary file S3, Supplementary Material online). For example, the myosin 9 (MYH9) gene could be a novel candidate for cichlid jaw divergence. Myosin is a key regulator of muscle strength and contractility, and specifically MYH9 has been implicated in cleft lip and palate defects in humans (Chiquet etal. 2009). Further analysis of these candidate genes within the context of jaw specialization and development may have the potential to provide new insights into how diet influences jaw morphology.
Gene Regulatory Evolution in the Light of the Flexible Stem Hypothesis
Currently, the gene regulatory networks triggering embryonic and postembryonic development, versus those triggering the postlarval development and growth of a functional morphology are neither fully understood, nor distinguished appropriately. This is important because the Flexible Stem Hypothesis proposes that “postdevelopmental” phenotypic plasticity of an adaptive trait in the ancestral species of a radiating lineage enables the emerging species to rapidly occupy diverse ecological niches (West-Eberhard 2003). Postlarval development of growth is a dynamic process of bone turn-over and remodeling. Genetic assimilation can only proceed through the acquisition of these postlarval developmental pathways allowing for phenotypic plasticity, at the earlier life stage of embryonic and postembryonic development. According to theory, subsequent genetic assimilation (Waddington 1953) canalizes ancestrally plastic traits toward genetically hardwired phenotypes, allowing for an increasingly efficient exploitation of the colonized ecological niches (Braendle and Flatt 2006). The ancestral phenotypic plasticity of the seeding species concerns postlarval adaptive morphological change, long after embryonic and postembryonic development is completed. Thus, these “postdevelopmental networks” are either equally responsible for both life phases—or must be recruited—for alternative developmental pathways. In fact, the core of the flexible stem hypothesis rests on the condition that postlarval (genetic) mechanisms altering a fully developed morphology in the “generalist” seeding species are recruited at an earlier life stage during embryonic and postembryonic development to become subsequently fixed (Waddington 1953). This can mean that the involved genetic regulation processes are the same at embryonic, postembryonic, and postdevelopmental stages, or that the regulatory cascades are switched on at an earlier life stage. Developmental biologists call this phenomenon heterochrony or more specifically, paedomorphosis (McNamara 2012). As most previous studies in cichlids have either focused on embryonic and postembryonic jaw development or the phenotypic plasticity of jaws, our study contributes to the field by suggesting candidate genes that are involved in postlarval development and growth. These might as well constitute the genetically hardwired and assimilated species-specific genes governing evolutionary cichlid jaw divergence, such as the ptch1 gene discussed earlier.
Alternative Splicing May Play a Role in Driving Cichlid Pharyngeal Jaw Specialization
Given the extensive genetic variation produced by alternative splicing, it is intuitive to assume that it may play a role in adaptive evolution, especially since even single splice variants can have far reaching developmental consequences (Keren etal. 2010; Gueroussov etal. 2015). For example, alternative splicing mechanisms have been shown to play a role in the evolution of adaptive phenotypes in mice through the splicing of the agouti gene (Mallarino etal. 2016) and in adult African cichlids via the splicing of the hagoromo gene (Terai etal. 2003). Additionally, in mice it was also shown that extensive splicing occurs in bone formation genes following mechanical loading of bone (Mantila Roosa etal. 2010). If this is likened to the process of postdevelopment of jaw bones in cichlids subjected to varied diets (hard and soft), one can hypothesize that similar splicing mechanisms may be in play driving jaw remodeling. We found a notable overrepresentation of GO terms that have been associated with jaw development (i.e., cytoskeletal remodeling and cranial morphogenesis) in alternatively spliced genes in our data set (supplementary file S5, Supplementary Material online). Specifically, genes that were consistently differentially spliced in a large number of species comparisons were enriched for GO terms associated explicitly with pharyngeal jaw development (fig. 6). This is especially interesting because in contrast, genes that were differentially expressed were overrepresented more with GO terms associated with fundamental developmental biological processes (supplementary file S5, Supplementary Material online). This implies that the genetic architecture of cichlid jaws may have been shaped by alternative splicing alongside other factors such as differential gene expression during adaptation to different trophic niches in Lake Tanganyika. The above-mentioned study by Terai etal. (2003) found the number of alternative isoforms of the hagoromo gene to be indirectly correlated with age of radiation, with older radiations having fewer isoforms than the younger radiations (Terai etal. 2003). Compared with the other tribes in Lake Tanganyika (∼5–12 Ma), the Tropheini are relatively young (∼2.8–0.7 Ma) and thus this could be the reason we observe extensive splicing in their transcriptomes. In the future, it will be valuable to see if this trend holds true by transcriptome-wide comparison to older and younger lineages, specifically for candidate jaw genes that were identified in our study.
High-Intron Retention in Cichlid Species with More Specialized Diets
Intron retention is considered to be the rarest alternative splicing mechanism in vertebrates and invertebrates, but is common in plants and fungi (Keren etal. 2010; Wong etal. 2016). This is the first study, to our knowledge, to analyze transcriptome wide retentions of introns in cichlid jaws. We found a higher percentage (up to ∼18%) of the genes in the cichlid species to retain introns (fig. 7A), compared with human transcriptomes where ∼14.8% of genes were found to retain at least one intron (Galante etal. 2004). Intron retention was significantly higher in S. diagramma, T. moorii, G. pfefferi, and C. horei compared with T. duboisi and L. dardennii. Assuming that the riverine ancestors of the lacustrine cichlids which were most likely “generalist” feeders (Schluter 2000), or omnivorous, one would expect that the two omnivores (T. duboisi and L. dardennii) in our data set are closest to the ancestral state. Thus, our results propose that species adapted to highly specialized herbivorous and carnivorous diets retained more introns in their transcriptomes, implicating this mechanism in trophic adaptation. Furthermore, intron retention has been associated with weak splice-sites humans (Sakabe and de Souza 2007) as alternative splicing is based on the recognition of introns and exons by the splicing machinery, guided by splice-sites. However, we found no relationship of intron retention with low- or high-impact splice-site disrupting mutations (fig. 7B).
Even though intron retention has long been considered a consequence of mis-splicing, mounting evidence suggests that it may not be an error after all but an important regulatory mechanism (Wong etal. 2016). Accumulation of introns could bestow an evolutionary advantage by increasing transcriptomic/proteomic diversity (Kim etal. 2007). Alternatively, it could play a role in the functional fine-tuning of the transcriptome by tagging unnecessary or potentially deleterious transcripts for nonsense-mediated decay (Maquat 2005; Braunschweig etal. 2014). Transcripts with high-impact SS variants are predicted to be tagged for nonsense-mediated decay, whereas transcriptomes low-impact SS variants may be tolerated to a greater extent in accordance with the role of intron retention in transcriptional “fine tuning.” This seems to be the case for cichlid transcriptomes, as the maximum number of high-impact SS variants within a gene were only two compared with nine for low-impact SS variants (fig. 7C). Additionally, the expression of introns in genes with two high-impact SS disrupting variants was significantly lower than those with only one high-impact SS variant, indicating the existence of some transcriptional control. Our findings point to a potentially novel or at least understudied molecular mechanism of jaw evolution in cichlids, and perhaps adaptive radiations in general. Further studies are needed to understand the functional implications of intron retention as well as transcriptional fine-tuning in the evolution of adaptive phenotypes in cichlids.
Supplementary Material
Supplementary data are available at Genome Biology and Evolution online.
Acknowledgments
The study was supported by the Austrian Science Fund (FWF) project number P22737-B09 to CS. PS was supported by the PhD program of the Austrian Centre of Limnology (University of Graz). The authors would like to thank W. Gessl for fish husbandry, G. G. Thallinger (Graz University of Technology) for access to the bioinformatics resources and advice on computational analysis and M. Kemler for valuable comments on the article. We should also like to thank the referees for their insightful comments.
Author Contributions
PS conceived, designed, and conducted the bioinformatics analyses and wrote the article. CB constructed the mRNA-seq libraries and edited the article. HM conducted the geometric morphometric analysis. CS conceived and supervised the study and contributed to the writing of the article.
Literature Cited
R Development Core Team.
Author notes
Associate editor: Marta Barluenga
