


Abstract
Arbuscular mycorrhizal (AM) fungi provide a range of functions in natural and managed ecosystems. However, the trajectory of AM fungal diversity after land degradation is poorly known. We studied the succession of AM fungi along an agricultural recultivation chronosequence after open-cast mining near Cologne, Germany. We used high-throughput sequencing of the large-subunit ribosomal RNA genes to characterize the soil AM fungal communities of 10 agricultural fields spanning 52 years of recultivation. During three years, soils are recultivated with a legume, and then converted to agriculture to be later returned to local farmers implementing conventional agriculture. Our data reveal a quick and strong recovery of AM fungal richness after a few years of recultivation, but also a rapid decline following years of conventional agriculture. The community structure was strongly correlated to mineral nitrogen and phosphorus, richness peaking at high N:P ratio. This work represents the first molecular data documenting temporal patterns of AM fungal communities in agriculture; it shows the deleterious effect of conventional agricultural practices on AM fungal communities developing over time. Nonetheless, the highly dynamic nature of AM fungal communities suggests strategies for site-level management for which considering N:P stoichiometry is crucial.
INTRODUCTION
Arbuscular mycorrhizal (AM) fungi are a monophyletic group (Schüßler, Schwarzott and Walker 2001), recently moved to the subphylum Glomeromycotina in the phylum Mucoromycota (Spatafora et al.2016) which form a widespread symbiosis in roots of ∼70% of angiosperm land plants (Brundrett 2009), including many crop plants. They facilitate plant acquisition of soil nutrients in exchange for photoassimilates (Smith and Read 2008), and improve plant resistance to drought (Augé 2001) and pathogens (Veresoglou and Rillig 2012). AM fungi may stabilize soil organic matter promoting C sequestration in soil (Verbruggen et al.2016) and improve soil aggregation (Leifheit et al.2014). Therefore, their functional potential in soil restoration (Asmelash, Bekele and Birhane 2016) and sustainable agriculture (Rillig et al.2016) was recently emphasized. However, the fate of indigenous AM fungal diversity in restoration attempts toward agriculture recultivation is not studied (Asmelash, Bekele and Birhane 2016).
Here we studied AM fungal diversity dynamics along a 52-year chronosequence of a soil recultivation after lignite open-cast mining. Chronosequences provide important insights into community succession, which in turn offers opportunities to manipulate successional processes for restoration purposes (Walker and Reddell 2007). At our study site, former soil of agricultural fields and loess-containing overburden are removed to extract lignite before a mixture of both is used as basis for agricultural recultivation at the back side of the mine. The recultivation chronosequence follows a three-phase management. After soil substrate re-deposition, the N2-fixing alfalfa (Medicago sativa L.) is cultivated over 3 years to allow a physicochemical and biological recovery. Then fields are converted to agricultural practices as resumed with barley (Hordeum vulgare L.) with careful fertilization and tillage. Finally, fields are returned to local farmers that pursue conventional agricultural practices typical of the area with a crop-rotation system of sugar beet (Beta vulgaris L.) and winter wheat (Triticum aestivum L.). Our study site provides a unique opportunity to investigate the fate of AM fungal diversity in restoration attempts and the consequences of agricultural soil recultivation.
Recent research suggests a high dispersal ability of most AM fungi. A low level of endemism of AM fungi was reported at the global scale (Davison et al.2015) as well as the arrival of AM fungi in newly exposed substrates within a year after disturbance (Dodd et al.2002; García de León et al.2016). However, soil chronosequence studies of long-term ecosystem development revealed that dispersal limitation influences the AM fungal community structure in early successional stages (Krüger et al.2015; Martínez-García et al.2015). The comparison of a newly constructed island and a natural island showed that the AM fungal community establishing in the new island is only a subset of the AM fungal community on the natural island (Nielsen et al.2016). Moreover, AM fungal taxa differ in their dispersal ability (Chagnon et al.2013).
During long-term conventional agricultural land use (50–100 years), important changes in soil properties such as nutrient availability, nutrient retention or soil aggregation occur. Because plant productivity is primarily limited by nutrient availability, farmers turn to fertilization. Nitrogen (N) and phosphorus (P) fertilization have contrasting effects on AM fungal richness (Liu et al.2014) depending on soil P or N limitation. Indeed, N:P stoichiometry of soil is critical for plants' benefits from AM fungi (Treseder and Cross 2006; Johnson 2010). Moreover, deep tillage and pesticide application are conducted to reduce weed and pathogen occurrence. These practices impose strong ecological and evolutionary selection on AM fungi in agroecosystems (Verbruggen and Toby Kiers 2010). They have been repeatedly shown to strongly harm the AM fungal community, with decreased diversity and shifts in community composition (Schenck, Siqueira and Oliveira 1980; Jansa et al.2002; Oehl et al.2003; Verbruggen et al.2015).
Agricultural soil chronosequences have the potential to deliver important insights into the effect of long-term fertilization and other soil management practices of conventional agriculture (e.g. tillage, pesticide application). Therefore, agricultural soil chronosequences have the hitherto untapped potential to link AM fungal diversity to soil nutrient status, nutrient availability and soil degradation over time. Despite previous studies having shown the deleterious effects of conventional agriculture on AM fungal diversity and the selection of particular AM fungal taxa (Schenck, Siqueira and Oliveira 1980; Verbruggen et al.2012), the characterization of the identity of these taxa and diversity estimates are lacking and have been hampered by low-resolution and low-throughput methodology. Here, we used Illumina sequencing of ribosomal DNA (rDNA) to characterize the soil AM fungal diversity aiming at more completely retrieving the pool of taxa.
We hypothesize that dispersal limitation would influence the AM fungal community at early stages of the soil recultivation but would decrease with time since recultivation, being replaced by species sorting due to environmental filtering as the main factor influencing the AM fungal community at later stages. We expect to observe increasing richness over time in the first years of recultivation due to increasing time to disperse. Due to environmental filtering of agricultural practices, we also expect that AM fungal diversity would decrease over time accompanied with a change in community composition in fields converted to conventional agriculture, and that this would be correlated to the soil nutrients status.
MATERIAL AND METHODS
Chronosequence description
The sampling site is located in the open-cast lignite mining area between Cologne, Aachen, Mönchengladbach, and Düsseldorf. Mean annual temperature and rainfall are 9.8°C and 829 mm, respectively. Rhinish lignite is extracted after removing the former agricultural soil and subjacent bedrock layers by RWE Power AG (Essen, Germany). During this process, loess loam of former topsoils and loess parent material are mixed and used as basis for agricultural recultivation at the backside of the mine. This procedure results in a strong dilution of soil biological properties and nutrients of the topsoil. Sample plots are located in an area of 25 km2 (6°15΄0΄E to 6°21΄0΄E and 50°50΄5΄N to 50°53΄0΄N). The mean elevation above sea level is 124 ± 22 m.
Recultivation starts after soil substrate deposition. During the first three years, fields are permanently covered by alfalfa and never receive artificial fertilizers or biocide treatments during this period (hereafter referred to as Phase 1). In the following two years of recultivation, agricultural practice is resumed with barley, and a N:P:K (1:0.4:0.6) fertilization of 437 kg ha−1 a−1 (hereafter referred to as Phase 2). Afterwards, fields are returned to farmers and conventionally managed with a crop sequence of winter wheat after sugar beet, one tillage a year to 30 cm depth, and a continuous management practice following area-typical agricultural practice and plant-protection guidelines (hereafter referred to as Phase 3).
Soil sampling
Finding true replicates is often difficult in ecology and particularly for chronosequences. True age replicates were unavailable in the study area. As such, we relied on within-field repetitions and on a high number of sites to ensure that our age gradient is independent of a field site effect. The selection of sampling sites consists of 10 fields with increasing time since recultivation (i.e. field age) and agricultural history (Fig. 1). Recultivation Phase 1 comprised fields restored in 2015, 2014 and 2013 with permanent alfalfa cultivation. Recultivation Phase 2 contained fields restored in 2012 and 2011, recently converted into agricultural systems by RWE Power AG (Germany). Recultivation Phase 3 included fields restored in 2006, 1990, 1979, 1971 and 1964, which were returned to local farmers. These 10 fields are distributed along a spatial transect as the digging machine mostly moves forward in one direction (northward before 2006 and eastward after 2006). Therefore, difference in time since recultivation and spatial distance between fields are by necessity strongly correlated (Mantel test based on Euclidean distance: r = 0.88, P = 0.001).
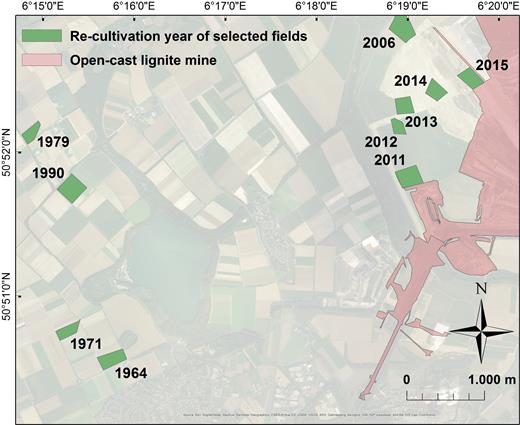
Location map of fields and year of recultivation.
Sampling occurred during two consecutive days in early March 2016. We sampled soil, rather than roots, in order to capture AM fungal communities not predominantly influenced by any given crop. Fields size was ∼6 ha. We sampled five soil replicates per field, keeping a minimum distance of 25 m from the borders: four samples from each field corner and one from its center, with an average distance of 107 ± 26 m in between (Table S1, Supporting Information). Each replicate contained five pooled soil cores of 10 cm depth and 6 cm diameter, which originated from a square of 5 m × 5 m around the sampling GPS point. The resulting 50 soil samples were sieved to 2 mm and stored at –80°C until DNA extraction.
Twenty-one soil physico-chemical variables were measured for each of the 50 samples (Table S1). These variables comprise soil properties that have been shown to affect AM fungal community composition and the AM symbiosis (e.g. pH, calcium carbonate, water content, inorganic and total N, plant-available P). Standard methods have been used to determine gravimetric water content, soil pH, potentially plant-accessible P and K, mineral N such as NH4+ and NO3−, and mineral S (VDLUFA 2017). DIN guidelines (DIN 2017) have been applied to determine total P, S, Mg, K, Ca, B, Mn and Fe, organic carbon (Corg) and total nitrogen (Nt).
DNA extraction, PCR amplification and Illumina sequencing
DNA was extracted from 250 mg of pooled soil cores using the PowerSoil DNA isolation kit (MoBio Laboratories Inc., Carlsbad, CA, USA), following the manufacturer's instructions. For each soil DNA sample, we amplified the LSU D1-D2 using a nested-PCR approach first targeting the small subunit-internal transcribed spacer-large subunit (SSU-ITS-LSU) region using a mixture of Glomeromycotina-specific primers (Krüger et al.2009). Using a mixture of competing primers variants that target AM fungi variants precludes the preferential amplification of certain and/or abundant taxa (Krüger et al.2009), as well as the propagation of errors, due to delayed exponential amplification. A third PCR was conducted to amplify the D1-D2 region of the LSU. We used the universal fungal primers LR2rev (5΄-GAAAAGAACTTTGAAAA-3΄, a new primer being the reverse-complement with few bases shifts of the LR2 primer)-LR3 (5΄-CCGTGTTTCAAGACGGG-3΄) (http://sites.biology.duke.edu/fungi/mycolab/primers.htm). The LSU universal primers target highly conserved regions, which ensures amplifying a subset region of all the long amplicons with the same probability for all taxa. The primers for the third PCR carried part of the sequencing primers. Amplicons were purified using a gel purification procedure (band excision of expected size and purification) using the DNA gel-purification kit (Macherey-Nagel, Düren, Germany) and were submitted to a fourth PCR to add sample-specific 8-nt long tag oligos allowing multiplex sequencing and the final part of the sequencing primers. We used the proofreading KAPA-hifi DNA polymerase which further reduces PCR errors. PCR reactions were performed in 25 μl containing 1 μl DNA template (for first and nested PCRs), 0.2 mM of each dNTP, 0.3 μM of forward primers, 0.3 μM of revere primers, 1X of KAPA-hifi buffer and 0.5 U of KAPA-hifi polymerase. PCR thermo-cycle conditions were as follows: initial denaturation at 95°C for 3 min, 30 cycles of denaturation—reduced to 10 cycles for the fourth PCR—at 98°C for 20 s, annealing at 60°C for 30 s and elongation at 72°C for 40 s, and a final elongation at 72°C for 2 min. Amplicons were purified with magnetic beads (GC Biotech, Alphen aan den Rijn, The Netherlands), and were pooled on an equimolar basis. The amplicon pool was sequenced using 2 × 300 bp paired-end MiSeq Illumina sequencing at the Berlin Center for Genomics in Biodiversity Research (BeGenDiv), Berlin. One eighth of a sequencing run equalizing an expected sequencing depth of 5000 000 reads was implemented.
Bioinformatics of sequence processing
Raw reads were demultiplexed searching for exact indexing-tags. Paired-end reads were merged and quality-filtered with a maximum error rate of 1 using USEARCH (Edgar 2010). Quality-filtered reads were dereplicated in OBITools (Boyer et al.2016) and singletons were removed. Additional quality-filtering was conducted by aligning non-singleton dereplicated sequences against a reference alignment of partial SSU-ITS-LSU rDNA Glomeromycotina sequences (Krüger et al.2012). The reference alignment was first trimmed to the targeted region. Alignment of our sequences was performed with the NAST algorithm (DeSantis et al.2006) in Mothur (Schloss et al.2009). Sequences that did not overlap the region were removed, as they are likely erroneous or non-targeted sequences (https://www.mothur.org/wiki/MiSeq_SOP). Quality-filtered sequences were sorted by abundance and were clustered into operational taxonomic units (OTUs) using UPARSE (Edgar 2013), which includes an internal chimera checking and removal of identified chimera. We tested several identity thresholds to cluster sequences into OTUs (80%, 85% and 90–100% with 1% steps), following the recommended procedure for similarity thresholds below 97% (http://www.drive5.com/usearch/manual/uparse_otu_radius.html). We choose the 97% identity threshold after observing a starting exponential increase in the number of Glomeromycotina OTUs at higher similarities (Fig. S1, Supporting Information). Using the 97% similarity threshold resulted in 126 Glomeromycotina OTUs (Fig. S2, Supporting Information), which is reasonable given (i) the known number of described Glomeromycotina species is ∼250 (www.amf-phylogeny.com), (ii) the expectation that diversity might be one order of magnitude higher (Krüger et al.2012), (iii) the high sequencing depth of Illumina technology and (iv) that the 97% similarity threshold might capture below-species diversity level with our approach. Nonetheless, we found that the diversity patterns along the chronosequence were highly consistent whatever the similarity threshold (Figs S3–S5, Supporting Information). Taxonomic classification of the representative sequence of each OTU was conducted using the Naive Bayesian Classifier (Wang et al.2007) against the 28S LSU training dataset of RDP II (Cole et al.2014) to identify Glomeromycotina and non-Glomeromycotina OTUs, using a bootstrap confidence threshold of 50% as recommended for short sequences (Cole et al.2014). Taxonomic classification of Glomeromycotina OTUs was refined using BLAST (Altschul et al.1990) on reference Glomeromycotina sequences (Krüger et al.2012) and the NCBI (Agarwala et al.2016) based on the best E-value (<10−5). Taxonomic classification was further guided by using a phylogenetic tree. Using the same procedure as above, sequences were aligned to a reference alignment of rDNA Glomeromycotina sequences (Krüger et al.2012). The phylogenetic tree was built with RAxML (Stamatakis 2014) by conducting a Bootstrap analysis (1000 bootstraps) and searching for the best-scoring maximum-likelihood tree under a GTRCAT model of nucleotide substitution. The phylogenetic tree was edited in FigTree (Rambaut 2012). Representative sequences of each 97% OTU found in this study have been deposited at ENA under accession number LT853258–LT853576, using custom PYTHON scripts (https://github.com/michaelgruenstaeudl/annonex2embl).
Analysis of AM fungal community structure
Sampling and sequencing efficiency were assessed using accumulation and rarefaction of the expected mean number of OTUs. AM fungal community composition was analyzed using multivariate analyses. OTU read counts per samples were transformed to relative abundance. To compare the species composition of communities, we calculated Bray-Curtis pairwise community dissimilarities. Community dissimilarities were visualized using Principal Coordinates Analysis (PCoA). Community variability (beta-diversity within sites) was calculated per field age, and we used a linear model to test the correlation with field age.
We identified the best predictors of community composition using Canonical Correspondence Analysis (CCA). We used Principal Components Analysis (PCA) on centered and scaled soil variables to extract the main soil abiotic gradients along the chronosequence. We used the variables that most contributed to the principal components in the CCA model. To account for spatial autocorrelation, we decomposed the variability in spatial distribution among samples into eigenvectors using Principal Coordinates of Neighbor Matrices (PCNM, Borcard and Legendre 2002) based on Euclidean distances between all samples (GPS coordinates). The significance of soil variables when PCNM vectors and field age were included to the model was tested with marginal tests. This model was compared to the model based on stepwise selection with all soil variables, field age and all PCNM vectors. Models were selected based on Akaike's information criteria (Burnham and Anderson 2002). Limit of permutation P-values for adding or dropping a term to the model was 0.05. To ensure that our results were not due to PCR bias (preferential amplification of certain taxa in the different PCRs), all multivariate analyses of community composition were repeated with presence/absence data.
We also tested whether OTU richness, OTUs richness per AM fungal family (absolute and relative number of OTUs) and relative family abundance per sample varied along the chronosequence using linear modeling with field age as explanatory variable. To ensure that observing a higher species richness in a sample was not due to the sequencing depth in that sample, we used both observed and rarefied species richness. Sequencing depth per sample strongly varied (mean 18 489.26 ± 10 259.92 SD; min = 14, max = 42 087). Samples were rarefied to a very low sequencing depth of 100 per samples (one 45-year-old field sample removed). For all univariate analyses, model selection (comparing linear, log-linear and quadratic estimates of log-transformed field age) was based on Akaike's information criteria.
To test whether individual OTUs showed phase preference along the chronosequence, we conducted indicator species analyses (Dufrênes and Legendre 1997) with samples grouped according to the three management phases. We considered an OTU to be an indicator at P < 0.05 after correction for multiple testing using the false discovery rate (Benjamini and Hochberg 1995).
All statistical analyses were conducted in R (R core team 2016) using ‘vegan’ (Oksanen et al.2017), ‘ade4’ (Dray and Dufour 2007) and ‘indicspecies’ (De Cáceres and Legendre 2009) R packages.
Analysis of tag-jumping sequencing errors
Errors on indexing-tags during sequencing (chimera or replication errors) result in an incorrect sample assignment of sequences, that is, tag-jumping. In this study, when attributing reads to samples based on indexing-tags combination identity, we searched for 24 indexing-tag combinations not included in the sequencing library. Reads that carried these combinations are unambiguous miss-assigned reads. Although we did not search for all possible non-existing combinations that could have arrived according to the set of forward and reverse indexing-tags included in our sequencing library, including those ‘non-existing’ samples in our analyses allowed us to obtain a rough estimate of potentially erroneous assignments of reads to samples.
RESULTS
Results of Illumina sequencing
From 2 377 171 raw reads from 50 soil samples along the chronosequence, we obtained 1360 791 (57%) quality-filtered reads (average length 404 bp, min = 333 bp, max = 430 bp). These sequences clustered into 323 OTUs at 97% similarity, of which 126 were classified as Glomeromycotina (Fig. S2), counting up 924 463 (38.9%) reads. OTUs from seven families were observed: Glomeraceae (65 OTUs, 47.6% of Glomeromycota reads), Diversisporaceae (25 OTUs, 25.2%), Claroideoglomeraceae (22 OTUs, 17.9%), Ambisporaceae (5 OTUs, 0.4%), Gigasporaceae (5 OTUs, 4.7%), Paraglomeraceae (4 OTUs, 1.3%) and Archaeosporaceae (4 OTUs, 2.9%). Accumulation and rarefaction curves of OTU richness saturated, showing that we were able to thoroughly cover the diversity in our study system (Fig. S6a and b, Supporting Information). All OTUs occurred in at least two samples, and 50% occurred in more than 11 samples (Fig. S6c). One OTU, OTU 2, assigned to Diversispora, was the most abundant OTU in our data set and occurred in every sample.
Community structure along the chronosequence
We observed a progressive temporal change in community structure along the chronosequence. Temporal community change occurred in three main phases in relation to the recultivation phases (Fig. 2) and was also evident within each phase. The PCoA of Bray-Curtis community dissimilarities (Fig. 2a) revealed that community composition in young, less than 4-year-old recultivated fields (Phase 1, 1–3 years, alfalfa RWE management) changed through time and showed a strong shift when fields were converted to agriculture practice (Phase 2, 4 and 5 years, barley, RWE). Community composition continued to change in older agricultural recultivation fields (Phase 3, 10–52 years, crop rotations by farmers; wheat at the time of sampling). The temporal turnover of species among years was linear over time (Fig. 2a, see also Fig. 5a), except in Phase 3 where communities were highly variable within and among fields of different ages. The composition of communities from the oldest recultivated field (52 years) was intermediate to communities from the 10-year-old field and from other old agriculture fields (26–45 years) (Fig. 2a). The same results were obtained with presence/absence record of OTUs (Fig. S7a, Supporting Information).
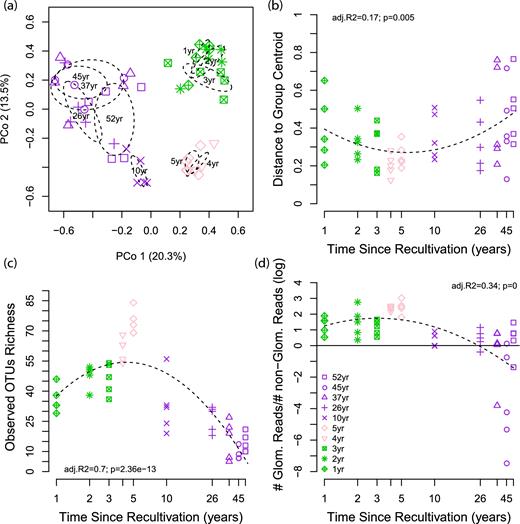
Soil Glomeromycotina community structure along a 52-year soil-recultivation chronosequence. (a) Principal Coordinates Analysis of community pairwise Bray-Curtis dissimilarities. First and second axes account for 20.3% and 13.5% of the variance, respectively. Ellipses denote 1 standard deviation around the group centroid of samples at different times since recultivation. (b) Multivariate dispersion (distance to group centroid) among samples (n = 5) within fields per time since recultivation, as a measure of within fields community variability. (c) Observed species richness among fields per time since recultivation. (d) Number of Glomeromycotina sequences relative to non-Glomeromycotina sequences along the chronosequence. The ratio was log-transformed. The plain line denotes equal number of Glomeromycotina and non-Glomeromycotina reads. Glom: Glomeromycotina. Green, phase 1, 1- to 3-year-old fields, alfalfa cultivation; pink, phase 2, fields recently converted to conventional agriculture (4 and 5-year-old fields, barley cultivation); purple, phase 3, agricultural fields returned to farmers (10 to 52-year-old fields, wheat cultivation).
Community variability among replicates (beta-diversity within fields, Fig. 2b, see Fig. S7b for presence/absence data) showed a unimodal trend along the chronosequence. It progressively decreased with time during Phase 1, reached a minimum in Phase 2 (highly similar communities in all samples) and progressively increased in Phase 3 to reach its maximum values in old agricultural fields.
OTU richness (alpha-diversity, Fig. 2c) showed the inverse unimodal trend along the chronosequence. It progressively increased with time during Phase 1, reached a maximum in Phase 2 and progressively decreased in Phase 3 to reach its minimum values in old agricultural fields. Similar trends were observed for rarefied species richness to 100 reads (Fig. S8, Supporting Information). Interestingly, most of the increase in species richness at higher similarity thresholds was observed for the 4- and 5-year-old fields (Phase 2) suggesting higher intra-OTU diversity (Fig. S5).
The number of Glomeromycotina sequences relative to non-target fungi showed the same unimodal trend along the chronosequence (with progressive change within each phase), peaking in Phase 2 and reaching its minimum (and being negative) at the end of Phase 3 (Fig. 2d). This was also observed for the raw reads number per sample and for Glomeromycotina sequences as well (Fig. S9, Supporting Information).
The OTUs richness per sample showed the same unimodal trajectory for all families, peaking in Phase 2 (Fig. 3a, Table S2), except for Paraglomeraceae, for which it increased over time. However, abundance (relative reads number and relative richness) varied between families along the chronosequence. Relative abundance and relative richness of Glomeraceae and Claroideoglomeraceae decreased with increasing field recultivation age, whereas Diversisporaceae, Gigasporaceae, Paraglomeraceae and Archaeosporaceae increased (Fig. 3b and c; Table S2, Supporting Information).
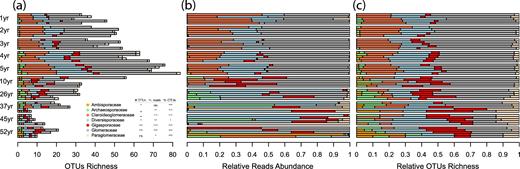
Abundance of Glomeromycotina families in soil along a 52-year soil-recultivation chronosequence, in terms of (a) absolute number of OTUs, (b) relative number of reads and (c) relative number of OTUs. Asterisks denote a significant correlation between the number of OTUs (#OTUs), the relative reads abundance (% reads) or the relative OTUs richness (% OTUs) and time since recultivation using linear model. •P < 0.1; *P < 0.05; **P < 0.01; ***P < 0.001.
Correlation between community structure and soil abiotic variables
The PCA of soil variables revealed two main gradients of soil properties along the chronosequence (Fig. S10, Supporting Information). PC1 (45.1% of the variance) discriminated fields by field age. Plant-available P was the main contributor, along with total N, organic C and humus, all with higher content in old agricultural fields (Fig. S10; Table S3, Supporting Information). PC2 (15.6% of the variance) discriminated fields recently converted to agriculture from the young and old agricultural fields. Nitrate content of the soil was the main contributor (19.5%). Plant-available P linearly increased with time. Nitrate content increased with time in Phase 1, peaked in Phase 2 and decreased then to its minimum value in old agricultural fields (Phase 3), leading to a high N:P ratio in Phase 2 (Fig. 4). Note the shift in N:P stoichiometry from 4 to 5-year-old fields (N:P > 1) to the 10-year-old field (N:P < 1). Finally, young fields were discriminated from the other fields based on higher soil Mg and Ca contents (Fig. S10, Table S3).
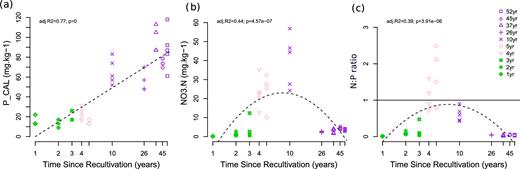
(a) Soil plant-available P and (b) nitrate contents, and (c) their ratio along a 52-year soil-recultivation chronosequence. Green, phase 1, 1- to 3-year-old fields, alfalfa cultivation; pink, phase 2, fields recently converted to conventional agriculture (4 and 5-year-old fields, barley cultivation); purple, phase 3, agricultural fields returned to farmers (10 to 52-year-old fields, wheat cultivation). Symbols represent the different times since recultivation. In panel c), the plain line denotes equal amount of plant-available P and nitrate.
The CCA showed a strong correlation between nitrate and plant-available P and AM fungal community composition, clearly separating the fields into the three recultivation phases, but also within each phase (Fig. 5). This correlation was observed for both relative abundance and presence/absence records of OTUs distribution (Fig. S11, Supporting Information). The significance of nitrate and plant-available P was robust to spatial autocorrelation and age (Table S4, Supporting Information). The best model based on stepwise selection always identified nitrate and plant-available P as strong predictors of AM fungal communities in both the relative abundance and presence/absence community matrix (Table S5, Supporting Information). Several spatial vectors were also selected, while field recultivation age was always included in the best model.
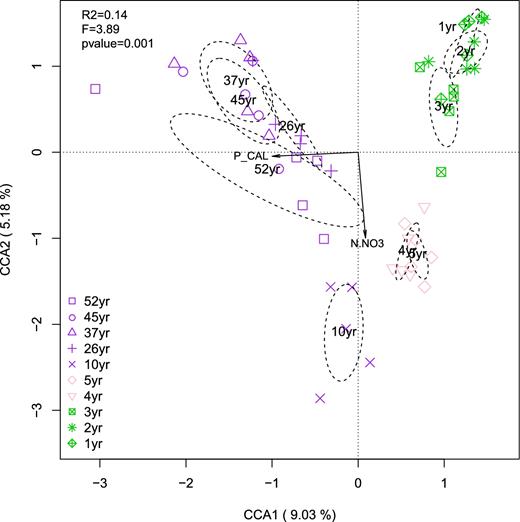
The CCA of soil Glomeromycotina community composition as a function of plant-available P and nitrate along a 52-year soil-recultivation chronosequence. The first two canonical axes explained 14.2% (R2adj = 0.11; pseudo-F = 3.89, DFmodel = 2, DFresidual = 47, P < 0.001) of the total variation in the community composition (axis 1 = 9%, axis 2 = 5.2%). Both CCA axes were statistically significant when the permutation test was conducted by axis (axis 1: pseudo-F = 4.95, DFmodel = 1, DFresidual = 47 P < 0.001; axis 2: pseudo-F = 2.84, DFmodel = 1, DFresidual = 47 P < 0.001). Ellipses denote 1 standard deviation around the group centroid of samples at different times since recultivation. Green, phase 1, 1- to 3-year-old fields, alfalfa cultivation; pink, phase 2, fields recently converted to conventional agriculture (4 and 5-year-old fields, barley cultivation); purple, phase 3, agricultural fields returned to farmers (10 to 52-year-old fields, wheat cultivation).
Phase-preference of individual OTUs
Plotting the relative abundance of the most represented OTUs per year since recultivation revealed a progressive and marked turnover in dominant OTUs, with main changes between the three phases, and also apparent within phases (Fig. 6a). Indicator species analysis revealed OTUs significantly more abundant in one phase than in others (Fig. 6b; Table S6, Supporting Information). We found 18 indicators OTUs of Phase 1, all assigned to Glomeraceae (10 OTUs) and Claroideoglomercaeae (8 OTUs). Phase 2 had the highest number of indicators OTUs (35 OTUs), with 14 Glomeraceae OTUs, 12 Diversisporaceae OTUs and 9 Claroideoglomeaceae OTUs. Only four OTUs were indicators of Phase 3: one Claroideoglomeraceae, one Diversisporaceae, one Paraglomeraceae and one Gigasporaceae (Fig. 6). The Gigasporaceae OTU was in fact mostly observed in the 10-year-old field and decreased in older fields.
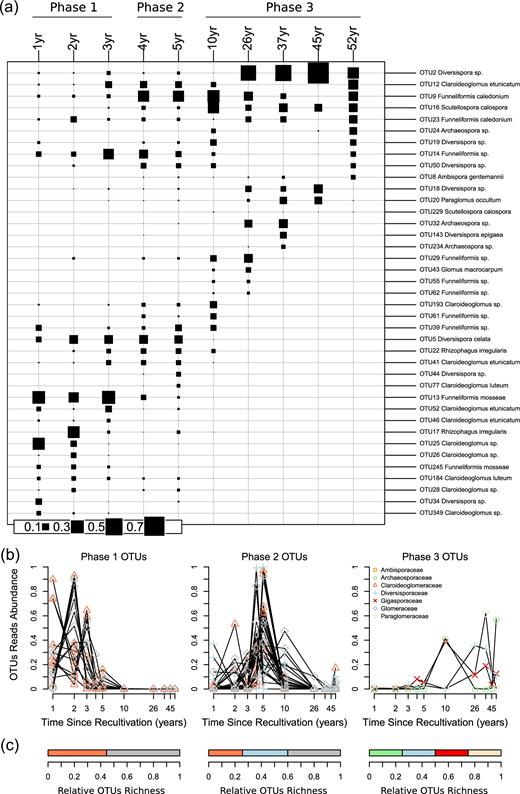
Glomeromycotina Operational Taxonomic Units (OTUs) succession along a 52-year soil-recultivation chronosequence. (a) Plot of the mean relative abundance of OTUs per time since recultivation. The 20 most represented OTUs per time since recultivation are presented (all OTUs occurred in more than 2 samples). (b) Relative number of reads per time since recultivation for OTUs that are significant indicators of phase 1 (1- to 3-year-old fields, alfalfa cultivation), phase 2 (4 and 5-year-old fields, barley cultivation) or phase 3 (10- to 52-year-old fields, wheat cultivation) in indicators species analysis. (c) Family-level abundance (relative number of OTUs) of indicators OTUs in phase 1, phase 2 and phase 3.
Importance of tag-jumping sequencing errors
A total of 12 236 reads carried one of the 24 ‘non-existing’ indexing-tag combinations for which we searched during demultiplexing. Most (21 out of 24) of those combinations had below 100 reads, but three had a substantial amount of reads: 1143, 2274 and 6954 (for ‘samples’ S147, S149, S150, respectively). After quality-filtering and mapping those reads to our OTUs at 97% (mapping at 97%), only 567 (4.6%) reads were retained, of which 39 (0.3%) were Glomeromycotina. All non-existing combinations had below nine Glomeromycotina reads, with nine combinations without any Glomeromycotina reads. Altogether this shows that ‘jumping’ reads are low in abundance, and this is due to the low-sequence quality. Principal Coordinates Analysis ordination showed that the non-existing combinations were similar among each other and were closer to old agriculture fields (Fig. S12, Supporting Information).
DISCUSSION
Our data show a rapid recovery of AM fungal species richness after a few years of recultivation following open-cast mining, but also a rapid decline after a few years of conventional agriculture. The trajectory of AM fungal diversity supports the hypothesis that AM fungi succession in a soil recultivation chronosequence is influenced by dispersal limitation at early stages but that environmental filtering imposed by agricultural practices increases with time and strongly influences the AM fungal community structure. Over the course of the chronosequence, AM fungal community structure was highly correlated to N and P stoichiometry.
Dispersal limitation and ecosystem development in early succession
AM fungal species richness increased and community variability decreased (and thus occurrence within fields increased) over the first three years of recultivation following open-cast mining. This pattern indicates the arrival of new species as time increased and the propagation of propagules of already present species, suggesting dispersal limitation in the community assembly. This is consistent with community dynamic at early stages of natural ecosystem development observed in many contrasting environments (Oehl et al.2011; Krüger et al.2015; Martínez-García et al.2015).
Despite a pattern of dispersal limitation, we already detected AM fungi in soils from 2015 although these soils were deposited only 6 months prior to our sampling. The presence of spores of AM fungi in the original substrate is possible. However, dispersal of AM fungi within a year from a source to a new substrate has also been reported (García de León et al.2016). Our results suggest fast arrival of AM fungal species in newly exposed soil substrate. This is particularly likely to happen because soils were analyzed instead of roots. Following disturbance, the growth of roots and fungi will be required to provide sufficient genetic signal for detection.
Environmental filtering may also have contributed to the community structure. Young fields had higher Ca and Mg content. Previous studies showed that AM fungal diversity was lower at higher Ca and Mg content (Herrmann et al.2016). Plant growth also may have led to soil development with changes in soil properties, likely reducing the negative effect of Ca and Mg due to the parent material, allowing more species to persist. The development of N2-fixing plants is likely to have increased the N:P ratio in these non-fertilized young fields of recultivation Phase 1. Plants may have started to exert a stronger selection for AM fungal taxa providing P (Bever et al.2009), given the strong P requirement of N2-fixing plants. Increasing root size, number of available roots and higher carbon allocation belowground may have supported more AM fungal species. The number of reads classified to Glomeromycotina relative to non-target fungi, increased during recultivation Phase 2. Total AM fungal biomass typically increases with greater amounts of available roots (Treseder and Cross 2006).
Field conversion to conventional agriculture and soil P demand
OTU composition changed markedly when fields had just been converted into agricultural land in recultivation Phase 2. Species richness, as well as the number of reads classified to Glomeromycotina relative to non-target fungi, peaked concomitantly with a peak in the soil N:P ratio. Only soils from Phase 2 had N:P ratio higher than 1. Moreover, all communities within fields were highly similar. This suggests that most AM fungal species have been able to disperse in 4 to 5 years and that the change in the environment has acted as a strong ecological filter on AM fungal species occurrence. In P-limiting situations, plants are expected to actively allocate C to AM fungi in exchange for P (Johnson 2010; Verbruggen and Toby Kiers 2010), likely promoting AM fungal diversity. N fertilization in P-poor soils such as in Phase 2 was shown to increase AM fungal richness (Egerton-Warburton, Johnson and Allen 2007).
Interestingly, we observed a high intra-OTU diversity at 97% during this second phase. The ecological relevance of intraspecific diversity in AM fungi is poorly understood (Sanders and Rodriguez 2016). Different isolates of the same species were shown to differ in their effects on plants growth, and the variability between isolates was greater than between species (Munkvold et al.2004). On the one hand, it was shown that increasing the genetic relatedness between AM fungi in a community increased plant growth (Roger et al.2013). On the other hand, increasing the number of AM fungal strains may select for less-mutualistic strains benefiting from plants C while transferring less nutrients to plants (reviewed in Verbruggen and Toby Kiers 2010). Although it is suggested that agriculture imposes evolutionary pressure on AM fungal populations (Verbruggen and Toby Kiers 2010), their evolutionary dynamic is unknown. Assessing the factors that generate and/or promote this fine-scale diversity and its ecological significance deserves further research.
Loss of AM fungal richness from high N:P to low N:P soils
Our data show the progressive loss of AM fungal taxa over years of conventional agriculture to reach the lowest richness in old agricultural fields, supporting the deleterious effect of conventional agriculture on AM fungal species richness (Schenck, Siqueira and Oliveira 1980; Verbruggen et al.2012). The low OTU richness and the high community variability indicate a patchy distribution of a few AM fungal species at a small scale (among replicates) in these fields. Years of typical agricultural management with tillage, biocide application and fertilization may have had a direct adverse effect on fungal growth that may have led to this patchy distribution. However, we cannot differentiate between the effects of tillage and pesticide inputs and the effect of high nutrient input. Plant-available P was at the highest level in old agriculture fields. After years of soil fertilization, crop plants are no longer nutrient-limited and rely less on the AM symbiosis for their P acquisition, decreasing C supply to the symbionts (Johnson 2010; Verbruggen and Toby Kiers 2010). Moreover, in P-rich soils, N fertilization was shown to decrease AM fungal richness (Egerton-Warburton, Johnson and Allen 2007), and AM fungal taxa typically associated with high soil N:P ratio are lost in conventional agricultural fields (Verbruggen et al.2015). These practices in combination likely contribute to the decrease of AM fungal species richness.
AM fungal community succession is correlated to N:P stoichiometry
Our correlative approach was not designed to disentangle and single out soil variables from one another or from soil management. Moreover, sites from our chronosequence were distributed along a spatial transect because the digging machine mostly moves forward in one direction. Therefore, time since recultivation and spatial position were correlated, resulting in a spatial autocorrelation pattern in AM fungal community composition. Nonetheless, we identified soil plant-available P and plant-available N (for instance nitrate) as two important variables correlated with AM fungal community structure over the course of the chronosequence. The correlation between community composition and nitrate and plant-available P was still significant when accounting for the effect of spatial autocorrelation. The two variables were always selected in the best model, altogether suggesting that a site effect is not a likely explanation for the community succession observed. Krüger et al. (2015) observed that P was the main variable correlated to AM fungal community composition and richness over more than 2000 000 years of natural ecosystem development. Similarly, soil-available P was the most important predictor of AM fungal richness in a grassland-farmland latitudinal ecotone (Xiang et al.2014). Our results support that plant-available N:P stoichiometry is a strong predictor of AM fungal community composition and richness, more than just P or N alone. This is consistent with a previous study that showed that AM fungal community composition was correlated to soil N:P ratio in apple orchards at a regional scale (van Geel et al.2015). Nonetheless, spatial vectors were also predictors of community composition.
Host identity as a driver of the AM fungal community succession
The soil restoration strategy and conversion of fields to agriculture investigated here necessarily includes a link between successional stages and vegetation. Although the link between AM fungal community structure and vegetation is not yet fully understood, it is clear that host plant identity affects the AM fungal community structure (Vandenkoornhuyse et al.2002; Torrecillas, Alguacil and Roldán 2012). Phase 1 fields were planted to alfalfa, Phase 2 fields to barley and Phase 3 fields to wheat at the time of sampling. AM fungal succession might be partly explained by such host effects. Moreover, during Phase 1, a diversity of co-occurring ruderals plants has also established among alfalfa plants, potentially contributing to increasing AM fungal species richness. In Phase 3, fields are under a crop rotation regime, with sugar beet rotating with winter wheat. Sugar beet is a plant species not associated with AM fungi; this might also have contributed to the decrease in AM fungal species richness, but this feature is an inherent part of this agricultural system.
Influence of indexing-tag misreading
Misreading of indexing-tags during sequencing, that is, tag jumping, could potentially influence our conclusions due to signal spreading. Here, unambiguously identified reads carrying erroneous index combinations are shown to be of poor sequence quality. Most of them are therefore removed after quality-filtering (<5% of reads retained against >50% retained for reads carrying an indexes-combination included in our library). Almost 5% of our reads might be misassigned to a sample, consistent with recently reported values (Sinha et al.2017). This numbers fell to 0.3% when considering AM fungal reads. This is thus unlikely that misassigned reads have generated the biological signal in species composition and richness we observed, which is further supported by the similarity in sequence composition of unambiguous identified erroneous index combinations; nevertheless, we encourage others to always include this quality check.
Ecological specificity of AM fungi at the family rank level
The turnover of OTUs along the chronosequence revealed an ecological structure of AM fungal communities at the family level. This has been recently reported elsewhere (Rodríguez-Echeverría et al.2017) and is in accordance with life-history traits being conserved at the family level (Hart and Reader 2002; Maherali and Klironomos 2007; Powell et al.2009). For instance, Glomeraceae and Claroideoglomeraceae were more abundant and rich in young recultivated fields; Glomeraceae and Claroideoglomeraceae species have been observed to be first colonizers of newly exposed substrates (García de Léon et al.2016; Nielsen et al.2016). Glomeraceae exhibit traits related to ruderal life-history strategy (Hart and Reader 2002; Chagnon et al.2013), and Claroideoglomeraceae species are indicator species of disturbed habitats (Moora et al.2014). The latter have been also reported from subsoils (below 30 cm deep) (Oehl et al.2005), a substrate included in the recultivation restoration. The identity of the abundant OTUs supports that dispersal limitation influences the community structure at early stages of the chronosequence. By contrast, Diversisporaceae increased in old agricultural fields. Diversisporaceae species have been observed in agricultural soils (Gamper, Walker and Schüßler 2009) and were reported to be indicator species of disturbed habitats at the global scale (Moora et al.2014).
The other families detected (Ambisporaceae, Archaeosporaceae, Gigasporaceae and Paraglomeraceae) were very low in abundance, which is commonly reported in Europe (Jansa et al.2014; Bouffaud et al.2016) without clear phase preferences. All these families tended to increase in abundance after the first three years, suggesting that time to disperse may have influenced their distribution along the chronosequence. However, one OTU assigned to Paraglomus occultum was a strong indicator of old agricultural fields. This species has been reported to be abundant in agricultural fields (Hijri et al.2006; Lee and Eom 2009).
Interestingly, OTUs from diverse families were observed in old agriculture fields. This result supports the finding that taxa that perform well in agriculture are distributed throughout the Glomeromycotina (Xiang et al.2014) and contradicts the predicted dominance of Glomeraceae (Jansa et al.2002; Verbruggen and Toby Kiers 2010; Chagnon et al.2013). All this highlights that we need renewed efforts geared toward traits characterization and taxonomy (e.g. Hart and Reader 2002) to better interpret taxa distributions and roles in the environment.
Conclusion
We here report clear patterns of soil AM fungal community succession along a recultivation chronosequence following open-cast lignite mining, revealing AM fungal communities in agricultural systems to be highly dynamic. We show a rapid re-establishment of a species-rich AM fungal community during restoration of soils left deposited 6 months to 3 years ago during the recovery phase with alfalfa. However, we also observed a strong species richness loss a few years after soils were converted to conventional agriculture, species richness in old agricultural fields being even lower than in the early succession. This clearly shows the deleterious effects of conventional agriculture on AM fungal richness developing over time. This diversity loss occurred after the establishment of a rich community, and is accompanied by major shift in AM fungal taxa. Nonetheless, the large and highly dynamic shifts in species composition and richness of AM fungal communities are encouraging in that AM fungi may respond quickly and strongly to management interventions at the farm level. Over the course of the recultivation chronosequence, the AM fungal community structure was strongly correlated to soil plant-available N and plant-available P content. Species richness peaked when N:P ratio peaked and was at a value higher than 1. Our results suggest that carefully managing N:P stoichiometry may help preserve AMF diversity in agroecosystems, with the potential to preserve other, non-nutritional functions.
SUPPLEMENTARY DATA
Supplementary data are available at FEMSEC online.
Acknowledgements
We thank Ms. Bardenheur, Mr. Esser, Mr. Mürkens, Mr. Behren and Mr. Tack in providing access to their fields, and Mr. Endenich (RWE Power AG, Germany) in providing access to mining sites. We thank Kathleen Lemanski and Christoph Schmid for help with soil sampling. We thank Susan Mbedi and Kirsten Richter at the BeGenDiv for help in preparing the sequencing library. We thank Masahiro Ryo for help with statistics and useful comments on an earlier version of this manuscript We thank reviewers for comments that improved the manuscript.
FUNDING
This work was supported by the Federal Ministry of Education and Research (BMBF) initiative ‘BonaRes—Soil as a sustainable resource for the bioeconomy’ through the project INPLAMINT.
AUTHOR CONTRIBUTIONS
JR, RR, NB, SH and MCR designed the study. RR prospected the study area, negotiated with RWE Power AG (Germany) and farmers, pre-selected sampling sites, performed GIS mapping and provided the soil physicochemical data and documentation. JR and RR participated in soil sampling. JR performed DNA laboratory analyses, analyzed the data and wrote the manuscript that was revised by all authors.
Conflict of interest. None declared.
