


Summary
Orthodontic miniscrews are an increasingly popular choice to achieve absolute anchorage. The temporary use of miniscrews and their recent introduction have limited the debate over the biological aspect of the materials to that of the surface that permeates the field of dental implants. The aim of the present study was to investigate the integration of grade 5 titanium mini-implants with machined or sand blasted acid etched surface (SAE) under mechanical load in a rabbit tibia model of implant integration.
A total of 64 miniscrews (Ti6Al4V) of 1.5 mm diameter and 6.5 mm length were inserted in the proximal medial surface of each tibia in eight male rabbits aged 6 months. Each tibia received four miniscrews. A 100 g nickel-titanium coil spring (Neosentalloy) was applied between two miniscrews along the main axis while two miniscrews were left unloaded. The removal torque was measured for loaded and unloaded miniscrews after 12 weeks. Two miniscrews were harvested for histology.
Removal torque was significantly higher for SAE mini-implants than for machined screws, under both loading conditions. Although no difference in bone to implant contact was observed among the groups, cortical area significantly decreased with both surfaces under loading.
Our data indicate that SAE miniscrews have higher bone retention than MA miniscrews, although the effects of mechanical loading of these devices on cortical bone require further investigations.
Introduction
Orthodontic miniscrews have become a popular choice to provide absolute temporary anchorage during treatment (1–4). In spite of their high success rate, numerous reports agree that their clinical outcome depends on many factors, for example host characteristics, bone quality, the design and features of the implanted devices, and their insertion and loading modality, all of which have hitherto been only partially investigated (5, 6). Although dental implants mostly rely on commercially pure, grade 4 titanium (cpTi), the clinical use of mini-implants may benefit from different physical characteristics. Stronger, grade 5 titanium alloys, which are commonly used for orthopedic prosthesis, have been proposed for miniscrews (6, 7), thus enabling smaller, self-drilling mini-implants to minimize surgery during insertion and to be more easily acceptable by patients. The provisional nature of miniscrews and their recent introduction has spared the field most of the debate on the biological effects of surfaces and on the pro and cons of rough topographies, which has been permeating the field of dental implants for several years. Nevertheless, as surface treatment has long been proved to affect cell proliferation and differentiation (8–15), and, ultimately, tissue integration (16–25) of dental implants, investigating the optimal surface characteristic for miniscrews appears as a useful approach to improve their clinical success. It should however be remembered that, though the purpose of a dental implant is to achieve the highest degree of osseointegration to support a dental prosthesis as long as possible, the optimal extent of integration for a temporary endosseous device such as miniscrews is to quickly and firmly get stabilized into the bone, to allow for immediate loading, but should also be easily and atraumatically removed, when they are no longer used. Smaller miniscrews are obviously desirable, to permit insertion in narrow interproximal sites and thus reduce the impact on the surrounding tissues. Several surface treatments have been proposed to improve the expression of differentiation markers and promote the integration of dental implants in bone (26–29), such as sand-blasting and acid-etching, which rely on the use of grit agents and acids to increase surface roughness, but whether their use in miniscrews has favourable effects is being suggested by experimental studies reporting higher removal torque and stability for micro-rough miniscrews (7, 30, 31). The aim of the present study was to investigate the integration of grade 5 titanium miniscrews with machined or sand-blasted/acid-etched surface under mechanical load in a rabbit tibia model of implant integration. Both removal torque and histology were evaluated, to gain a deeper understanding of the behaviour of miniscrews when inserted in bone and immediately loaded.
Materials and methods
Animals and housing
Eight male, 6-month-old New Zealand white rabbits (Charles River, Wilmington, Massachusetts, USA) weighing 3.9–4.6 kg (mean weight 4.2 kg) were used for the present study. Animals were kept in unisexual groups of one individual, maintained until the start of the experiments in a temperature-controlled room at 22–24°C, with lights on between 7.00 AM and 7.00 PM. Cage bedding consisted of wood shavings, and food and water were provided ad libitum. The investigation was approved by the Veterinary Animal Care and Use Committee of the University of Parma and conformed with the National Ethical Guidelines and the Guide for the Care and Use of Laboratory Animals (NIH publication no. 85–23, revised 1996).
Miniscrews
All the orthodontic miniscrews, made of Ti6Al4V titanium alloy (Spider Screw®, HDC Company, Sarcedo, Italy), had 1.5 mm diameter and 6.5 mm length, and were composed of an upper head part and a lower threaded portion. The trans-mucosal part, designed to fit in the soft tissues, had a short collar combined with a flat head. The head of the screw was designed with one internal and two external rectangular slots 0.022 inch × 0.025 inch in size. It also had two 0.027 inch round internal vertical slots (Figure 1).
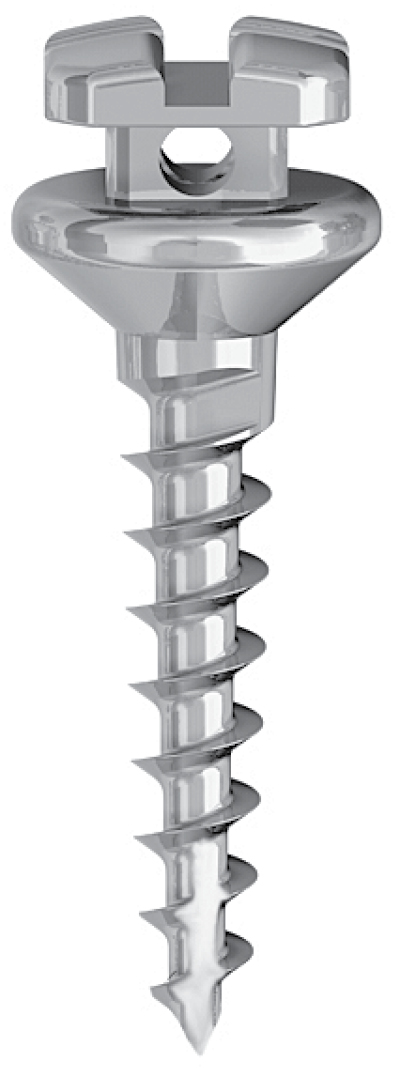
3D rendering of Spider screw® miniscrews used in the present manuscript (Courtesy of HDC Company, Sarcedo, Italy).
Two different surface treatments were tested: a machined (MA) group with no surface treatment after milling and a sandblasted and acid etched group (SAE) (32). Four miniscrews were placed into each hind limb of each rabbit, in the proximal medial surface of each tibia. A pilot study was carried out to optimize the tibia model for the purpose of the present study.
Surgical procedures
All surgeries were performed under sterile conditions. The animals were premedicated with xylazine (Rompun, Bayer, Leverkusen, Germany) 0.5 mg/kg of body weight and anesthetized with ketamine (Imalgene; Merial Italia, Milano, Italy) 20 mg/kg, both with intramuscular injections. Before surgery, 1.8 ml of lidocaine was injected locally into the tibia metaphases.
Both legs of each rabbit were shaved, washed, and decontaminated with povidone-iodine 10%. After an incision of about 2 cm, the flat surface as well as the anteromedial aspect of the tibia were exposed and selected for mini-implant placement. Four miniscrews were placed into each tibia: after clinical evaluation, two holes were drilled 18–20 mm apart in the central portion of each tibia along its main axis. Two more holes were then drilled at both sides of these two initial holes. Cortical bone was drilled with a 1.1 mm guide drill under saline irrigation, and the screw was inserted using a surgical engine.
Each tibia was randomly allocated to receive miniscrews with the same surface treatment, so that each animal received miniscrews with one surface on one limb and with the other on the controlateral limb.
After the miniscrews were placed and were confirmed to be stable, a nickel-titanium coil spring (Neosentalloy) was applied to the coronal portion of the two miniscrews along the main axis, with 100 g of transverse force between the proximal and distal mini-implants (Figure 2A–C). The mucoperiosteum and muscles were then sutured in separate layers using absorbable sutures and surgical wounds were disinfected. The animals received i.m. injections of antibiotics (Baytril, Bayer) after surgery, and wounds were daily disinfected with Betadine 10% for 21 days.
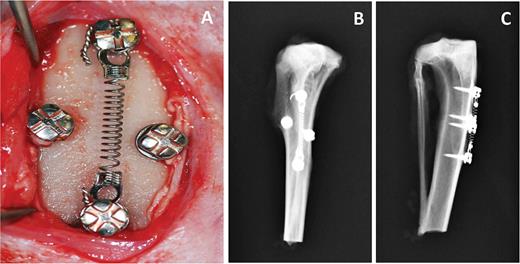
(A) Intraoperatory photograph of miniscrews in place. Four miniscrews were placed into each tibia: two miniscrews were placed 18–20 mm apart in the central portion of each tibia along its main axis. A nickel-titanium coil spring was applied to the coronal portion of these two miniscrews along the main axis, with 100 g of transverse force between the proximal and distal mini-implants. A third and fourth miniscrew were then placed at both sides of the coil and were left unloaded. (B, C) X-rays taken after animal sacrifice and showing miniscrews location and position.
Radiological evaluation
Removed tibia bones were X-rayed (Tur D 800–4, Dresden, Germany) to assess radiological positioning of the miniscrews. The samples were X-rayed before preparing them for histological evaluation.
Removal torque test
The rabbits were sacrificed 12 weeks after mini-implants placement using an overdose of anaesthetics.
The mini-implant sites were exposed, and any bone and soft tissues that had formed on top of the implants were carefully removed. The measurement of the RTV was done using a digital torque sensor with 0.01 Ncm accuracy (Implanted SI923 W&H Dentalwerk Burmoos GmbH, Austria). The torque driver tip was fitted to the screw part, and torque was applied in the counterclockwise direction with minimum pressure. The result was recorded by measuring the peak removal torque value (RTV) at which fracture occurred between the miniscrews and neighbouring bone. Two screws from each tibia were removed; one loaded and one unloaded. The other two were used for histology.
Scanning electron microscopy
The miniscrews processed for the removal torque test were subsequently fixed with 2.5% glutaraldehyde in 0.1 M sodium cacodylate buffer (pH 7.3). They were then dehydrated through a series of alcohols and then critical-point-dried with liquid CO2 (CPD 030 Baltec, Pfäffikon, Switzerland). Specimens were then sputter-coated with a gold–palladium layer using a SCD 040 coating device (Balzer Union, Balzers, Liechtenstein). Samples were observed using a Jeol JSM 6400 scanning electron microscope (Jeol, Tokyo, Japan), equipped with energy dispersive X-ray analyzer (EDS system), at an accelerating voltage of 10 kV.
Histology
The miniscrews and the surrounding bone were excised and the samples were fixed in paraformaldehyde 4% for 24 hours. They were then dehydrated in graded alcohol solutions, xylene clarified, and polymethylmethacrylate resin embedded (Osteo-Bed, Polysciences, Inc., Warrington, Pennsylvania, USA). Non-decalcified longitudinal section of the implants, perpendicular to the bone longitudinal axis (50 µm thick), were obtained using a Leiz 1600 microtome (Leica, Jena, Germany). Sections were observed under polarized light and stained with Goldner’s thricrome. For histomorphometry a motorized microscope (Nikon Eclipse 90i, Tokyo, Japan), equipped with a digital camera (Nikon model 5M) connected to a PC with image analysis software (NIS–Elements AR 3.1; Nikon) were used. The following histomorphometric parameters (33) were measured:
Bone to implant contact (BIC) was measured at the interface between bone and implant as the rate between the stem surface directly in contact with bone without the interposition of fibrous tissue/the total interface length × 100 (%).
Bone volume was measured as the amount of bone within the regions of interest (ROI).
Thickness of endosteal bone new deposition (TE) was calculated as the length of the normal to a tangent line to the endocortical surface (Figure 5A, indicated as h).
Our chosen ROI was the first thread and the area of newly formed bone on the first thread on each side of the implant (located in the cortical bone) because of the anatomy of the receptor (wide medullar space), respectively for BIC and bone volume. The threads towards the medullar space were the ROI for TV measurements.
Von Kossa staining
Von Kossa staining was performed to assess the degree of mineralization of bone around implants (34). Briefly, sections were immersed in 3.5 per cent silver nitrate, rinsed, immersed in 0.5 per cent hydroquinone and 5 per cent sodium thiosulphate samples were mounted and observed at Optical Microscope.
Statistical analysis
Sample size was determined using an a priori evaluation (A-Priori Power Analysis, G*Power Version 3.1.2; Franz Faul, University of Kiel, Germany), considering a generic inter-individual variability, a = 0.05, b error = 0.05, and basing our assumptions on the available literature. Comparison of RT data between groups was performed using the software Prism 6.0 (GraphPad Software, La Jolla, California, USA). Data normality was first assessed by Kolmogorov–Smirnov test (35). RT data were analyzed using two-way factor analysis of variance (ANOVA) and Bonferroni post-test, to evaluate the differences in relation to surface treatment and loading. Student’s t-test was performed to evaluate the effects of surface treatments and loading differences. All values were reported as mean ± standard deviation and were considered significant when P < 0.05.
Results
Wound healing was uneventful, no infection was observed and no animal died during recovery. A total of 64 miniscrews were inserted in tibia and 2 miniscrew failed, as assessed at sacrifice. One failed miniscrew had machined surface (MA) and one had rough surface, and both of them were under loading.
Scanning electron microscopy
SEM analysis of the miniscrews used for the removal torque test showed a visible amount of bone tissue adhering to the SAE surface, while only small traces were observed on the MA (Figure 3A and 3B). Further analysis of the tissue remnants with EDS probe detected the presence of extracellular matrix with crystals of calcium salts (Figure 3C and 3D).
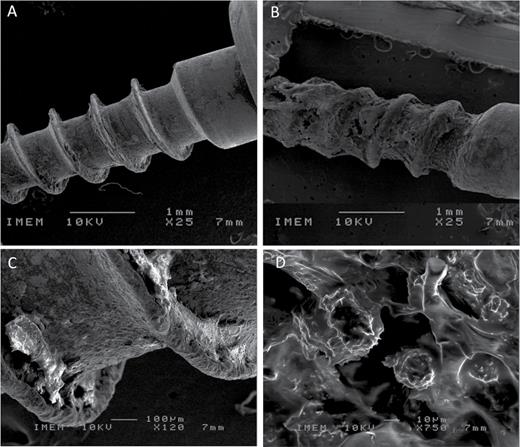
SEM microphotographs of Machined (A, C) and Sand-blasted acid etched (B, D) miniscrews retrieved for removal torque testing.
Removal torque
Thirty-two miniscrews were allocated for removal torque measurement. Measurements are listed in Table 1. RTV was significantly higher for SAE miniscrews than for MA miniscrews (Figure 4A and 4B). Loading did not significantly affect RTV for any surface or treatment tested, although unloaded SAE miniscrews tended to have higher maximal RTV than loaded miniscrews with the same surface (Figure 4B). See Tables 1 and 2 for detailed data analysis.
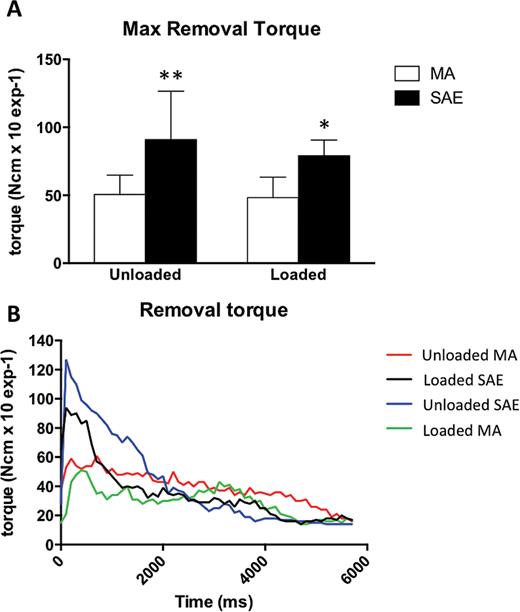
(A) Histogram of maximal removal torque of machined (MA) or sand-blasted acid etched (SAE) miniscrews in the absence or in the presence of mechanical loading. *P = 0.0072 versus loaded MA, **P = 0.00073 versus unloaded MA. (B) Removal torque values curves for MA and SAE miniscrews. RTV was reported as the mean of the highest removal torque values recorded during the removal of each miniscrew.
Maximal removal torque values by animal.
| Animal | Position (R/L) | Surface | Loading (Y/N) | Max RTV (Ncm) | Mean | SD |
|---|---|---|---|---|---|---|
| 1 | L | Machined | N | 61 | ||
| 3 | R | Machined | N | 44 | ||
| 4 | L | Machined | N | 51 | ||
| 5 | L | Machined | N | 51 | ||
| 6 | R | Machined | N | 80 | ||
| 7 | L | Machined | N | 38 | ||
| 8 | R | Machined | N | 36 | ||
| 9 | R | Machined | N | 43 | 50.50 | 14.37 |
| 3 | L | SAE | N | 94 | ||
| 4 | R | SAE | N | 58 | ||
| 5 | R | SAE | N | 150 | ||
| 6 | L | SAE | N | 127 | ||
| 7 | R | SAE | N | 46 | ||
| 8 | L | SAE | N | 93 | ||
| 9 | L | SAE | N | 60 | ||
| 4 | R | SAE | N | 99 | 90.88 | 35.71 |
| 1 | L | Machined | Y | 66 | ||
| 3 | R | Machined | Y | 45 | ||
| 4 | L | Machined | Y | 49 | ||
| 5 | L | Machined | Y | 27 | ||
| 6 | R | Machined | Y | 51 | ||
| 7 | L | Machined | Y | 29 | ||
| 8 | R | Machined | Y | 69 | ||
| 9 | R | Machined | Y | 50 | 48.25 | 15,07 |
| 1 | R | SAE | Y | 94 | ||
| 3 | L | SAE | Y | 84 | ||
| 4 | R | SAE | Y | 79 | ||
| 5 | R | SAE | Y | 70 | ||
| 6 | L | SAE | Y | 72 | ||
| 7 | R | SAE | Y | 82 | ||
| 8 | L | SAE | Y | 92 | ||
| 9 | L | SAE | Y | 60 | 79.13 | 11.46 |
Mean and standard deviation (SD) for each subgroup is also indicated.
(A) Descriptive statistics and (B) ANOVA analysis of RT values.
| (A) Descriptive statistics | |||||||
|---|---|---|---|---|---|---|---|
| Factor | Group | Sample size | Mean | Variance | Standard deviation | ||
| Surface | MA | 16 | 49.375 | 203.71667 | 14.27293 | ||
| Surface | SAE | 16 | 85 | 693.33333 | 26.33122 | ||
| Loading | N | 16 | 70.6875 | 1126.3625 | 33.56132 | ||
| Loading | Y | 16 | 63.6875 | 421.42917 | 20.52874 | ||
| Surface × loading | MA × N | 8 | 50.5 | 206.57143 | 14.37259 | ||
| Surface × loading | MA × Y | 8 | 48.25 | 227.07143 | 15.06889 | ||
| Surface × loading | SAE × N | 8 | 90.875 | 1275.55357 | 35.71489 | ||
| Surface × loading | SAE × Y | 8 | 79.125 | 131.26786 | 11.45722 | ||
| (B) ANOVA | |||||||
| Source of variation | SS | df | MS | F | P level | F crit | Omega sqr. |
| Factor #1 (surface) | 10153.125 | 1 | 10153.125 | 22.06644 | 0.00006 | 4.19597 | 0.40272 |
| Factor #2 (loading) | 392 | 1 | 392 | 0.85196 | 0.36388 | 4.19597 | 0 |
| Factor #1 + #2 (surface × loading) | 180.5 | 1 | 180.5 | 0.39229 | 0.53617 | 4.19597 | 0 |
| Within groups | 12883.25 | 28 | 460.11607 | ||||
| Total | 23608.875 | 31 | 761.57661 | ||||
| Omega squared for combined effect | 0.38827 | ||||||
Histology
Twelve weeks after surgery, miniscrews with both surface treatments and both loading conditions appeared osseointegrated at microscopic analysis. In the unloaded condition, the histology showed that miniscrews with both SAE and MA surfaces were well integrated in cortical bone (Figure 5A and 5C), which presented mature bone with parallel fibres. In the loaded condition woven bone with irregular fibres orientation was visible around both MA and SAE surfaces, as indicated by polarized light observation (Figure 6A and 6B). Interestingly, it was also possible to observe striking modifications of the peri-implant cortical bone around loaded miniscrews with aspects of high remodelling and cortical bone loss as suggested by ample lacunar spaces in cortical bone (Figure 5B and 5D). BIC (Figure 7A) was not significantly affected by either implant surface or loading, although bone morphology in direct contact to the implant resulted different. Cortical area (Figure 7B) decreased around SAE miniscrews (P = 0.0033) in the presence of loading. See Tables 3 and 4 for details of data analysis. High endosteal bone formation adjacent to cortical bone was present in all conditions (Figure 5) with thin trabecular patterns with big and round osteocytes. No difference in the mineralization degree was observed for treated and untreated samples regardless of mechanical loading (data not shown).
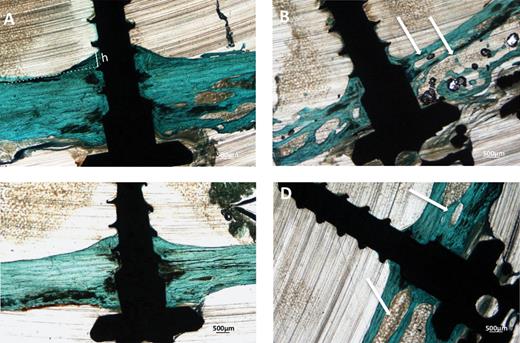
Histological microphotographs of MA (A, B) and SAE (C, D) miniscrews in the absence (A, C) or after mechanical loading (B, D). Samples were stained by Masson’s trichrome. Magnification = ×2. Endosteal bone formation is indicated as h. A dramatic increase in cortical porosity can be observed around loaded miniscrews (white arrows).
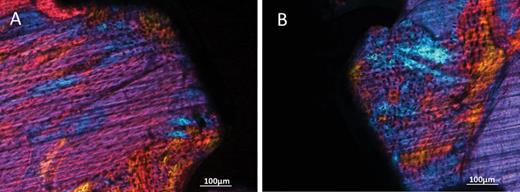
Polarised light microphotographs of peri-implant bone of MA (A) and SAE (B) miniscrews. Magnification = ×2.
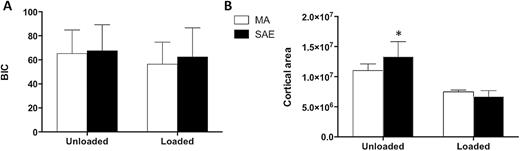
Histomorphometry of MA or SAE miniscrews under different loading conditions: (A) Bone to implant contact (BIC) expressed as percentage of the total amount of implant surface in contact with bone tissue. (B) Cortical area as cortical surface in pixels *P = 0.0033 versus loaded SAE.
(A) Descriptive statistics and (B) ANOVA analysis of BIC values.
| (A) Descriptive statistics | |||||||
|---|---|---|---|---|---|---|---|
| Factor | Group | Sample size | Mean | Variance | Standard deviation | ||
| Surface | MA | 16 | 60.825 | 357.52467 | 18.90832 | ||
| Surface | SAE | 16 | 64.95625 | 501.37463 | 22.39140 | ||
| Loading | N | 16 | 66.43125 | 399.00629 | 19.97514 | ||
| Loading | Y | 16 | 59.35000 | 442.25200 | 21.02979 | ||
| Surface × loading | MA × N | 8 | 65.3125 | 382.62696 | 19.56085 | ||
| Surface × loading | MA × Y | 8 | 56.3375 | 337.46839 | 18.37031 | ||
| Surface × loading | SAE × N | 8 | 67.55 | 469.52571 | 21.66854 | ||
| Surface × loading | SAE × Y | 8 | 62.36250 | 589.47125 | 24.27903 | ||
| (B) ANOVA | |||||||
| Source of variation | SS | df | MS | F | P level | F crit | Omega sqr. |
| Factor #1 (surface) | 136.53781 | 1 | 136.53781 | 0.30698 | 0.58394 | 4.19597 | 0 |
| Factor #2 (loading) | 401.15281 | 1 | 401.15281 | 0.90193 | 0.35039 | 4.19597 | 0 |
| Factor #1 + #2 (surface × loading) | 28.69031 | 1 | 28.69031 | 0.06451 | 0.80137 | 4.19597 | 0 |
| Within groups | 12453.64625 | 28 | 444.77308 | ||||
| Total | 13020.02719 | 31 | 420.00088 | ||||
| Omega squared for combined effect | 0 | ||||||
(A) Descriptive statistics and (B) ANOVA analysis of cortical area.
| (A) Descriptive statistics | |||||||
|---|---|---|---|---|---|---|---|
| Factor | Group | Sample size | Mean | Variance | Standard deviation | ||
| Surface | Machined | 16 | 9256404.0625 | 8.1282E+12 | 2850994.56869 | ||
| Surface | SAE | 16 | 9986774.6875 | 3.927E+13 | 6266467.74663 | ||
| Loading | N | 16 | 12167556.3125 | 2.950E+13 | 5431118.26008 | ||
| Loading | Y | 16 | 7075622.4375 | 4.3561E+12 | 2087124.70045 | ||
| Surface × loading | Machined × N | 8 | 11029540.375 | 9.540E+12 | 3088721.20531 | ||
| Surface × loading | Machined × Y | 8 | 7483267.75 | 6.90995E+11 | 831260.79355 | ||
| Surface × loading | SAE × N | 8 | 13305572.25 | 5.071E+13 | 7120924.98157 | ||
| Surface × loading | SAE × Y | 8 | 6667977.125 | 8.2637E+12 | 2874657.39493 | ||
| (B) ANOVA | |||||||
| Source of variation | SS | df | MS | F | P level | F crit | Omega sqr. |
| Factor #1 (surface) | 4.3E+12 | 1 | 4.3E+12 | 0.24667 | 0.62331 | 4.19597 | 0 |
| Factor #2 (loading) | 2.1E+14 | 1 | 2.1E+14 | 11.98931 | 0.00174 | 4.19597 | 0.25954 |
| Factor #1 + #2 (surface × loading) | 1.91E+13 | 1 | 1.91E+13 | 1.10473 | 0.30222 | 4.19597 | 0.00247 |
| Within groups | 4.8E+14 | 28 | 1.730E+13 | ||||
| Total | 7.15E+14 | 31 | 2.307E+13 | ||||
| Omega squared for combined effect | 0.24423 | ||||||
Discussion
A critical requirement for the success of orthodontic treatments is to achieve optimal anchorage, to better control the intensity and direction of the mechanical forces used during therapy (36). The use of temporary miniscrews inserted in the alveolar bone has become an increasingly common choice, because of their versatility (37, 38). These small implants can be easily applied in different sites, with minimal surgical procedure, thus reducing patient morbidity, bypassing the issue of patient compliance and therefore improving their clinical management (39, 40).
Ideally, temporary anchorage devices should be retained during the whole active period of treatment and withstand the applied orthodontic forces without loosening or breaking during insertion, removal or at any time of the treatment, should be easily removed with minimal tissue trauma, should be small, to be positioned between tooth roots, and should be biocompatible, to enhance patient’s compliance (38).
It is well documented in the literature that surface treatment affects the integration of endosseous implants in bone (18, 19, 22–24, 41) and that the micro topography of implanted devices modulates the growth and maturation of osteoblasts (11, 42–46), the cells that deposit new bone matrix. Although numerous studies have solidly proven that, in spite of the ongoing debate on peri-implant infections, dental implants with rough surface outperform fixtures with smooth surface in achieving at least a better early osteointegration (47), still limited data is available on the optimal surface of miniscrews (7, 30, 31, 48–51).
The present study compared the integration of grade 5 (Ti6Al4V) titanium miniscrews with either machined (MA) or sand-blaste/acid-etched (SAE) surface topography. Grade 5 titanium allows for smaller miniscrews but due to their higher elastic modulus, the effect of load on bone must be thoroughly investigated. Miniscrews were inserted in each proximal tibia of adult male rabbits. Each tibia received five miniscrews with equal surface treatment. Two randomly chosen miniscrews were mechanically loaded with an orthodontic spring that exerted a 1 N force, equal to about 100 g. The removal torque (RT) test after 12 weeks revealed that a higher force was required to remove SAE miniscrews than smoother MA miniscrews, consistently with previous literature in tibia (48). Interestingly, a recent report suggested that machined or SLA surface may not affect the removal torque of miniscrews in a femoral distal condyle model in rabbit (52). It should be noted that tibia has a more prevalent cortical component than distal femur, and this may be reflected by the higher per cent BIC observed by Sirisa-Ard et al. (52). This highlights how different bone architectures and compartments may respond differently to surface characteristics of mini implants and suggests caution when comparing reports from the literature. Further considerations should be however taken into account, such as differences in surface treatment and mechanical properties of the tested miniscrews. Orthodontic forces did not affect RTV of the tested miniscrews, regardless of their surface treatment, implying that immediate loading did not impair their stability. This is consistent with the literature, as immediate prosthetic loading of implants has been shown to yield similar histological outcomes as delayed loading (53). Interestingly, however, mechanical load dramatically affected bone quality around miniscrews, as revealed by histology. Although BIC quantitation did not show significant differences among the tested groups in the amount of bone formed along the whole body of the screw, morphologic analysis evidenced a marked increase in cortical porosity, as evidenced by cortical volume, and alterations in cortical morphology, as a higher amount of woven bone around loaded miniscrews, regardless of their surface (Figure 5). Our study suggests that cortical alterations depend on the intensity of the applied force, because no porosity was observed around the miniscrew tip even when the tip of the loaded miniscrews engaged the opposite cortical plate (Figure 8). Furthermore, lacuna spaces were not necessarily observed in contact with the screw surface (Figure 5), indicating that their cause was not likely to be a direct chemical pro-inflammatory effect of the implanted devices. Moreover, loaded cortexes often appeared thicker, albeit more porous, and closely resembled the structure of trabecular bone, suggesting that their morphology was not simply due to increased osteoclast activity, but rather to a complex increase of the coupled deposition–resorption processes, that is increased remodelling. Polarized light confirmed the presence of newly formed bone around the implants, regardless of their surface treatment. Although the increase in cortical porosity did not affect miniscrew stability, as indicated by RT analysis, it may raise some concerns about the effects that miniscrews can have when placed in sensitive areas of alveolar bone for the treatment, or in close proximity to teeth. It should however remembered that tibia presents with a thick cortical compartment but scarce cancellous bone, which might explain the dramatic cortical effects observed in our study, as mechanical forces were not shared with trabecular bone. It is also possible that when miniscrews are inserted in bone areas with a more abundant cancellous compartment, such as the alveolar processes, forces are more evenly distributed and the effects on cortical bone are hampered (54). The existing literature does not provide definitive evidence on this issue (54, 55), and further studies should address the question of whether insertion site affects load-induce bone remodelling.
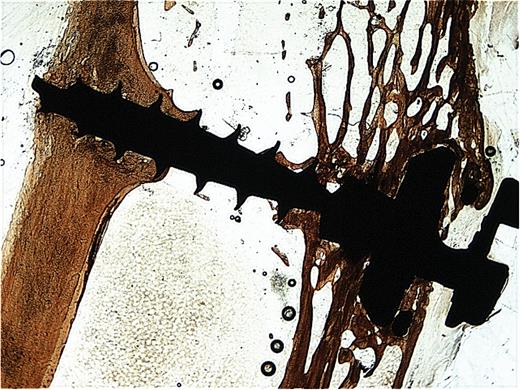
Microphotograph of loaded machined mini-implant at Von Kossa staining. A high degree of porosity was observed in cortical bone around the mini-implant neck but not around the tip.
Taken together, our data indicate that grade 5 titanium miniscrews with SAE surface have higher bone retention than MA screws, both under basal conditions and after 3 months, possibly due to more efficient interlocking with the surrounding tissue, as rough surface did not appear to directly promote higher bone formation around the devices in this setting. These conclusions support the use of grade 5 titanium miniscrews in clinical situations where an improved stability and retention is critical. Further studies however should focus on better defining the effects of mechanical load on grade 5 titanium screws on the surrounding bone.
Conflict of interest
The authors have no conflicts of interest to disclose.
Acknowledgements
The authors would like to thank Marco Benvegnu (HDC, Sarcedo, Italy) for kindly providing the miniscrews used in the present study, and Dr Barocelli, from the Department of Pharmacology.
References

