


Abstract
To examine differences and similarities in bicuspid aortic valve (BAV) and tricuspid aortic valve (TAV) stenosis occurring during the same age and whether any differences impact outcomes following aortic valve replacement (AVR).
An age-matched cohort of 198 BAV stenosis and 198 TAV stenosis patients was identified from 888 consecutive patients undergoing AVR for severe AS. Mean age 68 ± 6 years; 68% male. Patients with BAV were less likely to have multiple comorbidities, as measured by the Charlson Comorbidity Index (CCI) >2 (3 vs. 10%, P = 0.007). Indexed aortic valve area (0.44 ± 0.09 vs. 0.42 ± 0.08 cm2/m2, P = 0.17) and left ventricular ejection fraction (LVEF) were similar (62 ± 11 vs. 61 ± 12%, P = 0.12), but E/e’ ≥15 (46 vs. 66%, P = 0.0002) was less common in BAV stenosis. A tissue aortic valve prosthesis was more commonly utilized in both groups (81 vs. 78%, P = 0.54). Overall indexed effective orifice area was larger in BAV compared with TAV (1.08 ± 0.33 vs. 0.96 ± 0.25 cm2/m2, P = 0.0008). Five-year survival following AVR was lower in TAV compared with BAV stenosis (61 vs. 79%, P = 0.02). Independent predictors of survival following AVR were LVEF < 50% [hazard ratio (HR): 4.8, P = 0.0005], CCI > 2 (HR: 3.1, P = 0.015), effective orifice area index ≤0.85 cm2/m2 (HR: 2.5, P = 0.004), and bioprosthesis (HR: 3.7, P = 0.02).
In an age-matched cohort, TAV compared with BAV stenosis is associated with greater prevalence of cardiovascular risk factors and cardiac impairment and worse survival after AVR.
Introduction
Bicuspid aortic valve (BAV) is the most common congenital heart lesion, affecting 1–2% of the general population.1 Calcific aortic valve stenosis (AS) is the most common fate of a BAV2–4 due to underlying abnormal valve geometry and leaflet matrix5–8 that predisposes the cusps to high mechanical and functional stress. Atherosclerotic risk factors of hypertension and dyslipidaemia have also been linked to the development of AS in those with a BAV.9 AS in those with a tricuspid aortic valve (TAV) typically occurs later in life compared with BAV.10 Although a genetic predisposition to developing TAV stenosis has been described,11 a combination of mechanical stress due to minor variation in cusp size12 as well as atherosclerotic risk factors such as advanced age, diabetes, hypertension, dyslipidaemia, and smoking13 play a role in the initiation of valve stenosis in TAV. The progression of AS in both TAV and BAV, however, shares a common disease process of inflammation, calcium deposition, and ossification.14 In both instances, relief of severe stenosis with aortic valve replacement (AVR) is associated with improved outcomes compared with medical therapy.15,16
Studies comparing the clinical profiles in age-matched cohorts with BAV vs. TAV stenosis are scarce.17 Potential differences between BAV and TAV stenosis, beyond age of development, such as burden of associated cardiovascular risk factors, associated aortopathies,18–21 or differences in size of the aortic annulus,22 may influence clinical outcomes following surgery and inform patient management. The purpose of this study is to (i) describe differences and similarities in clinical and echocardiographic characteristics of age-matched BAV and TAV patients undergoing AVR for pure AS and (ii) compare clinical outcomes and examine determinants of survival following AVR.
Methods
The study was approved by the Mayo Clinic Institutional Review Board. A cohort of 198 subjects with BAV was retrospectively identified from a database of consecutive patients that underwent AVR for severe AS between 1 January 2010 and 31 December 2012. The BAV group was then matched by age to TAV patients from the same database. Valve morphology and aetiology of stenosis were determined by gross inspection of the excised valve by experienced cardiac pathologists (J.J.M. and W.D.E.).23 We excluded patients with coexistent moderate or more aortic regurgitation, a history of aortic valve endocarditis, as well as patients who were determined to have post-inflammatory AS (post-radiation or rheumatic) based on gross pathology.23
All patients had a comprehensive transthoracic echocardiogram within 1 year prior to surgical date (99.8% within 6 months). The echocardiograms were performed at Mayo Clinic, Rochester, MN, USA in accordance with American Society of Echocardiography (ASE) and European Association of Echocardiography (EAE) guidelines for the evaluation of cardiac chamber size and function and native valve stenosis severity.24–26 Severe AS was defined as aortic valve area ≤1.0 cm2 or aortic valve systolic mean Doppler gradient ≥40 mmHg.16,27 Left ventricular mass index and relative wall thickness were calculated according to ASE/EAE guidelines.24 Systemic arterial compliance and valvulo-arterial impedance (an estimate of global left ventricular afterload) were calculated from the blood pressure, mean systolic Doppler gradient across the aortic valve, and stroke volume index at the time of preoperative transthoracic echocardiogram.28 Significant coronary artery disease was considered present when there was luminal diameter narrowing of ≥50% involving the left main or ≥70% involving the left anterior descending, intermediate, left circumflex, or right coronary arteries at the time of preoperative coronary angiogram. Diagnoses for the Charlson Comorbidity Index (CCI), as described by Quan et al.,29 were pulled from clinical charts, and the severity weighted sum of diseases was used in our analyses.30 Prosthesis effective orifice area index data were retrieved from the pre-dismissal transthoracic echocardiogram.
All-cause mortality data were acquired from review of the clinical record and vital status obtained from queries of the Rochester Epidemiology Project Database31 and the National Death Index.
Statistical analysis was performed with JMP 9.0.1 (SAS; Cary, NC, USA). A P-value <0.05 was considered significant. Data are displayed as mean ± standard deviation or standard error, where appropriate. Continuous variables were tested for normality using the Shapiro–Wilk test. The majority of continuous variables were not normally distributed and thus were compared using the Wilcoxon rank sum test. Nominal variables were compared using contingency tables and χ2 analysis. Survival was computed using the Kaplan–Meier method and was compared between groups using the two-sample logrank test. Within each group, expected survival was computed based Minnesota death rates by age and gender and compared with expected using the one-sample logrank test. Cox proportional hazards regression was used to examine variables associated with survival and were summarized by hazard ratio (HR) and 95% confidence interval. Variables with a P-value <0.05 on univariate analysis were included as candidate variables in the multivariate analysis.
Results
Baseline patient demographic and clinical characteristics according to valve morphology are shown in Table 1. Of the 396 patients, 68% were male in both groups and mean age was 68 ± 6 years. Overall, BAV patients were less likely to have multiple comorbidities, as measured by a CCI score of greater than 2 (3 vs. 10%, P = 0.007) compared with TAV patients.
Baseline clinical characteristics
| All patients | Bicuspid | Tricuspid | P-value | |
|---|---|---|---|---|
| (n = 396) | (n = 198) | (n = 198) | ||
| Age, years | 68 ± 6 | 68 ± 7 | 68 ± 5 | 0.15 |
| Male (%) | 271 (68) | 134 (68) | 137 (69) | 0.75 |
| Body surface area, m2 | 2.03 ± 0.24 | 2.00 ± 0.24 | 2.06 ± 0.24 | 0.016 |
| Body mass index, m2/kg | 31.1 ± 6.2 | 29.3 ± 5.5 | 32.9 ± 6.9 | <0.0001 |
| Hypertension (%) | 295 (75) | 132 (67) | 163 (82) | 0.0004 |
| Hyperlipidaemia (%) | 344 (87) | 162 (82) | 182 (92) | 0.0029 |
| Diabetes mellitus (%) | 129 (33) | 37 (19) | 92 (46) | <0.0001 |
| Tobacco use (%) | 27 (7) | 16 (8) | 11 (6) | 0.32 |
| Chronic lung disease (%) | 33 (8) | 14 (7) | 19 (10) | 0.36 |
| Coronary artery disease (%) | 161 (41) | 52 (26) | 109 (55) | <0.0001 |
| Peripheral vascular disease | 40 (10) | 11 (6) | 29 (15) | 0.0027 |
| Prior myocardial infarction (%) | 52 (13) | 15 (8) | 37 (19) | 0.0011 |
| Prior coronary artery bypass (%) | 39 (10) | 9 (5) | 30 (15) | 0.0004 |
| Dialysis (%) | 8 (2) | 1 (0.5) | 7 (3.5) | 0.04 |
| NYHA functional class | 2.48 ± 0.71 | 2.40 ± 0.70 | 2.56 ± 0.72 | 0.049 |
| Class 1 (%) | 29 (7) | 18 (9) | 11 (6) | |
| Class 2 (%) | 169 (43) | 88 (44) | 81 (41) | |
| Class 3 (%) | 176 (44) | 86 (43) | 90 (45) | |
| Class 4 (%) | 22 (6) | 6 (3) | 16 (9) | |
| CCI Score | 0.018 | |||
| 0 (%) | 292 (74) | 148 (75) | 144 (73) | |
| 1–2 (%) | 78 (20) | 44 (22) | 34 (17) | |
| >2 (%) | 25 (6) | 6 (3) | 19 (10) |
NYHA, New York Heart Association; CCI, Charlson Comorbidity Index.
Echocardiographic characteristics are shown in Table 2. BAV and TAV patients had similar aortic valve area index (0.44 ± 0.09 vs. 0.42 ± 0.08 cm2/m2, P = 0.17). There was no difference in left ventricular ejection fraction (LVEF) (62 ± 11 vs. 61 ± 12%, P = 0.12) or left ventricular mass index (122 ± 32 vs. 125 ± 33 g/m2, P = 0.26). BAV patients were less likely to have an E/e’≥15 (46 vs. 66%, P = 0.0002).
Baseline echocardiographic characteristics
| All patients | Bicuspid | Tricuspid | P-value | |
|---|---|---|---|---|
| (n = 396) | (n = 198) | (n = 198) | ||
| LVEF, % | 61 ± 11 | 62 ± 11 | 61 ± 12 | 0.12 |
| LVEF <50% (%) | 42 (11) | 16 (8) | 26 (13) | 0.099 |
| LV mass index | 124 ± 33 | 122 ± 32 | 125 ± 33 | 0.26 |
| Relative wall thickness | 0.48 ± 0.10 | 0.48 ± 0.09 | 0.48 ± 0.10 | 0.31 |
| Stroke volume index, mL/m2 | 48 ± 10 | 50 ± 10 | 46 ± 9 | <0.0001 |
| Aortic valve area, cm2 | 0.87 ± 0.17 | 0.87 ± 0.17 | 0.87 ± 0.16 | 0.58 |
| Aortic valve area index, cm2/m2 | 0.43 ± 0.08 | 0.44 ± 0.09 | 0.42 ± 0.08 | 0.17 |
| Mean gradient, mmHg | 53 ± 13 | 55 ± 13 | 51 ± 12 | 0.0051 |
| LVOT diameter, cm | 2.3 ± 0.2 | 2.34 ± 0.2 | 2.26 ± 0.2 | <0.0001 |
| LAVI, mL/m2 | 40 ± 15 | 38 ± 12 | 43 ± 17 | 0.0067 |
| E/e’ ≥15 (%) | 193 (55) | 85 (46) | 108 (66) | 0.0002 |
| Diastolic function | 0.026 | |||
| Normal (%) | 75 (22) | 48 (24) | 27 (14) | |
| Grade 1 (%) | 133 (39) | 82 (42) | 51 (26) | |
| Grade 2 (%) | 84 (25) | 37 (19) | 47 (24) | |
| Grade 3–4 (%) | 29 (9) | 9 (5) | 20 (10) | |
| Indeterminate (%) | 61 (15) | 18 (9) | 43 (22) | |
| RVSP >40 mmHg (%) | 77 (25) | 26 (17) | 51 (33) | 0.0014 |
| Systemic compliance | 0.97 ± 0.32 | 1.09 ± 0.37 | 0.86 ± 0.28 | <0.0001 |
| Valvulo-arterial impedance | 3.87 ± 0.90 | 3.65 ± 0.87 | 4.08 ± 0.93 | <0.0001 |
| Ascending aorta diameter (mm) | 38.2 ± 5.7 | 40.6 ± 6.1 | 35.8 ± 4.1 | <0.0001 |
LV, left ventricle; EF, ejection fraction; LVOT, left ventricular outflow tract; LAVI, left atrial volume index; E, pulsed-wave Doppler early mitral inflow; e’, mitral annulus early diastolic tissue Doppler velocity; RVSP, right ventricular systolic pressure.
Aortic valve prosthesis type and size are shown in Table 3. Bioprosthesis was the most common prosthesis type in both BAV and TAV (81 vs. 78%, P = 0.54). Mechanical valves (23.8 ± 1.8 vs. 22.8 ± 1.7 mm, P = 0.02) and bioprostheses (24.0 ± 2.0 vs. 23.3 ± 1.8 mm, P < 0.001) were significantly larger in BAV compared with TAV. Transthoracic echocardiogram effective orifice area index (EOAi) was larger in BAV compared with TAV for mechanical valves (1.07 ± 0.34 vs. 0.90 ± 0.24 cm2/m2, P = 0.03) and bioprostheses (1.08 ± 0.32 vs. 0.98 ± 0.26 cm2/m2, P = 0.01).
Aortic valve prosthesis type and size
| All patients | Bicuspid | Tricuspid | P-value | |
|---|---|---|---|---|
| (n = 396) | (n = 198) | (n = 198) | ||
| Valve prosthesis type | 0.54 | |||
| Mechanical (%) | 82 (21) | 38 (19) | 44 (22) | |
| Bioprosthesis (%) | 314 (79) | 160 (81) | 154 (78) | |
| Valve prosthesis size (mm) | 23.6 ± 1.9 | 24.0 ± 2.0 | 23.2 ± 1.8 | <0.0001 |
| Valve prosthesis >21mm (%) | 311 (79) | 165 (83) | 146 (74) | 0.027 |
| EOAi (cm2/m2) | 1.02 ± 0.30 | 1.08 ± 0.33 | 0.96 ± 0.25 | 0.0008 |
| EOAi ≤0.85 cm2/m2 | 115 (31) | 48 (25) | 67 (37) | 0.019 |
EOAi, effective orifice area index.
Concomitant surgeries during AVR are shown in Table 4. Aorta surgeries were more common in BAV patients than TAV patients (24 vs. 2%, P < 0.0001). Concomitant coronary artery bypass graft placement was less common in BAV than TAV (23 vs. 46%, P < 0.0001).
Cuncurrent aortic surgery at the time of aortic valve replacement
| Total | BAV | TAV | P-value | |
|---|---|---|---|---|
| (n = 396) | (n = 198) | (n = 198) | ||
| Septal Myectomy (%) | 17 (4) | 6 (3) | 11 (6) | 0.32 |
| Pericardectomy (%) | 2 (1) | 1 (1) | 1 (1) | 1.00 |
| Endarterectomy (%) | 2 (1) | 0 (0) | 2 (1) | 0.50 |
| Mitral Valve Repair/Replacement (%) | 13 (3) | 4 (2) | 9 (5) | 0.26 |
| Coronary Artery Bypass Graft (%) | 136 (34) | 45 (23) | 91 (46) | <0.0001 |
| Concomitant aorta repair (%) | 52 (13) | 48 (24) | 4 (2) | <0.0001 |
| Pre-AVR ascending aorta diameter (mm) | 47.3 ± 5.3 | 47.7 ± 5.2 | 42.0 ± 3.7 | 0.023 |
| Indication for aorta repair | ||||
| Ascending aneurysm (%) | 46 (88) | 43 (90) | 3 (75) | |
| Aneurysm with root involvement (%) | 3 (2) | 3 (6) | ||
| Fragile aorta (%) | 1 (2) | 1 (2) | ||
| Dissection (%) | 1 (2) | 1 (2) | ||
| Root atheroma (%) | 1 (2) | 1 (25) | ||
| Type of aorta surgery | ||||
| Excision and replacement with graft (%) | 40 (77) | 37 (77) | 3 (75) | |
| Root repair and excision/replacement (%) | 4 (8) | 4 (8) | ||
| Reduction aortoplasty (%) | 6 (12) | 6 (13) | ||
| Plication (%) | 1 (2) | 1 (2) | ||
| Root endarterectomy (%) | 1 (2) | 1 (25) |
AVR, aortic valve replacement; BAV, bicuspid aortic valve; TAV, tricuspid aortic valve.
Mean follow-up time after AVR was 27 ± 23 months for BAV and 28 ± 24 months for TAV patients (P = 0.53). There were 19 deaths among the BAV patients and 38 deaths among the TAV patients (P = 0.006). Overall 5-year survival following AVR was better in BAV compared with TAV patients (79% vs. 61%, P = 0.02) (Figure 1). In multivariable analyses, the major determinants of mortality following AVR were LVEF < 50% (HR: 4.8, P = 0.0005), CCI > 2 (HR: 3.1, P = 0.015), EOAi ≤0.85 cm2/m2 (HR: 2.5, P = 0.004), and bioprosthesis (HR: 3.7, P = 0.02). Observed overall 5-year survival following AVR for BAV stenosis was not different than age- and gender-matched expected survival (observed 79% expected 86%, P = 0.17), but was worse than expected for TAV stenosis (observed 61 vs. expected 86%, P < 0.001) (Figure 2).
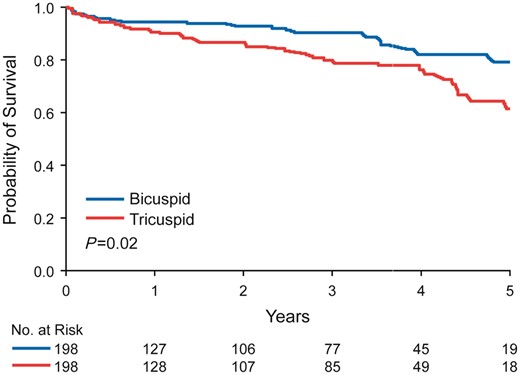
Five-year survival following aortic valve replacement. Overall 5-year survival following aortic valve replacement in an age-matched cohort was superior in bicuspid aortic valve patients compared with tricuspid aortic valve patients (79% vs. 61%, P = 0.02).
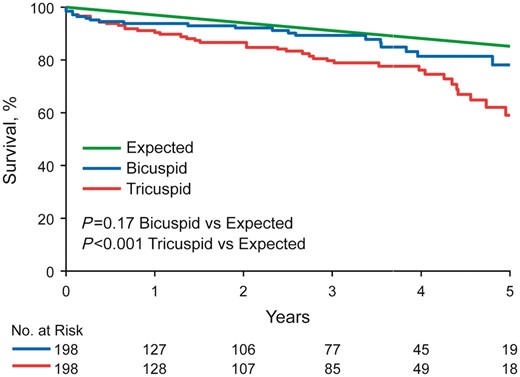
Five-year survival compared with age-matched expected. Overall 5-year survival following aortic valve replacement was not different than age-matched expected survival for bicuspid aortic valve patients (observed 79% vs. expected 86%, P = 0.17), but was worse than expected for tricuspid aortic valve patients (observed 61% vs. expected 86%, P < 0.001).
Discussion
The current study assessed the association of valve morphology to patient comorbidities, clinical profile at the time of AVR, and outcomes following AVR in a cohort of patients with severe AS. The major findings were that after age-matching, patients with TAV compared with BAV stenosis had (i) more cardiovascular risk factors; (ii) greater degree of echocardiographic abnormalities; (iii) less prevalent associated aortopathy; (iv) smaller size prostheses implanted, and (v) lower than expected overall survival following AVR.
The Cardiovascular Health Study (CHS) demonstrated that atherosclerotic risk factors of age, male gender, hypertension, smoking, and dyslipidaemia were significant predictors of the development of aortic valve sclerosis and stenosis in adults over age 65 years with TAV.13 Patients with BAV, however, were excluded in the CHS analyses because of low frequency (n = 4). A separate study of risk factors associated with the development of AS in BAV patients cautioned against extrapolation of the findings in CHS to BAV patients who typically develop AS at a younger age, but did find total cholesterol and hypertension to be risk factors.9 A recent study by Yan et al.32 found a positive, dose–response relationship between hypertension, diabetes, and dyslipidaemia and the incidence of AS in patients age 65 years or older and similarly to the CHS, patients with BAV were excluded. Our current study extends the aforementioned findings and demonstrates atherosclerotic risk factors to be prevalent in both BAV and TAV stenoses without age difference where the majority of patients have associated cardiovascular risk factors. The most common risk factors in both groups were hypertension and hyperlipidaemia. Diabetes was previously shown to be a risk factor for the development of AS33 and in the current study was relatively common in the TAV compared with BAV group. Overall, however, the prevalence of systemic cardiovascular risk factors was significantly lower in BAV compared with TAV stenosis, likely explained by the congenital predisposition for the development of AS in BAV.5,8,34,35
Echocardiographically, despite similar degree of valve stenosis and higher transvalvular gradient in BAV stenosis, patients with TAV stenosis displayed greater degree of cardiac impairment with worse diastolic function, larger left atrial size, and more prevalent pulmonary hypertension, a finding not previously reported. Also, patients with TAV stenosis compared to BAV stenosis had a lower stroke volume, transvalvular mean gradient, and displayed a trend towards being more likely to have reduced left ventricular ejection fraction <50%, which may be related to a combination of increased global afterload and more prevalent CAD in TAV.36–40
Aortic valve prosthesis size, whether mechanical or bioprosthetic, was larger in the BAV group; patient prosthesis mismatch, known to be associated with poor survival following AVR,41–44 was less common in BAV. In this study, bioprostheses were associated with poor survivorship compared to mechanical valve prostheses. However, although some studies have shown survival benefit of mechanical prostheses over bioprostheses in patients younger than 70 years,45–48 other studies have not.49–52 Consequently, according to the 2017 ACC/AHA Focused Update of the 2014 Guidelines, it is reasonable to individualize the choice of mechanical vs. bioprosthetic valve for AVR for AS on the basis of patient preferences for patients between 50 and 70 years of age.53
It is noteworthy that the observed survival following AVR for BAV stenosis was not different from age- and gender-matched expected survival. Similar to our findings, a recent study by Masri et al.18 demonstrated that in patients with BAV, the survivorship following aorta surgery with or without concomitant aortic valve surgery was associated with a significantly lower incidence of death and that survival following surgery was the same as age- and gender-matched expected survival. However, patients in our study population were older and the predominant pathology of the aortic valve was severe aortic valve stenosis, whereas Masri et al. included any degree of valve disease and the predominant valve pathology was aortic regurgitation.
Limitations
This study is subject to the inherent bias of retrospective studies. Because one of our main objectives was to compare cardiovascular comorbidities and their impact on outcomes following surgery, the two groups in our cohort were not propensity matched.
Conclusions
This study compares clinical characteristics, echocardiographic characteristics, and outcomes following AVR in a cohort of age-matched BAV and TAV stenosis. TAV stenosis was associated with a greater prevalence of cardiovascular risk factors and a greater degree of cardiac impairment compared to patients of the same age with BAV stenosis. Patients with BAV also had implanted prosthetic valves that were larger. Consequently, survival after valve replacement is superior for BAV stenosis compared with TAV stenosis. Determinants of poor survival following AVR were higher CCI, LVEF <50%, patient–prosthesis mismatch and bioprostheses. Additional studies are needed to examine if aggressive cardiovascular risk factor management improves outcomes incrementally to AVR in a subset of patients with aortic valve stenosis, particularly those with TAV stenosis.
Funding
This work was supported by the Department of Cardiovascular Diseases, Mayo Clinic.
Conflict of interest: None declared.
