


Abstract
Emerging evidence suggests that early exposure to endocrine disrupting chemicals has long-term consequences that can influence disease risk in offspring. During gametogenesis, imprinted genes are reasonable epigenetic targets with the ability to retain and transfer environmental messages. We hypothesized that exposures to organophosphate (OP) flame-retardants can alter DNA methylation in human sperm cells affecting offspring's health. Sperm and urine samples were collected from 67 men in North Carolina, USA. Urinary metabolites of a chlorinated OP, tris(1,3-dichloro-2-propyl) phosphate, and two non-chlorinated OPs, triphenyl phosphate and mono-isopropylphenyl diphenyl phosphate, were measured using liquid-chromatography tandem mass-spectrometry. Sperm DNA methylation at multiple CpG sites of the regulatory differentially methylated regions (DMRs) of imprinted genes GRB10, H19, IGF2, MEG3, NDN, NNAT, PEG1/MEST, PEG3, PLAGL1, SNRPN, and SGCE/PEG10 was quantified using bisulfite pyrosequencing. Regression models were used to determine potential associations between OP concentrations and DNA methylation. We found that men with higher concentrations of urinary OP metabolites, known to originate from flame-retardants, have a slightly higher fraction of sperm cells that are aberrantly methylated. After adjusting for age, obesity-status and multiple testing, exposure to mono-isopropylphenyl diphenyl phosphate was significantly related to hypermethylation at the MEG3, NDN, SNRPN DMRs. Exposure to triphenyl phosphate was associated with hypermethylation at the GRB10 DMR; and tris(1,3-dichloro-2-propyl) phosphate exposure was associated with altered methylation at the MEG3 and H19 DMRs. Although measured methylation differences were small, implications for public health can be substantial. Interestingly, our data indicated that a multiplicity of OPs in the human body is associated with increased DNA methylation aberrancies in sperm, compared to exposure to few OPs. Further research is required in larger study populations to determine if our findings can be generalized.
Introduction
Over the last few years it has been suggested that environmental pollutants that do not change the DNA sequence can instead alter gene expression through changes in DNA methylation causing reproductive abnormalities or other disorders. Evidence for this derives largely from animal models where exposure to endocrine disruptors was examined. Several of these environmental contaminants not only affect reproductive organs or increase chronic disease susceptibility, but some also have been linked to epigenetic modifications affecting offspring's health [1–3]. Alteration at regulatory sequences of epigenetically malleable regions including differentially methylated regions (DMRs), that regulate establishment and expression of imprinted genes, is one mechanism that could explain the inheritance of environmentally induced risk for diseases. Imprinted genes acquire methyl groups differentially in developing sperm and oocytes and their methylation levels generally remain stable in diploid cells after fertilization and throughout development. Because these genes escape the genome-wide DNA methylation erasure after fertilization, they are reasonable candidates to capture environmentally induced epigenetic information during gametogenesis and transfer this “signature” to the next generation [4, 5].
Our study focuses on the potential effects of organophosphate (OP) flame-retardants on human male gametes and their DNA methylation patterns. OPs are widely present in the indoor environment and mainly originate from manufactured consumer products. OPs of interest include chlorinated OPs, such as tris(1,3-dichloro-2-propyl) phosphate (TDCIPP) and tris(1-chloro-2-propyl) phosphate (TCIPP). Non-chlorinated OP esters include triphenyl phosphate (TPHP), mono-isopropylphenyl diphenyl phosphate (ipPDPP), and mono-terbutylphenyl diphenyl phosphate (tbPDPP). These chemicals are currently used as flame-retardants in furniture coatings, polyurethane fillings or foam, electronic applications, and leisure products [6, 7]. Other applications include paints, adhesives, plasticizers, housing insulation materials, and pesticides used in agriculture [8, 9]. Recent epidemiological studies suggest that exposure to persistent organochlorine pollutants is associated with reduced human fecundity and markers of semen quality [10, 11]. Although harmful effects of new flame-retardants have been reported, to our knowledge no studies have been performed on the impact of recent industrially introduced OPs on the epigenome of animals or humans.
In the current study, we measured levels of OP metabolites in urine of male participants and examined associations between these urinary concentrations and DNA methylation at CpG sites of DMRs at imprinted genes in sperm. Imprinted genes are defined by having parent of origin-dependent methylation and expression. A DMR is a sequence region that exhibits differential methylation on the two parental alleles in a manner that guides monoallelic expression of the imprinted gene. If DNA methylation at the DMR is established during maturation of germ cells it is referred to as a “gametic DMR”. In this case it is continuously maintained in somatic cells and may serve as the imprinting mark throughout life [12]. Alternatively, if methylation is established in the embryo (post-fertilization) the DMR is referred to as a “somatic DMR”. Somatic DMRs serve to maintain parental-specific silencing [12]. We studied DMRs of the following genes where methylation is generally known to be set in place on the paternal allele during gametogenesis: H19 [13], Insulin-like Growth Factor 2 (IGF2) [14], and Maternally Expressed Gene 3 (MEG3; one gametic MEG3-IG DMR [15] and exceptionally also a somatic DMR, named MEG3 DMR [16]. Other DMRs of interest included maternally methylated DMRs of the following genes: Growth factor Receptor-Bound protein 10 (GRB10) [17, 18], Necdin (NDN) [19], Neuronatin (NNAT) [20–22], Paternally Expressed Gene 1/Mesoderm Specific Transcript (PEG1/MEST) [23, 24], Paternally Expressed Gene 3 (PEG3) [25], Pleiomorphic Adenoma Gene-Like 1 (PLAGL1) [24], Epsilon Sarcoglycan/Paternally Expressed Gene 10 (SGCE/PEG10) [26], and Small Nuclear Ribonucleoprotein Polypeptide N (SNRPN) [25]. These imprinted genes were selected because of their importance in growth and development of the early embryo and fetus. Deregulated expression of our genes of interest has been associated with obesity or enlarged adipocyte size [27, 28]. Because of the prominent role imprinted genes play in regulating growth and cell proliferation, these genes are frequently found to exhibit altered methylation and deregulated expression in neoplastic growth and malignancies [29–36]. We therefore set out to test the hypothesis that male exposure to OPs disrupts the normal patterns of methylation established in sperm at imprinted genes. If such associations are found, the affected sperm could transmit these shifted epigenetic patterns to the offspring.
Materials and Methods
Participants and Data Collection
Male volunteers were recruited as part of The Influence of the Environment on Gametic Epigenetic Reprogramming (TIEGER) study. The goal of this North Carolina-based cross-sectional study was to explore if the programming fidelity of the sperm DNA methylation was adversely affected by exposure to environmental factors, including indoor toxins but also factors such as being overweight or obese [14]. Men were recruited in and around the city of Durham, NC (USA), through advertisements on the Internet and flyers posted in the community. Eligibility criteria included: non-smoking, no personal history of cancer, no vasectomy, or other procedures that may cause infertility, in the age range of 18–35, and Caucasian; this was applied to keep our population relatively homogenous in this small study sample. Between May 2012 and November 2013 a total of 81 men contacted the study nurse. Volunteers were requested to abstain from ejaculation for at least 3 days, but no more than 10 days prior to their visit. Six men declined participation prior to informed consent. Eight men were excluded from our analyses because they were either non-Caucasian (n = 6) or failed to produce enough sperm cells (n = 2). DNA methylation analyses for a total of 67 Caucasian participants were used in the present analyses. At recruitment, body mass index (BMI) was measured and a short questionnaire was completed by the participants, soliciting information on socio-demographic factors, including level of education, marital status, number of biological children, current occupation, and other occupations over the prior 5 years with potential for high exposures to OPs (e.g. furniture manufacturing, carpet cleaner, pest control, electronics assembly and agriculture). The study protocol was approved by the Institutional Review Board at Duke University (reference number: Pro00036645). Informed consent was obtained from all participants for the use of their biological specimens and questionnaire data.
Specimen Collection
Samples of urine and semen were obtained on the day of recruitment. Urine was stored in an amber-colored glass container at −20 °C. Semen was collected, processed and stored as described earlier [14]. In brief, semen was analyzed for standard clinical parameters after liquefaction, no later than 60 min from collection. These parameters include volume, pH, viscosity, liquification time, presence of white blood cells, concentration, and motility. The World Health Organization’s Laboratory Manual for the Examination and Processing of Human Semen 5th edition was referenced for normal values [37]. After completion of the clinical sperm analyses, the samples were subjected to two-step ISolate-gradient centrifugation (Irvine Scientific) to select a motile population enriched in normal morphology. This colloidal silica gradient, consisting of a 90% lower layer and 50% upper layer, is prepared by sequentially adding 1.5 ml of each layer to a 15-ml polystyrene conical tube. The sperm sample was pipetted on top of the upper layer and centrifuged at 200×g for 15 min. The gradient solution was removed and the pelleted sperm was stored at −80 °C for subsequent DNA methylation analyses. Sperm sample enrichment for motility and morphology prior to epigenetic analysis was intended to select a population most likely to fertilize an oocyte and result in pregnancy. Fertilization rates correlate with motility and morphology [38, 39].
DNA Methylation Measurements at Imprinted Genes
Genomic DNA was extracted from sperm samples using Puregene Reagents (Qiagen, Valencia, CA, USA). Genomic DNA (800 ng) was treated with sodium bisulfite using the EZ DNA Methylation Kit (Zymo Research, Irvine, CA, USA). After bisulfite treatment, DNA (∼40 ng, assuming complete recovery) was amplified by PCR in a 25-µl reaction volume. Primer sequences and PCR conditions used for the DMRs were reported previously [14, 36, 40]. Briefly, the 5′ end of one primer of each PCR primer pair was conjugated to biotin to facilitate post-PCR retention of one strand with streptavidin beads. Using the Pyrosequencing Work Station, the single strand was isolated and then underwent pyrosequencing using a PyroMark Q96 MD pyrosequencing instrument (Qiagen). The region upstream from the IGF2 promoters includes three CpG dinucleotides (chr 11p15.5). The DMR for H19 has four CpG sites (chr 11 p15.5). The two DMRs analyzed for the DLK1/MEG3 imprinted domain consist of the MEG3-IG (4 CpG sites) and MEG3 (8 CpG sites) at chr 14q32.2. The following DMRs were also tested: GRB10 (6 CpG sites, chr 7p12.2), NDN (6 CpG sites, chr 15q11.2), NNAT (3 CpG sites, chr 20q.11.2), PLAGL1 (6 CpG sites, chr 6q24), SGCE/PEG10 (6 CpG sites, chr 7q21.3), SNRPN (4 CpG sites, chr 15q11.2), PEG1/MEST (4 CpG sites, chr 7q21.3), and PEG3 (10 CpG sites, chr 19q13.43). Assay validation data and the results of sensitivity tests for pyrosequencing have been previously described. We have shown that pyrosequencing can distinguish as little as 0.5% differences when methylation levels are low [14, 36, 40].
Extraction and Instrumental Analyses of OPs in Urine
Urinary metabolites of TDCIPP (bis(1,3-dichloro-2-propyl) phosphate or BDCIPP), TCIPP (bis(1-chloro-2-propyl) phosphate or BCIPP), TPHP (diphenyl phosphate or DPHP), ipPDPP (isopropylphenyl phenyl phosphate or ipPPP) and tbPDPP (terbutylphenyl phenyl phosphate or tbPPP) were extracted and quantified using previously described methods [41–43]. Briefly, urine samples were thawed and a 5-ml aliquot was spiked with mass-labeled internal standards (d10-BDCIPP and d10-DPHP) and acidified to pH < 6.5 with formic acid. Urine samples were concentrated and cleaned using StrataX-AW SPE columns as previously described [41]. The eluent from the SPE column was blown to dryness under a gentle nitrogen stream, reconstituted in 500 μl of 1:1 H2O:MeOH and spiked with the recovery standard (13C2-DPHP). Data were acquired under multiple reaction monitoring conditions using optimized parameters. BDCIPP was corrected for recovery using d10-BDCIPP, while DPHP, ipPPP, and tbPPP were corrected for recovery using d10-DPHP. Specific gravity (SG) measurements were taken with a digital refractometer (Atago USA, Inc., Bellevue, WA, USA) prior to analysis. In urine samples, the mean recovery of the mass-labeled standards was 91 ± 11% for d10-DPHP and 126 ±40% for d10-BDCIPP. One replicate and laboratory blank (5 ml Milli-Q water only) sample was extracted with every batch (n= 8). Replicate values were generally within 13%. Very low levels of DPHP (mean= 0.12 ng) were consistently detected in the laboratory blanks. Urine analyte values were blank corrected using the mean laboratory blank values. Method detection limits (MDLs) were calculated as either three times the standard deviation of laboratory blanks (if detected in the laboratory blanks) normalized to the volume extracted (5 ml), or by using a signal to noise ratio of 10 (if no analytes were detected in the lab blanks). MDLs were 88 pg/ml for BCIPP, 65 pg/ml for BDCIPP, 119 pg/ml for DPHP, 46 pg/ml for ipPPP, and 94 pg/ml for tbPPP, respectively. Concentrations were normalized to SG as previously described [44].
Statistics and Categorization of Variables
Raw urinary OP measurements were normalized, taking into account the SG of the urine sample. Correcting for SG is frequently used as an alternative to creatinine correction, because urinary creatinine concentrations may vary within and between persons [45]. Exposure values below the MDL were replaced by the value of the detection limit. Hence, if values were below the MDL, the SG normalization was applied on the detection limit. This implied that two subjects with an exposure measured below the detection limit had a different SG normalized value as soon as the specific urine gravity differed. We calculated the mean and median of each OP for both values, raw and normalized. Two metabolites, tbPPP and BCIPP, did not reach a detection frequency that was high enough to proceed further statistical analyses, hence we did not include them in our further statistical analyses.
Spearman correlations were used to evaluate relationships between exposures to BDCIPP, DPHP and ipPPP, and DNA methylation at each CpG site of the DMRs of imprinted genes listed above. A total of sixty-four correlations were tested. Findings based on normalized values were similar to those from raw data and are presented here, whereas the results based on the raw values are shown in Supplementary data. Multivariable regression models were used to evaluate the relationships between concentrations of each specific OP metabolite and a specific outcome (DNA methylation at each CpG site), adjusting for confounding by age and BMI status, being overweight or obese (dichotomized as BMI ≥25 versus BMI <25), and potential selection bias by patient status (since 28% of our study population was recruited from the Duke Fertility Center). A robust regression approach was adopted to reduce the potential influence of outliers in response and predictor space [46]. Supplementary sensitivity analyses were performed using only the subgroups of non-patients (n = 48) and non-obese men (n = 44). To obtain a more symmetric distribution of model residuals, exposure values and methylation values were log-transformed (the latter after adding a constant of 1, given the presence of zero values in DNA methylation). To interpret results of our regression analyses we back-transformed our variables and calculated the predictive absolute and relative effects on the numbers of sperm cells methylated (at maternally imprinted genes) or unmethylated (at paternally methylated genes) at each CpG site, comparing the 75th quartile (Q3) with the 25th quartile (Q1) in OP exposure (Table 3); these effects are further referred as interquartile DNA methylation effects. Odds ratios from a logistic regression model, correcting for age and obesity status, are reported; cutoff values for exposure (OP concentration) and outcome (methylation %) were based on the median values. To take into account the correlation between multiple endpoints (n = 64 for each OP) the Dubey/Armitage-Parmar (D/AP) procedure was applied, referred by Sankoh et al. [47]. Based on our data an average Spearman correlation of 0.324 was measured. Consequently, an α-level of 0.0031 could be applied to keep the type-I error under control. In order to verify the effect of exposure to multiple OPs in one subject we performed the following analyses. Binary multivariable logistic regression models, correcting for age and BMI-status, were used to evaluate the relation between exposure and (mean) methylation. The exposure was quantified per subject as the number of OPs with “high” exposure (defined as exposure value above the median), hence varying between zero and three. DNA methylation was dichotomized using the median methylation value of the specific CpG (or the mean of CpGs, if the mean methylation per gene was studied) in the dataset. This binary variable served as dependent variable in the regression model, thus the probability of increased methylation is modeled. We first considered a distinction between subjects without any exposure above the median and subjects with one, two or three high exposures (Table 4A). Further, a distinction was made as a function of the accumulation of “high” exposures to multiple OPs (Table 4B and C).
In addition to DNA methylation in sperm, the second outcome in our study included clinical sperm characteristics. These were evaluated as continuous variables and as binary sperm parameters (normal versus abnormal), based on the WHO cut-off values [37]. A total motile count (TMC) of ≤39 × 106 spermatozoa/ejaculate was categorized as abnormal TMC. Sperm motility lower than 40% was characterized as abnormal (or asthenozoospermia), and sperm concentration of <15× 106 spermatozoa/ml was considered as oligozoospermia. Spearman correlations were used to evaluate the relation between exposure and TMC and sperm motility percentage. All analyses were performed using SAS software, version 9.2 of the SAS System for Windows.
Ethics
The TIEGER Study was performed with the approval of the Duke University Institutional Review Board (reference number: Pro00036645). Informed consent was obtained from all participants for the use of their biological specimens and questionnaire data.
Results
Characteristics of Study Participants and Measured Urinary and Sperm Variables
Socio-demographic data of the study population are shown in Table 1. About 40% were aged less than 25 years old, 28% were 25–29 years old, and 31% were 30–35 years old. About one-third had a graduate degree. Most men had no children (87%) and half (53%) were single. Twenty-three men were categorized as overweight or obese, representing 33.3% of our study population. Of these, 11 were classified as overweight (25 ≤ BMI < 30) and 12 as obese (BMI ≥30). Having a BMI of 25 or more was strongly associated with older age (P = 0.001). Marital status was also strongly associated with age (P < 0.001). The subgroup of patients recruited from the clinic was more likely to be obese or overweight compared to those recruited through advertisements (P < 0.001). Furthermore, being a patient at the clinic and being 30 or older were strongly associated (P < 0.001). In general, few men showed abnormal clinical sperm parameters. Only three participants had oligozoospermia. Asthenozoospermia was detected in 19.7%; the mean percentage of motility was 52.2% (SD: 13.09) and the median was 54.9% (range: 8.3–76.7). TMC—a parameter combining sperm count, motility and volume—was abnormal in 18.2% of our participants; the mean was 130.0×10⁶ (SD: 104.0×10⁶) and the median was 112.5×10⁶ (range: 3.7×10⁶ to 650.0×10⁶).
Socio-demographic and clinical sperm data of study participants and frequencies of OP exposures
| TIEGER participants (n=67) | na | % | |
|---|---|---|---|
| Age (years) | 18–24 | 27 | 40.3 |
| 25–29 | 19 | 28.4 | |
| 30–35 | 21 | 31.3 | |
| Marital status | Single/divorced/widow | 35 | 53.0 |
| Married/living with partner | 30 | 45.5 | |
| Divorced/widow | 1 | 1.5 | |
| Fathered at least one child | No | 58 | 86.6 |
| Yes | 9 | 13.4 | |
| Highest degree of education | High school | 6 | 10.7 |
| Some college or college degree | 32 | 57.1 | |
| Graduate | 18 | 32.1 | |
| Obesity status | normal weight (18 ≤ BM < 25) | 44 | 66.7 |
| overweight or obese (25 ≤ BMI) | 23 | 33.3 | |
| Patient at fertility clinic | No | 48 | 71.6 |
| Yes | 19 | 28.4 | |
| Sperm total motile count(TMC) | ≤39×106 (abnormal) | 12 | 18.2 |
| >39×106 (normal) | 54 | 81.8 | |
| Sperm motility | <40% (asthenozoospermia) | 13 | 19.7 |
| ≥40% (normal) | 53 | 80.3 | |
| Sperm concentration | <15×106 (oligozoospermia) | 3 | 4.6 |
| ≥15×106 (normal) | 62 | 95.4 | |
| BDCIPP | Detected (above MDL) | 66 | 98.5 |
| DPHP | Detected (above MDL) | 66 | 98.5 |
| ipPPP | Detected (above MDL) | 60 | 89.6 |
| tbPPP | Detected (above MDL) | 13 | 19.4 |
| BCIPP | Detected (above MDL) | 5 | 7.5 |
MDL, measured detection limit.
aIf the sum was not 67, data were missing, and percentage was calculated on known data.
Urinary DPHP and BDCIPP were detected in nearly all TIEGER participants, and ipPPP was detected in about 90% of our male participants (Table 1). We observed a significant correlation between DPHP and ipPPP (ρ = 0.28; P = 0.021) and between DPHP and BDCIPP (ρ = 0.33; P = 0.0067), suggesting a low-level of co-occurrence of these chemicals. Urinary concentrations of tbPPP and BCIPP were detected in 19 and 8% of our subjects, respectively. Supplementary Table S1 shows the normalized and raw urinary values of the OPs that were frequently measured. The range of urinary DPHP, BDCIPP and ipPPP varied from very low (around zero) to several times the median (Supplementary Fig. S1). Median values of normalized DPHP, BDCIPP, and ipPPP were 1.76, 2.61, and 0.72 ng/ml, respectively. All exposures were expected to be non-occupational; hence, within a seemingly “low-range” of environmental exposure. We calculated the mean outcomes of DNA methylation at each DMR (Table 2), as well as at each individual CpG site (Supplementary Table S2). In general, methylation outcomes were as expected. Maternally methylated genes were close to 0% methylation in sperm cells, consistent with the maternal methylation marks undergoing erasure in primordial germ cells. Paternally methylated genes were close to fully methylated, although none were 100% methylated. Only 80, 88, and 94% of the sperm cells were methylated at the DMRs of MEG3-IG, H19, and IGF2, respectively. One exception, however still consistent, is the DMR of MEG3 that acquires DNA methylation after fertilization; hence, this paternally methylated gene is unmethylated (∼0%) in sperm.
Mean DNA methylation at imprinted genes and associations with OP exposures
| Genes | |||||||||||||
|---|---|---|---|---|---|---|---|---|---|---|---|---|---|
| GRB10 | H19 | IGF2 | MEG3 | MEG3-IG | PEG1/MEST | NDN | NNAT | PEG3 | PLAGL1 | SGCE/PEG10 | SNRPN | ||
| Mean % (SD) | 1.82 (0.97) | 88.06 (2.14) | 93.92 (2.14) | 1.78 (2.81) | 80.00 (1.95) | 1.63 (0.52) | 1.52 (1.62) | 1.87 (1.67) | 1.52 (1.41) | 4.08 (5.56) | 3.13 (3.45) | 1.60 (0.94) | |
| Associations with OP exposures | |||||||||||||
| ipPPP | Beta | +0.022 | −0.001 | +0.001 | +0.083* | +0.001 | +0.003 | +0.074 | +0.065 | +0.051 | +0.137 | +0.09 | +0.068* |
| (P-value) | (0.24) | (0.66) | (0.78) | (0.0005) | (0.82) | (0.92) | (0.03) | (0.06) | (0.13) | (0.19) | (0.06) | (0.0039) | |
| OR | 1.26 | 0.71 | 0.76 | 2.59 | 1.54 | 0.89 | 2.73 | 1.81 | 1.53 | 1.49 | 1.68 | 2.52 | |
| (95%CI) | (0.44; 3.60) | (0.24; 2.06) | (0.28; 2.10) | (0.94; 7.11) | (0.57; 4.19) | (0.33; 2.42) | (0.93; 7.97) | (0.62; 5.33) | (0.57; 4.09) | (0.54; 4.14) | (0.56; 4.96) | (0.87; 7.28) | |
| DPHP | Beta | +0.006 | −0.003 | −0.001 | +0.064 | −0.004 | +0.020 | +0.008 | +0.051 | +0.034 | +0.261 | +0.104 | +0.066 |
| (P-value) | (0.78) | (0.30) | (0.83) | (0.01) | (0.16) | (0.55) | (0.82) | (0.17) | (0.33) | (0.02) | (0.06) | (0.02) | |
| OR | 1.45 | 0.82 | 1.13 | 2.35 | 0.44 | 0.86 | 1.50 | 1.60 | 1.67 | 3.11 | 1.77 | 5.97 | |
| (95%CI) | (0.46; 4.52) | (0.26; 2.54) | (0.38; 3.32) | (0.78; 7.07) | (0.15; 1.29) | (0.29; 2.55) | (0.49; 4.58) | (0.51; 5.03) | (0.57; 4.89) | (0.96; 10.15) | (0.55; 5.68) | (1.59; 22.48) | |
| BDCIPP | Beta | +0.025 | −0.006 | −0.001 | +0.020 | −0.004 | −0.001 | +0.018 | +0.019 | +0.018 | −0.046 | +0.012 | +0.037 |
| (P-value) | (0.16) | (0.02) | (0.64) | (0.35) | (0.04) | (0.96) | (0.52) | (0.51) | (0.51) | (0.61) | (0.79) | (0.11) | |
| OR | 1.09 | 0.32 | 0.59 | 1.81 | 0.44 | 1.15 | 1.22 | 1.31 | 1.34 | 0.97 | 0.89 | 1.62 | |
| (95%CI) | (0.37; 3.24) | (0.09; 1.09) | (0.20; 1.73) | (0.64; 5.13) | (0.15; 1.27) | (0.40; 3.31) | (0.42; 3.56) | (0.43; 4.02) | (0.48; 3.75) | (0.33; 2.80) | (0.30; 2.63) | (0.55; 4.74) | |
In the upper row the mean methylation % is shown in sperm samples from TIEGER participants. For each OP the associations with DNA methylation at the DMRs were tested by a multivariable robust regression model adjusted for age and BMI status. Beta-coefficients are provided in log-scale. Odds ratios (OR) are shown after a logistic regression analyses on dichotomized normalized values (median used as cutoff), corrected for age and BMI status. Significant results are marked in bold.
The associations that remained significant after correction for multiple testing. OR are shown after a logistic regression analyses on dichotomized normalized values (median used as cutoff), corrected for age and BMI status.
Associations between Metabolites of OPs and DNA Methylation
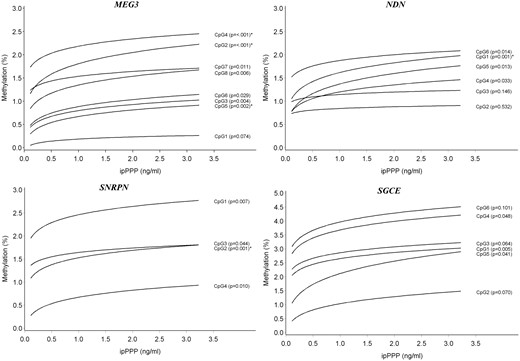
DNA methylation in sperm by urinary ipPPP concentration at the MEG3, NDN, SNRPN, and SGCE DMRs; the predicted DNA methylation percentages at each CpG site are shown by ipPPP concentration; adjusted for age and overweight/obesity status. *Associations that remained significant after taking into account multiple testing at all genes and CpG sites in this study
Associations between normalized OPs and DNA methylation at CpG sites of imprinted genes
| OP | DMR_CpG | β-coefficient | Predicted methylation % | IQ effect size | P-value | OR (95%CI) | ||
|---|---|---|---|---|---|---|---|---|
| at Q1 | at Q2 | Difference | Relative effect | |||||
| ipPPP | GRB10_CPG6 | 0.021 | 1.896 | 1.982 | +0.087 | +4.6 | 0.0244 | 1.7 (0.6; 4.8) |
| ipPPP | H19_CPG1^ | −0.005 | 95.749 | 95.127 | −0.622 | −14.6 | 0.0438 | 0.4 (0.1; 1.2) |
| ipPPP | MEG3_CPG2 | 0.120 | 1.425 | 1.869 | +0.445 | +31.2 | 0.0003 | 4.7 (1.6; 13.6) |
| ipPPP | MEG3_CPG3 | 0.102 | 0.586 | 0.831 | +0.245 | +41.9 | 0.0036 | 2.4 (0.9; 6.6) |
| ipPPP | MEG3_CPG4 | 0.070 | 1.923 | 2.224 | +0.302 | +15.7 | 0.0008 | 4.5 (1.5; 13.1) |
| ipPPP | MEG3_CPG5 | 0.117 | 0.448 | 0.707 | +0.259 | +57.7 | 0.0021 | 1.7 (0.6; 4.5) |
| ipPPP | MEG3_CPG6 | 0.111 | 0.645 | 0.923 | +0.278 | +43.1 | 0.0291 | 2.2 (0.8; 6.1) |
| ipPPP | MEG3_CPG7 | 0.058 | 1.362 | 1.563 | +0.201 | +14.7 | 0.0111 | 2.7 (1.0; 7.9) |
| ipPPP | MEG3_CPG8 | 0.112 | 1.048 | 1.397 | +0.349 | +33.3 | 0.0060 | 2.4 (0.9; 6.6) |
| ipPPP | NDN_CPG1 | 0.111 | 1.284 | 1.671 | +0.387 | +30.1 | 0.0013 | 4.1 (1.2; 13.4) |
| ipPPP | NDN_CPG4 | 0.097 | 0.953 | 1.239 | +0.286 | +29.9 | 0.0333 | 2.4 (0.8; 6.9) |
| ipPPP | NDN_CPG5 | 0.132 | 1.018 | 1.429 | +0.411 | +40.3 | 0.0134 | 1.9 (0.7; 5.3) |
| ipPPP | NDN_CPG6 | 0.061 | 1.670 | 1.908 | +0.238 | +14.3 | 0.0140 | 2.7 (1.0; 7.5) |
| ipPPP | NNAT_CPG1 | 0.105 | 0.152 | 0.334 | +0.183 | +120.3 | 0.0471 | 4.1 (1.2; 13.4) |
| ipPPP | SGCE_CPG1 | 0.084 | 2.297 | 2.708 | +0.410 | +17.9 | 0.0047 | 3.0 (1.1; 8.4) |
| ipPPP | SGCE_CPG4 | 0.092 | 3.182 | 3.758 | +0.576 | +18.1 | 0.0480 | 2.2 (0.8; 6.3) |
| ipPPP | SGCE_CPG5 | 0.192 | 1.465 | 2.228 | +0.763 | +52.1 | 0.0408 | 1.0 (0.4; 2.9) |
| ipPPP | SNRPN_CPG1 | 0.073 | 2.164 | 2.507 | +0.342 | +15.8 | 0.0072 | 3.0 (1.1; 8.4) |
| ipPPP | SNRPN_CPG2 | 0.088 | 1.269 | 1.569 | +0.300 | +23.6 | 0.0014 | 3.3 (1.1; 9.5) |
| ipPPP | SNRPN_CPG3 | 0.052 | 1.480 | 1.667 | +0.187 | +12.6 | 0.0442 | 3.0 (1.1; 8.3) |
| ipPPP | SNRPN_CPG4 | 0.125 | 0.435 | 0.710 | +0.275 | +63.2 | 0.0104 | 3.1 (1.1; 9.1) |
| DPHP | GRB10_CPG5 | 0.053 | 2.488 | 2.687 | +0.199 | +8.0 | 0.0022 | 2.5 (0.8; 7.9) |
| DPHP | MEG3_CPG1 | 0.082 | 0.087 | 0.185 | +0.098 | +112.1 | 0.0107 | 2.7 (0.8; 8.8) |
| DPHP | MEG3_CPG2 | 0.083 | 1.503 | 1.729 | +0.226 | +15.1 | 0.0337 | 1.3 (0.5; 3.9) |
| DPHP | MEG3_CPG3 | 0.079 | 0.605 | 0.744 | +0.139 | +22.9 | 0.0468 | 2.3 (0.7; 7.0) |
| DPHP | MEG3_CPG4 | 0.053 | 1.975 | 2.143 | +0.168 | +8.5 | 0.0203 | 1.7 (0.6; 5.0) |
| DPHP | MEG3IG_CPG2^ | −0.012 | 79.966 | 78.941 | −1.025 | −6.4 | 0.0061 | 0.9 (0.3; 3.0) |
| DPHP | NNAT_CPG3 | 0.087 | 2.608 | 2.951 | +0.344 | +13.2 | 0.0343 | 1.6 (0.5; 5.0) |
| DPHP | PLAGL1_CPG1 | 0.257 | 1.691 | 2.520 | +0.829 | +49.0 | 0.0338 | 2.4 (0.8; 7.5) |
| DPHP | PLAGL1_CPG2 | 0.264 | 1.559 | 2.374 | +0.815 | +52.3 | 0.0385 | 3.1 (1.0; 10.1) |
| DPHP | PLAGL1_CPG4 | 0.290 | 1.697 | 2.653 | +0.957 | +56.4 | 0.0203 | 3.1 (1.0; 10.1) |
| DPHP | PLAGL1_CPG5 | 0.307 | 1.572 | 2.548 | +0.975 | +62.0 | 0.0045 | 2.8 (0.9; 8.8) |
| DPHP | SGCE_CPG2 | 0.230 | 0.574 | 1.001 | +0.427 | +74.4 | 0.0180 | 1.7 (0.6; 4.9) |
| DPHP | SGCE_CPG6 | 0.121 | 3.388 | 3.979 | +0.591 | +17.4 | 0.0226 | 1.7 (0.5; 5.2) |
| BDCIPP | GRB10_CPG5 | 0.029 | 2.592 | 2.727 | +0.135 | +5.2 | 0.0305 | 1.4 (0.5; 4.2) |
| BDCIPP | H19_CPG2^ | −0.020 | 67.792 | 66.070 | −1.722 | −5.3 | 0.0482 | 0.4 (0.1; 1.3) |
| BDCIPP | H19_CPG3^ | −0.005 | 93.319 | 92.747 | −0.572 | −8.6 | 0.0026 | 0.2 (0.1; 0.8) |
| BDCIPP | MEG3IG_CPG5^ | −0.007 | 80.408 | 79.678 | −0.730 | −3.7 | 0.0021 | 0.3 (0.1; 1.0) |
Multivariable robust linear regression results adjusted for age and BMI status with P-values <0.05; beta-coefficients are provided in log-scale. In bold are the associations that are still significant after D/AP correction, given a nominal α-level of 0.0031. The interquartile (IQ) relative effect (in %) can be derived from the predicted difference in DNA methylation (column 6), comparing OP exposures between Q1 to Q3.
CpG sites that are paternally methylated. At the paternally methylated genes, the IQ effect size represents the relative change in cells that are (aberrantly) unmethylated. At the maternally methylated genes, this value represents the relative change in number of cells that are (aberrantly) methylated. Odds ratios (OR) are shown after a logistic regression analyses on dichotomized normalized values (median used as cutoff), corrected for age and BMI status.
Effects of multiple OP exposures on sperm DNA methylation
| Gene | A. | B. | C. | |||
|---|---|---|---|---|---|---|
| Comparison to “no” exposure | Comparison to 1 exposure | Comparison to 2 exposures | ||||
| 1 versus 0 | 2 versus 0 | 3 versus 0 | 2 versus 1 | 3 versus 1 | 3 versus 2 | |
| OR (95% CI) | OR (95% CI) | OR (95% CI) | OR (95% CI) | OR (95% CI) | OR (95% CI) | |
| GRB10 | 0.69 (0.13; 3.58) | 0.79 (0.14; 4.27) | 1.72 (0.25; 11.78) | 1.14 (0.31; 4.15) | 2.50 (0.49; 12.65) | 2.19 (0.43; 11.18) |
| H19 | 0.46 (0.07; 2.96) | 0.18 (0.03; 1.22) | 0.32 (0.04; 2.65) | 0.39 (0.10; 1.44) | 0.69 (0.14; 3.30) | 1.78 (0.34; 9.30) |
| IGF2 | 0.46 (0.09; 2.26) | 0.44 (0.08; 2.37) | 0.47 (0.07; 3.14) | 0.96 (0.28; 3.30) | 1.02 (0.22; 4.74) | 1.06 (0.22; 5.15) |
| MEG3 | 1.27 (0.27; 6.06) | 1.69 (0.32; 8.92) | 11.04 (1.33; 91.67) | 1.33 (0.39; 4.54) | 8.70 (1.47; 51.30) | 6.53 (1.09; 39.11) |
| MEG3IG | 0.40 (0.08; 1.99) | 0.58 (0.11; 3.12) | 0.236 (0.04; 1.59) | 1.45 (0.43; 4.85) | 0.60 (0.14; 2.62) | 0.41 (0.09; 1.88) |
| NDN | 0.77 (0.15; 3.88) | 1.23 (0.22; 6.72) | 3.37 (0.50; 22.62) | 1.59 (0.43; 5.86) | 4.37 (0.90; 21.22) | 2.75 (0.56; 13.41) |
| NNAT | 1.01 (0.20; 5.11) | 1.35 (0.24; 7.48) | 3.25 (0.44; 23.90) | 1.33 (0.35; 5.00) | 3.21 (0.58; 17.69) | 2.41 (0.41; 14.07) |
| PEG1/MEST | 0.81 (0.17; 3.84) | 1.51 (0.29; 7.93) | 0.64 (0.10; 3.91) | 1.87 (0.53; 6.59) | 0.79 (0.18; 3.38) | 0.42 (0.10; 1.87) |
| PEG3 | 1.64 (0.35; 7.69) | 1.50 (0.29; 7.71) | 3.68 (0.57; 23.64) | 0.92 (0.28; 3.05) | 2.24 (0.51; 9.83) | 2.45 (0.54; 11.09) |
| PLAGL1 | 0.40 (0.08; 2.00) | 1.35 (0.26; 7.17) | 1.78 (0.26; 12.15) | 3.38 (0.92; 12.34) | 4.44 (0.90; 22.02) | 1.32 (0.28; 6.26) |
| SGCE | 0.95 (0.18; 5.11) | 0.82 (0.14; 4.84) | 2.44 (0.35; 16.91) | 0.86 (0.23; 3.28) | 2.58 (0.53; 12.44) | 2.99 (0.59; 15.19) |
| SNRPN | 0.75 (0.15; 3.87) | 1.65 (0.28; 9.66) | 14.62 (1.54; 138.37) | 2.19 (0.56; 8.61) | 19.44 (2.80; 134.81) | 8.87 (1.35; 58.35) |
Results of multivariable logistic regression models on dichotomized exposure and the mean methylation for each DMR (median is cutoff), corrected for age and BMI status.
“Exposure” is defined as to DPHP, BDCIPP, or ipPPP above the median value. The OR compares the odds of having an increased DNA methylation between subjects with at least one high exposure and subjects with less exposures (below the median); hence, column A shows all combinations of exposures (to 1, 2, or 3 OPs) versus zero OP exposures (below the median), column B shows all higher combinations of exposures (2 or 3) versus 1 OP exposure, and column C shows exposure to 3 OPs versus 2 OPs. Significant results are shown in bold.
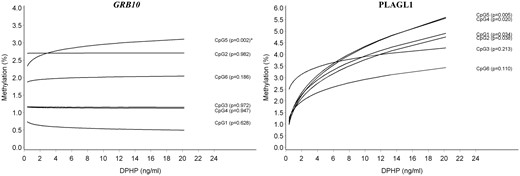
DNA methylation in sperm by urinary DPHP concentration at the GRB10 and PLAGL1 DMR; the predicted DNA methylation percentages at each CpG site are shown by DPHP concentration; adjusted for age and overweight/obesity status. *Associations that remained significant after taking into account multiple testing at all genes and CpG sites in this study
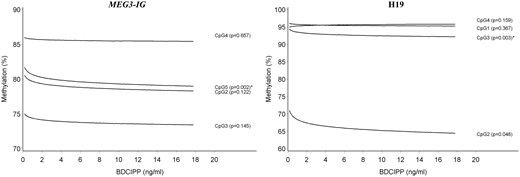
DNA methylation in sperm by urinary BDCIPP concentration at the MEG3-IG and H19 DMRs; the predicted DNA methylation percentages at each CpG site are shown by BDCIPP concentration; adjusted for age and overweight/obesity status. *Associations that remained significant after taking into account multiple testing at all genes and CpG sites in this study
We further redid our analyses on raw urinary OP concentrations, hence without correction for urinary density. Although fewer correlations between raw values and DNA methylation outcomes were significant, the direction of associations was comparable with the analyses using the normalized OP values (Supplementary Table S4).
DNA Methylation in Sperm by Exposure to Multiple OPs
We verified a potential impact of exposures to more than one OP on DNA methylation in sperm, as described in the methods section. In brief, results of our multivariable logistic regression model on dichotomized exposure to OPs and DNA methylation in sperm are shown for the mean DMRs in Table 4. The odds ratios presented in Table 4A reflect the impact on the mean DNA methylation if a subject was exposed to any of the OPs (ipPPP, DPHP, or BDCIPP) versus if a subject was not exposed or below median values. Exposure was separated by one, two, or three (cumulative) OP exposures, regardless of the nature of the exposure (ipPPP, DPHP, or BDCIPP). We found an OR of 11.04 (95% CI: 1.33; 91.67) and 14.62 (95% CI: 1.54; 138.37) at MEG3 and SNRPN, respectively, if an individual was exposed to 3 OPs versus no OPs. We further verified the effects of an increase in exposure as follows: 2 OPs versus 1 OP and 3 OPs versus 1 OP (Table 4B); as well as 3OPs versus 2OPs (Table 4C). Again, we found significant effects with increasing exposures at the MEG3 and SNRPN DMRs. For example, the odds for being hypermethylated was 6.53 (95% CI: 1.09; 39.11) at MEG3 DMR and 8.87 (95% CI: 1.35; 58.35) at SNRPN DMR, when exposed to 3 OPs compared to 2 OPs (Table 4C).
Assessment of Associations between OPs, Clinical Sperm Parameters and DNA Methylation
We examined if clinical sperm characteristics were associated with exposure to OPs. A Spearman correlation analysis showed that most clinical characteristics were not related to OP concentration. Only an increase in ipPPP was associated with a decrease in TMC (ρ = −0.25; P = 0.04) (Table 5). This association was attenuated when age, BMI and patient status were included in the model (β = −23.57; P = 0.06). We further verified if the outcomes, DNA methylation and TMC or motility, were correlated using a Spearman correlation test (Supplementary Table S5). We found that lower TMC was associated with higher DNA methylation at genes that are normally unmethylated in sperm, this was particularly the case at sites that were also affected by ipPPP, such as CpG4 and CpG5 of the MEG3 DMR (P-values are 0.0007 and 0.0002, respectively).
Associations between OPs and clinical sperm parameters
| Motility | TMC | |||||||
|---|---|---|---|---|---|---|---|---|
| ρ | P | β | P | ρ | P | β | P | |
| BDCIPP | −0.025 | 0.84 | +0.103 | 0.95 | −0.033 | 0.79 | −0.749 | 0.95 |
| DPHP | +0.231 | 0.06 | +0.765 | 0.72 | −0.050 | 0.69 | −10.324 | 0.46 |
| ipPPP | +0.105 | 0.40 | +0.514 | 0.79 | −0.254 | 0.04 | −23.570 | 0.06 |
Spearman ρ correlation coefficients and beta-coefficients of our robust regression analyses are shown. The latter was corrected for age, obesity, and patient status.
Discussion
With the phase-out of some brominated flame-retardants, OPs are becoming more widely used, yet no studies have investigated their effects on human fecundity and epigenetic perturbations in sperm. In this study we evaluated associations between urinary OP concentrations and DNA methylation profiles in sperm of men aged ≤35 years. After adjusting for potential confounding by age, BMI status and multiple testing, we found that participants with higher concentrations of urinary OP metabolites have significantly higher fractions of sperm cells that are aberrantly methylated at the DMRs of multiple growth regulating genes. Urinary ipPPP concentrations were related to hypermethylation at the MEG3, NDN, SNRPN DMRs. Our data further suggest similar but weak associations at the PLAGL1 and SNRPN DMRs by DPHP, and at the SGCE/PEG10 DMR, by ipPPP. An increase in urinary DPHP concentrations was correlated with a significant higher fraction of methylated sperm cells at the GRB10 DMR. Urinary BDCIPP concentrations were associated with lower methylation levels at imprinted genes that are expected to be fully methylated; this was the case at the MEG3-IG and H19 DMRs. Interestingly, analyses of potential effects from multiple exposures revealed enhanced hypermethylation at the MEG3 and SNRPN DMRs. Our data suggest that the addition of a third OP was responsible for this observation. Although it is currently not clear what the consequences are if a fraction of the sperm cells are aberrantly methylated, the following information regarding these potentially OP-affected imprinted gene regions has been reported in literature. MEG3 is a long non-coding RNA that activates p53 and inhibits tumorigenesis. In various cancer types hypermethylation at the MEG3 promotor has been observed, suggesting that if both maternal and paternal alleles are methylated this gene is silenced and its tumor suppressor activity in the cell is lost [48, 49]. Studies on imprinting disorders, including Prader–Willi syndrome, provided evidence that defects at NDN and SNRPN result in hyperphagia (overeating) and obesity [50, 51]. Aberrant methylation at promoter regions of PLAGL1 and SGCE have been related with metabolic diseases and cancer [52, 53]. Further, it is known that the imprinted gene GRB10 is maternally expressed and that its product inhibits fetal and placental growth [54]. The paternal allele is normally not methylated in sperm, but overexpression of Grb10 in transgenic mice has been associated with growth retardation, glucose intolerance and insulin resistance [55, 56]. Although we measured only small differences by OP exposure, if fertilization were to occur successfully with a sperm cell that is aberrantly methylated at one of the genes described above the consequences for the offspring are detrimental. For instance, our interquartile calculations showed that a higher exposure to ipPPP could result in an increase of 0.4% sperm cells being aberrantly methylated at MEG3 CpG2. On an individual level this can be translated to 400 000 aberrant sperm cells in an ejaculate of 100 million cells, associated with the OP exposure. Although the chance is low that this individual will father a child carrying this particular mark, on a population level this could be translated in an increase of 0.4% offspring carrying at least one affected CpG site, caused by paternal exposure to this particular environmental toxin. This estimate is possibly an underestimation, given our data shows that one chemical is able to affect multiple CpG sites and genes and the multiplicity of toxins in our environment may result in larger responses. Indeed, we found that presence of multiple OP exposures in our subjects was related to a higher probability of increased sperm DNA methylation. Literature supports this finding. Mixtures of endocrine disrupting plastics administered in gestating female rats resulted in DNA methylation alterations in sperm of the F3 offspring generation at DMRs of several gene promoters [3].
Further, we measured the following trend: if one CpG site was aberrantly methylated the others were affected as well (although not always significant). Because of technical limitations it was not possible to deduce from our measurements if the aberrant methylation pattern at each specific CpG site concerned the same sperm cell; analyses on a single cell level are necessary to verify this. Furthermore, the mean methylation across all CpG sites of each DMR followed the same trend as predicted from single CpG analyses, suggesting the same mode of action at most CpGs of the DMR through OP exposure.
More research is needed to better understand the long-term (health) effects of methylation changes at imprinted genes. We further noted some overlap in affected DMRs sites by ipPPP and DPHP. This could be explained by the fact that their metabolites were correlated (ρ = 0.28; P = 0.021) and that these OPs could originate from similar sources, such as Firemaster® 550 (FM550). This new flame-retardant contains TPHP, ipPDPP, 2-ethylhexyl-2,3,4,5-tetrabromobenzoate, bis(2-ethylhexyl)-2,3,4,5,-tetra-bromophthalate, and additional isoproplylated triaryl phosphate isomers. Recently, FM550's safety and potential health risks have been questioned [57–59]. In our study population, presence of chlorinated (BDCIPP) and non-chlorinated (DPHP) OPs was also highly correlated (P = 0.0067), likely because they are used as flame-retardants and plasticizers and may be found in the same products. Both BDCIPP and DPHP affected the GRB10 and MEG3-IG DMRs. Besides common sources, it is also possible that the OPs studied influence the same endocrine pathway and ultimately affect the DMR region. Our findings that urinary biomarkers for flame-retardants or organochlorine pollutants are associated with male reproductive health and sperm parameters are consistent with previous studies [10, 11, 60]. For instance, a significant inverse correlation was shown between urinary DPHP and BDCIPP and sperm motility and concentration [61]. In our study population we found a weak inverse association between exposure to ipPPP and total motile sperm count (TMC), but could not confirm an association between other OPs and clinical sperm characteristics. After supplementary analyses on potential correlations between DNA methylation and TMC, our results indicated an inverse relationship. Specifically, we noticed that the effect of ipPPP on the MEG3 DMR was paralleled by a decrease in TMC. It has been documented that when considering epigenetic endpoints in epidemiological studies in relation to a low-dose range of environmental chemical exposures the phenotypic effects or disorders are not always measurable [62]. Although more research is needed to confirm our results, our study provides novel findings linking low-dose exposures to OPs with aberrant DNA methylation and suggests this may be an indicator of lower sperm quality and potentially also infertility. In order to provide insights regarding the mechanisms of action for OPs on sperm development it is of interest to consider the nature of the effect sizes of the OPs on sperm DNA methylation; particularly at imprinted genes, where changes are transmissible to the next generation. Although our sample size is small, our results indicate larger effects on DMRs that are expected to be unmethylated in sperm, compared with the DMRs that are paternally methylated. A possible explanation for this could be that during the final stages of spermatogenesis, methylation processes are disrupted by environmental OP exposure. Normally, maternally methylated DMRs do not acquire DNA methylation in sperm cells, and paternally methylated DMRs are fully methylated in mature sperm. An exception is the MEG3 DMR that only acquires DNA methylation post fertilization [16]. We hypothesize that endocrine disruptors induce methylation at DMRs that are expected to be unmethylated through overexpression of DNMT enzymes. Evidence for this hypothesis exists in animal models, where low-dose exposures to BPA were correlated with hypermethylation at the ERα gene; this was paralleled with an increase in Dnmt1, Dnmt3a, and Dnmt3b expression [63, 64]. These enzymes catalyze DNA methylation during the final stages of sperm development. Although we did not verify the levels of DNMTs in our samples, it would be interesting to further explore these and other components of the epigenetic machinery in relation to exposures to environmental pollutants. If an affected sperm cell fertilizes an oocyte, the zygote can inherit and maintain this epigenetic alteration, since imprinted gene-associated DNA methylation patterns are retained through the period of post-fertilization reprogramming. It is presently unclear if and how the changes that we observed in the current study would affect health of the offspring. Most epidemiological studies collect data on mother–child pairs, with less focus on paternal exposures or potential defects in the sperm epigenome. For instance, a recent epidemiological study suggested that in utero exposures to OP pesticides alter glucose metabolism at birth in a sex-dependent manner [65], suggesting involvement of an epigenetic response. Animal models provided evidence that environmental toxins, such as fungicides, plasticizers, dioxin, hydrocarbons and alcohol, can all affect the epigenome through the germ line. These chemicals were found to cause late-onset chronic diseases in subsequent generations, including obesity and reproductive disorders [2, 3, 66, 67]. For instance, Stouder et al. showed that in utero exposure to alcohol resulted in a 3% decrease in the number of methylated CpGs at H19 in offspring sperm [67]. A study by Liang et al. showed a “dose–response” effect. Increasing alcohol concentrations in male mice altered sperm DNA methylation at imprinted genes and hearing loss was observed in the offspring [68]. Stouder and Paoloni-Giacobino also reported deleterious effects of the endocrine disruptors vinclozin (fungicide) and methoxychlor (insecticide) at the level of imprinted genes in sperm of mice [69, 70]. Methoxychlor induced an increase in DNA methylation of at the maternally imprinted genes Snrpn, Peg3, and Peg1/Mest (ranging from 7 to 11%, depending on the gene); and a decrease of 4% was measured at the paternally imprinted Dlk1/Meg3 domain [70]. Our study was performed on a different group of endocrine disruptors and was limited to relative low levels of exposure in human. This could explain why our results on imprinted genes were at a lower range, but still they are consistent with what was reported by Stouder et al. Hence, we hypothesize that these types of toxins influence the same network of genes that orchestrates specific cellular pathways.
We attempted to determine if specific occupational or housing exposures could be at the origin of our results, but we found no suggestive associations. For instance, twelve men have worked in occupations with potential increased OP exposures, but no associations were found with the OPs studied in this study (not shown). Hence, our results are reflective of young males with moderate to low (chronic) exposures and without any indication of occupational exposures or sources of exposure to high concentrations of hazardous materials. In our population of young male participants, DPHP and BDCIPP were most abundant; ipPPP was also frequently present in participants' urine samples. This suggests that their parent compounds are ubiquitously present in the environment, which is in agreement with other studies in the US [41, 42, 71, 72]. Given that parent chemicals, such as TPHP and TDCIPP, are rapidly eliminated from the body, detecting their metabolites in urine suggests a continuously present source, such as contaminated indoor dust [73]. Frequencies of most OPs were comparable with those of another study performed in the same area [42]. Low frequencies of tbPPP and BCIPP could theoretically be explained by lower exposure levels, or a different metabolic turnover rate. As we suggested earlier, the existence of epigenetic windows of susceptibility to environmental insults during sperm differentiation [4], including the final reproductive cycle of about 74 days (to produce spermatozoa from spermatocytes), it is possible that a relatively recent exposure from the (indoor) environment could be at the origin of small methylation defects. Increasing evidence in animal models supports the idea that epigenetic marks acquired during spermatogenesis from exposures to paint, solvents, pesticides, plastics, etc. can be sustained through embryonic development, causing phenotypic changes in the offspring; reviewed in the same reference [4].
The distribution of BMI in our TIEGER study population is not representative of young men in North Carolina. We corrected for BMI status and age, and we repeated our analyses in a subgroup of men with normal weight and found no major differences in our results. We also controlled for patient-status and performed a second sensitivity test where only non-patients were included, but these approaches did not change our final results (data not shown). A weakness of our study is the small sample size. Furthermore, our study sample was limited to Caucasian subjects only, while North Carolina also includes substantial populations from other ethnic backgrounds. Another potential limitation of our study is the fact that we collected spot urine samples instead of 24 hour urine samples. However, a recent study showed that urinary concentrations of BDCIPP and DPHP remain relatively constant throughout the day in adult volunteers [73]. A strength of our study is the simultaneous collection of urine and sperm in a group of young men, hence potential future fathers.
In summary, we linked measurements of metabolites of OPs in urine with epigenetic changes in sperm DNA. Although OPs are widely used in consumer products, to our knowledge, no other studies have been performed on the potential effects of OPs on the sperm epigenome. Our data show that aberrant DNA methylation patterns are present in sperm when the exposure to OPs is increased. Should these findings be replicated in a larger study, and if indoor contamination from flame-retardants affects the sperm epigenome, fecundity can be affected. Furthermore, if the environmentally induced “signature” is maintained through in utero development, the next generation will potentially generate the phenotype or develop the disease that is related to imprinting defects at the affected gene; including metabolic disorders, mental health disorders, or cancer.
Supplementary Data
Supplementary data is available at EnvEpig online.
Authors’ Contribution
A.S. initiated the research question and study hypothesis. A.S. and C.H. developed the epidemiological study design. H.S. and S.M. developed the experimental study design. T.P. oversaw patient recruitment and semen analyses. SM oversaw laboratory DNA methylation analyses. H.S. oversaw the OP analyses. C.B. designed the OP analyses and generated data. S.F. performed the statistical analyses. All authors contributed to the writing of the manuscript and have given their final approval for publication.
Acknowledgements
We thank the participants of the TIEGER Study, without them this study would not have been possible. We gratefully acknowledge Pam Brown, R.N., for clinical research coordination, Erin White, M.Sc., for her clinical contributions, Zhiqing Huang, MD, PhD, for pyrosequencing assay design and validation, and Carole Grenier, B.Sc., for outstanding laboratory assistance.
Funding
This work was supported by a Health and the Environment award from the Duke Cancer Institute and the Duke Nicholas School of the Environment, and a research grant from KU Leuven University [OT/14/109].
Conflict of interest statement. None declared.
References
