


Abstract
With the rapid development of next-generation sequencing technology, many laboratories have produced a large amount of single-cell transcriptome data of blood and tissue samples from patients with autoimmune diseases, which enables in-depth studies of the relationship between gene transcription and autoimmune diseases. However, there is still a lack of a database that integrates the large amount of autoimmune disease transcriptome sequencing data and conducts effective analysis. In this study, we developed a user-friendly web database tool, Interactive Analysis and Atlas for Autoimmune disease (IAAA), which integrates bulk RNA-seq data of 929 samples of 10 autoimmune diseases and single-cell RNA-seq data of 783 203 cells in 96 samples of 6 autoimmune diseases. IAAA also provides customizable analysis modules, including gene expression, difference, correlation, similar gene detection and cell–cell interaction, and can display results in three formats (plot, table and pdf) through custom parameters. IAAA provides valuable data resources for researchers studying autoimmune diseases and helps users deeply explore the potential value of the current transcriptome data. IAAA is available.
Database URL: http://galaxy.ustc.edu.cn/IAAA
Introduction
Epidemiological studies have shown that autoimmune diseases occur in up to 3–5% of the general population (1). The pathogenesis of autoimmune diseases is diverse, and there is strong heterogeneity between patients and different affected parts, making it a great challenge to develop effective drugs to cure these diseases without side effects (2). High-throughput transcriptome sequencing (RNA-seq) technology, especially single-cell RNA sequencing (scRNA-seq), has been widely used to systematically delineate autoimmune disease-relevant genes and their functions at disease stages (3). scRNA-seq analysis enables a deeper understanding of the microenvironment and the intercellular heterogeneity of peripheral blood or lesions in autoimmune diseases (4). Comparison of the scRNA-seq data between healthy people and patients with autoimmune diseases helps to discover specific cell subtypes associated with the disease and can then be further used to identify candidate genes for drug targets (5), whose expression signals are often submerged in bulk RNA-seq data. In general, these transcriptome-wide scale studies have accumulated many valuable data resources for the research of autoimmune diseases and greatly facilitate the identification of potential biomarkers for disease classification and diagnosis and candidate drug targets (6).
In recent years, researchers have developed multiple autoimmune disease-related databases, such as dAUTObase (7), The Autoimmune Disease Database (AIDB) (8) and A Gene and Autoimmiune Disease Association Database (GAAD) (9), to facilitate studies on autoimmune diseases. Among them, dAUTObase provides the incidence of autoimmune diseases in different countries and regions around the world, and AIDB and GAAD provide information on the relationship of critical genes with relevant diseases. However, compared to the large amount of transcriptome data of autoimmune diseases that have been accumulated, key information, such as cell subtype-specific gene expression and cell–cell interactions, which were hidden in these data resources, is far from being fully exploited.
In view of the great application potential of transcriptome data in clinical disease diagnosis and treatment, especially single-cell transcriptome data, and there is currently a lack of database dedicated to integrating and mining autoimmune disease transcriptome data, we developed IAAA, an autoimmune disease transcriptome database website with an online interactive data analysis module. IAAA collected published bulk RNA-seq data of 929 peripheral blood samples from 10 diseases, including ankylosing spondylitis (AS), Crohn’s disease (CD), juvenile idiopathic arthritis, polymyositis, psoriasis (PS), dermatomyositis, multiple sclerosis (MS), rheumatoid arthritis (RA), systemic lupus erythematosus (SLE) and ulcerative colitis (UC), and scRNA-seq data of 783 203 cells from 96 samples of 6 diseases, including CD, MS, RA, Sjögren’s syndrome (SjS), SLE, systemic sclerosis (SSc) and UC. In the bulk RNA-seq analysis section, users can view the expression of genes of interest between different diseases, perform differential analysis and identify genes with similar expression patterns via correlation analysis. In the scRNA-seq analysis section, users can easily view the expression of genes of interest in different cell subtypes, obtain genes that are differentially expressed in specific cell subtypes under different disease conditions and construct the cell–cell interaction networks.
Materials and methods
Data collection and processing
We collected autoimmune disease data sets from the Sequence Read Archive database (10) and Gene Expression Omnibus (GEO) database (11). We collected RNA-seq data for 10 diseases from 12 data sets and scRNA-seq data for 6 diseases from 8 data sets. The RNA-seq data included 986 peripheral blood samples, while the scRNA-seq data included 783 203 cells from 96 samples and 6 tissues. For each data set, we carefully read the original paper and extracted corresponding data annotations regarding tissue, sample and disease.
For bulk RNA-seq data, we used Trimmomatic (12) software (LEADING: 3 TRAILING: 3 SLIDINGWINDOW: 4:15 MINLEN: 40) to trim the sequencing adapters and filter out low-quality reads and used STAR (13) (—outSAMtype BAM SortedByCoordinate—quantMode TranscriptomeSAM GeneCounts) to align the reads to the reference genome hg38. We filtered the samples (‘UniquelymappedPercent’ ≥50%, ‘MultimappedPercent’ ≤40%, ‘UnmappedPercent’ ≤10%, and ‘number of total reads’ ≥10e6.5) and used our custom Python script to perform gene expression quantification to obtain the raw read count matrix. After quantification, we used the R package DESeaq2 (14) to normalize the data and remove batch effect of data sets (with the parameter ‘design = ∼ dataset’). We then filtered out the samples with fewer than 16 000 expressed genes. In total, we obtained 929 bulk RNA-seq data sets.
For scRNA-seq data, we downloaded the processed cell–gene expression matrix. Due to the low quality of the processed expression matrix of two data sets (GSE125527 and GSE157278), we used 10× Genomics Cell Ranger 6.0.1. to reprocess their raw data to obtain the cell–gene expression matrix. We used the R package Seurat (15) to take the union of genes in all data sets and filtered out genes that were not found in the reference genome Encyclopædia of genes and gene variants (GENCODE) comprehensive gene annotation (version GRCh38.p13). We then integrated the data sets and removed the cells with fewer than 500 detected genes. Ultimately, we obtained a single-cell transcriptome of 783 203 cells from 96 samples.
We used the R package Harmony (16) to integrate different data sets from different tissues and samples (‘kmeans_init_nstart’ = 20 and ‘kmeans_init_iter_max’=100) and used Uniform Manifold Approximation and Projection (UMAP) to perform further dimension reduction illustration of the Harmony space (’dims’ = 20). We used the Louvain algorithm to cluster the cells (‘resolution’ = 0.8) and used the R package SingleR (17) to annotate the cell clusters based on the expression of known marker genes. The cells of the same tissue from different data sets were closely clustered together in the UMAP after Harmony integration. To identify potential cellular communication between cell subtypes, we applied the CellPhoneDB (18) algorithm to the scRNA-seq profiles. We removed the ligand–receptor pairs in which ‘Receptor1’ and ‘Receptor2’ were both ‘ligands’ in the CellPhoneDB results.
Framework
The IAAA is a website freely available to all users and automatically adjusts to the users’ devices and browsers. Users can visit this website on desktop, tablet and mobile phone without logging in. The website is built by Python’s Django framework combined with jQuery to achieve data interaction through AJAX. The backend program uses scanpy (19) for data storage and calculation.
The user obtains the analysis result by submitting the input form to the backend. First, the program will obtain the form information from the front frontend, and then, the program will check whether the parameters are correct. If an error occurs, an error warning is returned. If the input parameters are all correct, the program will obtain data from the backend and perform calculations. Finally, the program returns the analysis results from the backend to the frontend (Figure 1).
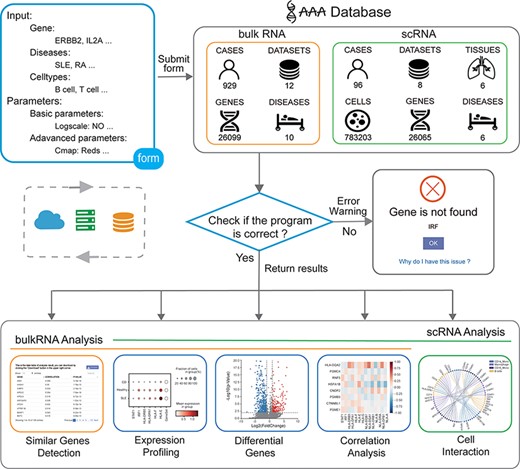
Overview of the IAAA database. The user can submit a custom form; the background obtains data from the database according to the form and finally checks whether the program performs the analysis function correctly. Returns the result of the analysis upon success and returns an error warning in the event of failure.
The analysis function framework of IAAA consists of a ‘form’ and three types of results (‘plot’, ‘table’ and ‘pdf’) (Figure 2A). Each analysis function with ‘form’ can return one or more types of results (Figure 2B).
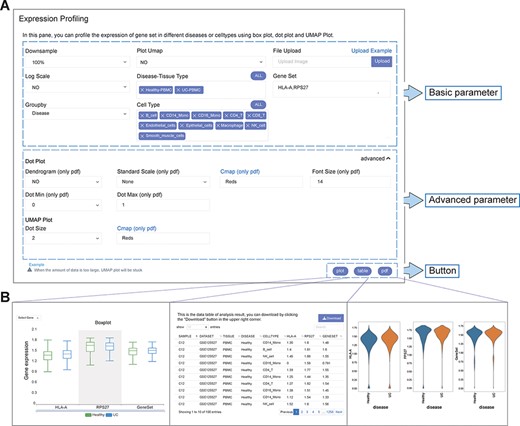
User-defined platform for functional analyses and output of analysis results. (A) The user-defined platform consists of three parts: basic parameters, advanced parameters and a button. The basic parameters include the parameters necessary for analysis, and the advanced parameters include several optional parameters. There are three buttons, corresponding to three types of results. (B) The ‘plot’ button returns the interactive analysis interface (left). The ‘table’ button returns the data table of the analysis results (middle). The ‘pdf’ button returns the PDF graph generated by the analysis results (right).
Each analysis function of IAAA provides a form with basic parameters, advanced parameters and submit buttons. The basic parameters are used to describe the basic characteristics of the input data (such as disease type and gene set). The basic parameters also include a ‘downsample’ function to support the selection of downsampled data from the original scRNA-seq data set for analysis in case the original scRNA-seq data set is too large to be displayed on the frontend. Advanced parameters include optional parameters that affect the visualization effect (such as font size and dot size). Users can customize these parameters and click the submit button (‘plot’, ‘table’ and ‘pdf’) to return the corresponding analysis results.
The result returned by the ‘plot’ function is a data visualization interactive page based on ECharts, which can return charts such as histograms, scatter plots and heatmaps. Users can interact with charts to explore data and obtain more information. If the user wants to view and download the data of the drawing chart, it can be obtained through the ‘table’ function. The ‘pdf’ function returns figures in PDF format. Parameters with ‘only pdf’ mean that this parameter only supports the image results in ‘pdf’ format.
Results
Analysis modules
General (bulkRNA & scRNA)
This page provides a search function. The user can enter the gene name (e.g. IL6) or disease (e.g. SLE) to check whether they exist in the bulk RNA-seq/scRNA-seq data and view relevant annotation information (Supplementary Figure S1A–B). Gene-related information was collected from the GeneCards website; disease-related information was collected from the literature (20–37). In the ‘scRNA analysis’ section, users can view the distribution of cells from different diseases or cell subtypes in a UMAP scatter plot (Figure 3A, Supplementary Figure S1C–F).
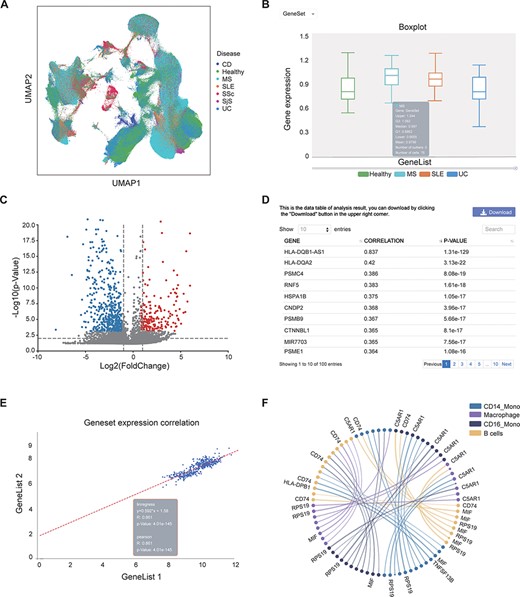
Examples of IAAA outputs. (A) UMAP plot showing the distribution of cells from healthy controls and several autoimmune diseases (i.e. CD, MS, SLE, SSc, SjS and UC) in scRNA-seq data. The UMAP plot is generated by the ‘general’ functions in IAAA. (B) Boxplot showing the expression of the type II interferon gene set (STAT1, IRF1, HLA-DRB5, HLA-DPA1, HLA-F, HLA-E, HLA-C, HLA-DQB1, HLA-DQA1, HLA-DRB1, HLA-B, HLA-DRA, HLA-DPB1 and HLA-A) in macrophages for scRNA-seq data from SLE, UC and MS patients. The boxplot is generated by ‘expression profiling’ functions in IAAA. (C) Volcano plot showing the differentially expressed genes between B cells and macrophages in MS patients for the scRNA-seq data. The volcano plot is generated by ‘differential analysis’ functions in IAAA. (D) The Pearson correlation of genes with the type II interferon gene set in bulk RNA-seq data generated by ‘similar gene detection’ functions in IAAA. (E) The Pearson correlation between two gene sets (type II interferon gene set and the high correlation gene set by similar gene detection functions) in bulk RNA-seq data by correlation analysis functions (scatter plot). (F) Circos plot showing the receptor–ligand pairs among B cells, CD14+ monocytes (CD14_Mono), CD16+ monocytes (CD16_Mono) and macrophages from PBMCs in SLE patients. The volcano plot is generated by ‘cell–cell interaction’ functions in IAAA. Mono, monocytes.
Expression profiling (bulkRNA & scRNA)
IAAA allows users to visualize the expression of genes of interest (gene symbol as input) or gene set (upload txt file) in different autoimmune diseases from both bulk RNA-seq and scRNA-seq data. These results can be presented in the form of boxplots, dotplots or UMAP plots (only available in the ‘scRNA analysis’ section) or in the form of a standardized expression table. In the ‘scRNA analysis’ section, in addition to visualizing the expression of specific diseases, one can also view the gene expression in specific cell subtypes. For example, users can view the expression of genes related to the type II interferon response (genes: STAT1, IRF1, HLA-drb5, HLA-DPA1, HLA-f, HLA-E, HLA-C, HLA-DQB1, HLA-DQA1, HLA-DRB1, HLA-B, HLA-DRA, HLA-DPB1 and HLA-A) (38) in all samples of the bulk RNA-seq data and all cells of the scRNA-seq data from healthy people and patients with SLE, UC and MS (Supplementary Figure S2A–D), where no significant differential expression was observed between the sample groups. One can also view the expression of type II interferon response genes in specific cell subtypes in scRNA-seq data by selecting the cell subtype of interest (e.g. macrophage) (Supplementary Figure S2E–F). We can see that the expression of this gene set in macrophages in MS patients is significantly different from that in healthy people (Figure 3B).
Differential analysis (bulkRNA & scRNA)
Compared with healthy control individuals, patients with autoimmune diseases usually express abnormally upregulated or downregulated genes. The genes differentially expressed in autoimmune diseases (e.g. cytokines and chemokines) are often potential targets for drugs. A recent study has shown that DESseaq2 may cause high false positive rate on RNA-seq data from human samples (39); therefore, IAAA used DESeaq2 for bulk RNA-seq normalization but not for differential analysis. IAAA allows users to choose a customized method for differential analysis (‘wilcoxon’ for Wilcoxon rank-sum test, ‘t-test’ for Student’s t-test and ‘t-test_overestim_var’ for Student’s t-test while overestimating the variance of each group). IAAA allows users to select different ‘P value’ and ‘log2foldchange’ as thresholds to screen for genes that are differentially expressed in a certain autoimmune disease of interest and display their expressions as volcano plot or statistical tables (Supplementary Figure S3). Users can thus compare the gene expression differences between different diseases. In the ‘scRNA analysis’ section, users can also compare the gene expression of different cell subtypes in the same diseases and that of the different diseases in the same cell subtype. For example, users can compare the gene expression differences between MS and healthy people in all cells (Supplementary Figure S3A–D), compare gene expression differences between MS and healthy B cells (Supplementary Figure S3F–G) and compare the gene expression differences between B cells and macrophages in MS (Supplementary Figure S3H, Figure 3C).
Correlation analysis (bulkRNA & scRNA)
This module performs pairwise gene correlation analysis for any two given gene sets of interest using correlation methods such as the Pearson, Spearman and Kendall methods. Before using this function, users can first use the ‘Similar Gene Detection (bulkRNA)’ function to obtain a gene set that is similar to a given gene of interest in a specific disease. For example, for gene sets related to the type II interferon response, users can first obtain the top genes (HLA-DQB1-AS1, HLA-DQA2, PSMC4, RNF5, HSPA1B, CNDP2, PSMB9, CTNNBL1 and PSME1) whose expressions are highly correlated with genes in the type II interferon response through the ‘similar gene detection (bulkRNA)’ function (Figure 3D, Supplementary Figure S4A) and then visualize the correlation between the expressions of the two gene sets in all cells in SLE patients (Figure 3E, Supplementary Figure S4B) and their correlation in CD14 monocyte and CD16 monocyte in SLE patients (Supplementary Figure S4C–D).
Similar gene detection (bulkRNA)
With this function, users can quickly identify genes that are similar in expression to a given set of genes of interest (e.g. drug target). Users can choose to search for those similarly expressed genes across the data set of one disease or multiple diseases. This function will report a list of genes with similar gene expression patterns to the input gene across any selected data sets (Figure 3D, Supplementary Figure S4A).
Cell–cell interaction (scRNA)
Identifying cell–cell interactions is essential to delineate the functions of cells in the immune system. We used CellPhoneDB, a repository of ligands, receptors and their interactions, to predict the cellular interactions between the cell subtypes based on scRNA-seq data from each disease and tissue. Users can visualize the interactions between different cell subtypes and select different ‘P value’ and ‘mean’ (receptor–ligand average expression) thresholds to screen receptor–ligand pairs with different significance levels. For example, users can view the cell–cell interactions and their associated ligand–receptor pairs between B cells, mono cells and macrophages in SLE-PBMC data (Figure 3F, Supplementary Figure S5).
Results availability
IAAA provides the analysis results in PDF format. Users can download the PDF and modify the image with Adobe Illustrator. If the current analysis function of the database is not enough to meet the needs of users, the website also provides data tables for download for further analysis. For each table, a ‘download’ button is provided. Note that if one wants to download the entire data table, he/she needs to change the parameter of the ‘show’ option to ‘ALL’. In addition, ‘BulkRNA Meta’ and ‘scRNA Meta’ under ‘DataSets’ in the navigation bar provide metadata of the bulk RNA-seq data and scRNA-seq data, respectively, and ‘Article Meta’ provides research-related information about the data we collected.
Documentation
Documentations are provided under the ‘Docs’ section, which includes ‘Q&A’, ‘Help’ and ‘About’. For beginners of IAAA, one can see the list of frequently asked questions and answers on the website under ‘Q&A’. In addition, one can also view the meaning of the parameters of each analysis function in ‘Help’. If one wants to know more about us, he/she can view the ‘About’ page. ‘Examples’ provides a tutorial video and comment area for each analysis function. Users can follow the video step by step to learn how to use the analysis tools. If one has any questions or suggestions about IAAA, he/she can also leave comments in the comment area. We will make improvements according to users’ constructive suggestions.
Discussion
The development of next-generation sequencing technology has greatly promoted the research of autoimmune diseases and has also generated a large amount of data. How to effectively analyze these data is a great challenge for biomedical researchers. The IAAA database we developed integrates a large amount of bulk transcriptome and single-cell transcriptome data of autoimmune diseases and provides corresponding transcriptomic data analysis modules, including gene expression, differential analysis, correlation, similar gene detection, cell–cell interaction and other analysis modules. Users can realize complex bulk and single-cell transcriptome data analysis with simple webpage operations and obtain intuitive analysis results. Overall, IAAA can help users quickly explore and mine transcriptomic data of autoimmune diseases.
The IAAA database consists of two parts, ‘scRNA analysis’ and ‘bulkRNA analysis’, which, respectively, include the most complete transcriptome and single-cell transcriptome data of autoimmune diseases thus far. We will continuously collect newly generated single-cell transcriptome data and update our database in real time. In addition, the currently rapidly developing single-cell multi-omics technology allows us to obtain multiple omics information in a single cell at the same time, allowing us to analyze the cell state in disease states from more dimensions to gain a deeper understanding of the complex molecular mechanism of the occurrence and development of autoimmune diseases. For example, by integrating single-cell chromatin accessibility and single-cell transcriptome data and identifying peak-to-gene linkages, it is helpful to analyze the regulatory mechanism of disease (40). In the future, we will integrate multi-omics data in IAAA and provide corresponding analysis function modules.
In general, the use of bioinformatics methods to analyze omics data has become a growing need. The main purpose of IAAA is to integrate a large amount of autoimmune omics data and provide a convenient and fast analysis tool to autoimmune disease researchers. In the future, we will supplement more autoimmune disease omics data, especially single-cell multi-omics data, and improve and add more analysis functions according to the users’ constructive feedback to help users study autoimmune diseases more deeply.
Supplementary data
Supplementary data are available at Database Online.
Acknowledgements
We thank the USTC Supercomputing Center and the School of Life Science Bioinformatics Center for providing computing resources for this project.
Funding
This work was supported by the National Key R&D Program of China (2020YFA0112200 to K.Q.), the National Natural Science Foundation of China grants (T2125012, 91940306, 31970858 and 31771428 to K.Q.; 81871479 to J.L.), CAS Project for Young Scientists in Basic Research (YSBR-005 to K.Q.), Anhui Province Science and Technology Key Program (202003a07020021 to K.Q.) and the Fundamental Research Funds for the Central Universities (YD2070002019, WK9110000141 and WK2070000158 to K.Q.; WK9100000001 to J.L).
Author contributions
K.Q. conceived the project. K.Q., J.L. and C.G. supervised the project. Z.S., M.F. and W.S. designed the framework and performed data analysis with help from M.T., N.L., L.Z. and Q.L. Z.S., M.F., W.S. and K.Q. wrote the manuscript with input from C.G., J.L. and all the other authors. All authors read and approved the final manuscript.
Conflict of interest
The authors declare that they have no competing interests.
References
Author notes
contributed equally to this work.
